Albanian Banking Sector Productivity Using Malmquist Index
Irini KalluciPhD Candidate, University of Tirana, Faculty of Economics, Rr. Elbasanit, Tirana, Albania Abstract
Measuring banks’ performance and productivity needs special attention, as for Albania, the banking industry remains the central part of the financial system. This paper estimates the productivity change in Albanian banking sector, using the Malmquist productivity index. The dataset includes the end of year data of 16 banks that operate in Albania, for the period 2006-2017. This paper aims to bring new insights on the productivity of Albanian banking sector, as this is a rarely treated topic in literature. The purpose of this paper is to measure Malmquist productivity index and its components, efficiency change and technological change for banks in Albania. The results show that Albanian banking sector for the period under analysis, experienced a decrease in productivity, which mainly is due to the lack of technical improvements. On the other side, efficiency has improved during this period, and this result is driven by improvements in pure efficiency and scale efficiency. The medium size banks have shown a total factor productivity increase, compared to large and small banks. Keywords: banking sector, productivity, Malmquist productivity index
1. Introduction
The financial soundness and stability of banking sector has become the most relevant issue, especially in the last decade, during and after financial crisis. As one of the main contributors of economic growth, the performance of banking sector merits a special attention. Usually, for measuring bank performance, the traditional analysis of different financial ratios is used, such as DuPont model, Return on Equity (ROE), Return on Assets (ROA), Net Interest Margin (NIM), etc. In the last decades, new techniques of measuring productivity and efficiency of banks have been developed.
Productivity change is broadly understood as the change in the level of output produced, for a given change in the level of input. Measuring this ratio becomes more challenging in a setting with multiple outputs and multiple inputs such as the banking industry (Guarda and Rouabah, 2009, p.151).
Productivity change reflects technical change and efficiency change. While the first measure relates to the shift in the production function (production frontier) over time, the second shows how far the average firm stays from the production frontier. According to Kirikal, Sõrg and Vensel (2004, p. 22), there are two basic approaches for the measurement of productivity change: the econometric estimation of a production, cost, or some other function, and the construction of index numbers using non-parametric methods.
In this paper, which aims to measure the Albanian banking sector’s productivity, I followed the second approach, using the Malmquist index. Malmquist productivity index was first proposed by Malmquist (1953) and then developed by Caves, Christensen and Diewert (1982). This index measures the total factor productivity, between two banks or one bank over time. To further explain, by using the Malmquist index, we may measure the productivity of a bank in period t, compared to its productivity in period t-1, or compared to the productivity of another bank in the same period t.
Productivity shows the level of outputs produced, for each input used. The higher the productivity of a firm, the better would be its performance. Productivity is considered as a relative concept and its changes are important at all levels – national, industrial, company and personal (Kendrick, 1993, cited in Kirikal, 2005). 2. Stylized facts for Albanian banking system
The Albanian banking system became a two-tier system in 1992, and since then, the Bank of Albania functions as the central bank and all commercial banks constitute the second tier of this system. The banking industry constitutes the main pillar of the financial system in Albania. According to Bank of Albania’s Financial Stability Report (2017), the banking sector’s assets account for nearly 93% of financial system’s assets and 92.5% of the country's GDP. Therefore, a large attention is paid to the activity and stability of banks, as being promoters of the country’s economic growth and development.
After the privatization of state banks and the entry of large international banks in the system, the activity of banks increased, and so did the number of products and services offered. With the aim of increasing market share, the number of banks’ branches increased considerably after 2004, in order to serve more people, even in remote areas. These developments simultaneously brought a substantial raise in number of banks’ employees.
The main sources of banks’ financing are deposits, capital and reserves. In this respect, banks would be able to credit the economy only if they manage to raise enough funds from their clients, mainly in the form of deposits. The high growth rate of deposits in the period 2004-2008 (around 20% in annual terms), created more opportunities to increase lending to the Albanian economy. Starting from very low initial levels, lending in
Albanian economy grew at a very rapid pace, especially after the privatization of the country's largest bank in 2004. This trend continued until 2009, and after that period, the credit growth rate has decreased substantially (and in some periods, even showing negative figures).
Credit to deposits ratio is often used as a measure of the banking system’s financial intermediation role. There is no optimal ratio set by regulators, but based on historical data and the prudence principle, international literature shows that values between 80% and 90% would indicate a good level of this ratio. For Albanian banking system, the credit to deposits ratio has reached its highest value at around 65% in 2009 and after that period it has decreased, reaching approximately 52% at the end of 2017.
3. Theoretical and empirical treatment of productivity 3.1 Literature review
In the last decades, an extensive literature is dedicated to banking sector’s productivity measurement.
Fukuyama (1995) measured the Japanese banking industry’s efficiency and productivity growth, for the period 1989-1991, by using nonparametric frontier techniques which allow for technical inefficiency and technological progress/regress. Berg, Forsund and Jansen (1992) introduced the Malmquist index as a measurement tool of banking sector’s productivity growth. They measured Norwegian banking system’s productivity in a period of deregulation and the results showed a productivity regress prior to deregulation, but rapid growth when deregulation took place. Favero and Papi (1995), through non-parametric DEA approach measured technical and scale efficiencies of Italian banks in a specific year (1991). They discuss the methodology of parametric and non-parametric approaches to measure efficiency. The traditional specification of inputs is modified when implementing both the Intermediation and the Asset Approach, in order to allow an explicit role for financial capital. Following that, the authors used regression analysis on a bank-specific measure of inefficiency, for identifying the determinants of banks' efficiency. Noulas (1997) compared efficiency and productivity differences among Greek state and private banks in the period 1991-1992. The results indicate that the sources of productivity for both state and private banks are different. State banks' productivity growth comes from technological progress, while private banks', from increased efficiency. Gilbert and Wilson (1998) measured through Malmquist indexes, the effects of privatization and deregulation on the productivity of banks in Korea during the period 1991-1994. The results indicated that Korean banks responded to privatization and deregulation by substantially altering their mix of inputs and outputs, yielding large changes in productivity. Hasan, Lozano-Vivas and Pastor (2000) evaluated the efficiency scores of banking industries of 10 European countries and they used a common frontier to control for the environmental conditions of each of these countries. From the results, it was derived that banks in Spain, Portugal and Denmark, were the most technically efficient, while banks in France and Italy were the least efficient. Schure, Wagenvoort and O’Brien (2004) estimated European banking sector efficiency during 1993-1997. The results indicated that large commercial banks showed to be more productive than the smaller ones. Angelidis and Lyroudi (2006), examined the productivity of 100 larger Italian banks in the period 2001-2002, measured by Malmquist index, which found to be 1.035. Its first subcomponent – technical change index was estimated at 0.559 and the second one – technical efficiency change index resulted equal to 1.853. While, Lyroudi and Angelidis (2006) evaluated the effectiveness in terms of productivity change of financial institutions of the ten latest members of the European Union for the period before their entry in the EU, 1996-2002. The Malmquist productivity index was calculated through non-parametric technique Data Envelopment Analysis (DEA) and was broken into technological change and technical efficiency change index to determine the exact source of efficiency. The results indicated that the total level of productivity had increased for half of the countries during the period. The authors used as variables in their estimations, three inputs (personnel expenses, other operating expenses and total fixed assets) and three outputs (total deposits, loans to customers and investments). The relationship between the size of banking institutions and productivity growth was not statistically significant, with the exception of Latvia, where this relationship was positive and significant. Rezitis (2006) studied the productivity growth of the Greek banking industry in the period 1982-1997, dividing this timeframe into two sub-periods (1982-1992 and 1993-1997) due to substantial changes experienced by the Greek banking sector after 1992. The author used DEA to measure technical efficiency and Malmquist Index technique to measure and decompose the total factor productivity growth. Intermediation approach was used to measure the productivity change, considering the intermediary role of banks. Rezitis (2006) used in his study three inputs (labor, capital expenses and deposits) and two outputs (loans and advances and investment assets). The study revealed that the banking sector growth until the year 1992 came due to technical development, while after that year derived from efficiency improvements. Using Tobit regression, the results showed a positive impact of size and specialization on pure and scale efficiency. Toçi (2009) explored the intermediation efficiency of four South-East European countries (Bulgaria, Croatia, Kosovo and Montenegro) over the period 2002-2005, using the non-parametric method, DEA technique. The author employed a two input-two output model for banks under analysis. The results revealed that banking sector efficiency of the four countries, showed progress for the period under investigation and this efficiency
improvement has originated from the change in technology rather than scale and technical efficiency. Kosovo’s banking system, although has shown some improvement, remained less efficient than the systems of other three countries. Based on the findings, the author recommends some policy implications, which would foster the intermediation efficiency of banks. Varesi (2015) measures the Albanian banking sector productivity comprising 16 banks, for the period 2008-2013, taking into account the consequences of the crisis, suffered from the Western Balkans and world economies. The Malmquist DEA method was used for measuring the Albanian banking sector total factor productivity (TFP), technological, technical and scale efficiency change. The author used two outputs (loans and interest income) and four inputs (number of full-time employees, total deposits, total assets and interest expenses). The results show that banks belonging to medium and small size classification (based on asset size), tend to be more productive than the large banks.
This study aims to contribute with the results it will generate, to the rare literature that exists on the productivity of Albanian banking sector. It covers a wider period (twelve years), includes all the banks that operate in Albania, and uses some different inputs or outputs from other authors (see for example Varesi, 2015). 3.2 Theoretical background on productivity
The traditional formula of measuring productivity is:
Productivity (1)
The calculation of this formula is very easy when a single input is used to produce a single output. Usually the literature admits that the inputs (I) may be mainly in the form of capital (C), labour (L), energy (E) and materials (M), used to produce outputs (O).
Measuring the output per each unit of one type of input is called “partial productivity”, or single-factor productivity (Note 1) and the relevant formula is:
Partial Productivity PP , , , ! (2)
On the other hand, if many inputs are used in the same time to generate one output, this complicates the calculation and interpretation of the formula (1). In this respect, a new kind of productivity should be measured, which is called “total productivity” (TP), or multi-factor productivity (MFP). Total productivity is measured as the ratio of output to the total (combination) of all inputs employed to produce it. The formula in this case would be:
Total Productivity TP # # # # ! (3)
Total productivity is an improved and more precise indicator, compared to other types of productivity measures, but it is also more complicated and difficult to be measured.
But in reality, firms use many inputs, for generating many outputs. How would be measured the productivity index in this case? One method very often used in this respect, is the calculation of Malmquist Index, which measures the change in productivity between different firms, or for the same firm, in different periods. 3.3 Methodology for measuring Malmquist Index
Productivity change derives from the change in the level of output produced, for a given change in the level of input. The two common methods used in evaluating productivity change are the nonparametric and the parametric approaches. According to Krishnasamy, Ridzwa and Perumal (2004), the nonparametric approaches include Data Envelopment Analysis (DEA) and Free Disposal Hull (FDH), while the parametric approaches consist of Stochastic Frontier Approach (SFA), Thick Frontier Approach (TFA) and Distribution Free Approach (DFA).
Different methods may be used to measure the distance function, which derives the Malmquist index, but the most popular one is DEA-like linear programming suggested by Färe et al. (1994). According to these authors, this index can be decomposed into two components: efficiency change (shifts relative to the best-practice frontier) and technical change (shifts in the best-best-practice frontier).
Referring to the increasing literature dealing with Malmquist productivity index, results that this index has some advantages: according to Grifell-Tatjé and Lovell (1996, quoted in Kirikal, 2005), the first advantage relates to the fact that it does not require information on the input and output prices, which is appropriate in the cases when prices are not available; second, it does not require the profit maximization or cost minimization assumption, which is particularly relevant in situations when for example the producers’ objectives are not known. The third advantage is evidenced by Färe et al. (1989, quoted in Kirikal, 2005), which is relevant in case the researcher uses panel data, because the index allows its decomposition into two components (technical efficiency change and technical change), for distinguishing the source of productivity change. Furthermore, the Malmquist index does not rely on econometric estimations, but on nonparametric approaches. The advantages of using a nonparametric approach are that it avoids imposing a parametric specification for the underlying technology as well as for the distributional assumption of the inefficiency term.
On the other hand, Malmquist index has some disadvantages: first, the need to estimate a distance function. Second, as it is a deterministic index, it does not permit statistical analysis (Kirikal, Sõrg and Vensel, 2004, p.22). Third, as a deterministic index, it assumes that all the variations from the frontier are attributed only to inefficiency and does not separate the errors or other stochastic effects.
Malmquist Productivity index uses distance functions to measure productivity change. Changes in productivity may be measured by an output-oriented or input-oriented approach. According to Kirikal, Sõrg and Vensel (2004), one way to measure the change in productivity is to see how much more output has been produced, using a given level of inputs and the present state of technology, relative to what could be produced under a given reference technology using the same level of inputs. An alternative is to measure change in productivity by examining the reduction in input use, which is feasible given the need to produce a given level of output under a reference technology. The first approach is called output-oriented and the second approach, input-oriented measure of productivity change.
There are two main approaches for measuring the flow of services provided by financial institutions, “production” approach and “intermediation” approach (Berger and Humphrey, 1997, p.30). Under the “production” approach, banks are considered as providers (producers) of financial products and services for their customers. The banks produce / process loans, deposits or other types of services (Note 2), which are considered as outputs under this model, while using labour, capital or other types of inputs. On the other hand, “intermediation” approach considers banks as intermediaries, which use deposits, labor or capital (as inputs) to offer loans or other investments (outputs) to customers who are short in funds.
Neither of these two approaches is perfect because neither fully captures the dual roles of financial institutions as (i) providing transactions/document processing services and (ii) being financial intermediaries that transfer funds from savers to investors (Berger and Humphrey, 1997, p.31).
Elyasiani and Mehdian (1990b) evidenced that the production approach can be applied only when data on functional cost analysis are available. In the circumstances when the data on the number of deposits and loan accounts are partly available, the use of production approach seems to be limited. On the other side, intermediation approach allows for the use of input and output values. Favero and Papi (1995, cited in Kamau, 2011, p.14) conclude that the intermediation approach is more appropriate for banks which turn deposits and funds received from other financial institutions, into loans or financial investments.
Following Färe et al. (1994), for measuring Malmquist Index, we should first define the distance functions in two different time periods, period t (Dt) and period t+1 (Dt+1).
Malmquist index in period t, measuring productivity in reference to period t technology, is: M(xt,yt) =
)
,
(
)
,
(
1 1 t t t t t ty
x
D
y
x
D
+ + (4)While Malmquist index in period t+1, measuring productivity in reference to period t+1 technology, is: M(xt+1,yt+1) =
)
,
(
)
,
(
1 1 1 1 t t t t t ty
x
D
y
x
D
+ + + + (5)Following Caves, Christensen and Diewert (1982) and Färe et al. (1994), the output-oriented Malmquist index (M), between period t and t+1, would be the geometric mean of two productivity indices calculated in (4) and (5) above (see equation (6)).
M(xt+1,yt+1, xt,yt) = 2 / 1 1 1 1 1 1 1
)
,
(
)
,
(
)
,
(
)
,
(
×
+ + + + + + t t t t t t t t t t t ty
x
D
y
x
D
y
x
D
y
x
D
(6) Färe et al. (1994) propose an equivalent way of writing equation (6) as:M(xt+1,yt+1, xt,yt) = 2 / 1 1 1 1 1 1 1 1 1 1
)
,
(
)
,
(
)
,
(
)
,
(
)
,
(
)
,
(
×
+ + + + + + + + + t t t t t t t t t t t t t t t t t ty
x
D
y
x
D
y
x
D
y
x
D
y
x
D
y
x
D
(7)The ratio outside the brackets measures the efficiency change (Note 3) between period t and t+1, and the second part of the formula (7), which is the geometric mean of two ratios in brackets, captures the shift in technology between two periods. Thus, the decomposed Malmquist productivity Index is:
M(xt+1,yt+1,xt,yt) = technical efficiency change x technological change (8)
Furthermore, efficiency change is decomposed into two other components: pure efficiency change (PECH) and scale efficiency change (SECH).
If the Malmquist productivity index is greater than 1, it shows an improvement in productivity (as it is a measure of total factor productivity change), as well as in efficiency and technology used for producing outputs, while a value of less than 1, indicates deterioration in these aspects.
respectively Dt(xt,yt), Dt(xt+1,yt+1), Dt+1(xt,yt), Dt+1(xt+1,yt+1). As they may be complicated to calculate, it is used DEA-like linear programming method.
4. Measurement of productivity for the Albanian banking sector 4.1 Data
The dataset includes end of year’s observations of 16 banks that operate in Albanian banking system, for the period 2006-2017. Calculating Malmquist Index through DEAP computer program requires a balanced panel of data and that panel starts since 2006.
As the largest number of papers that have treated the measurement of banking industry productivity, follow the intermediation approach, I will also follow this method in this study. Moreover, I choose to follow this approach, because banks are created for playing the intermediary role in a financial system. So it is more logical to measure this role, through Malmquist Index.
Another issue which is so much discussed between researchers is that of choosing the banks’ inputs and outputs to be used in the analysis. In the banking literature, there is some debate about what constitutes inputs and outputs for banks(Rezitis, 2006, p.127). Different authors have included different inputs and outputs in their measurements of productivity. Following the intermediation approach, the most common output used in the literature is “loans” and on the input side, “deposits” are mostly used.
In this paper, as intermediation approach will be considered, I will employ two outputs: loans (net of provisions) and interest income, both expressed in millions of Albanian lek, and four inputs: total deposits, net fixed assets, personnel expenses (in million lek) and number of bank’s branches.
Table 1: Correlation between output and input variables.
y1 y2 x1 x2 x3 x4 y1 1 y2 0.91320 1 x1 0.93013 0.95465 1 x2 0.81436 0.79465 0.8590 1 x3 0.91453 0.93002 0.9663 0.9002 1 x4 0.87870 0.90376 0.8747 0.7377 0.9066 1
Note: y1 (loans); y2 (interest income); x1 (total deposits); x2 (net fixed assets); x3 (personnel expenses); x4
(number of branches).
Table 1 shows the correlations between each of the outputs and inputs. Correlation between loans and deposits is high (0.93). The highest correlation is marked between deposits and personnel expenses, while the lowest seems between net fixed assets and number of branches.
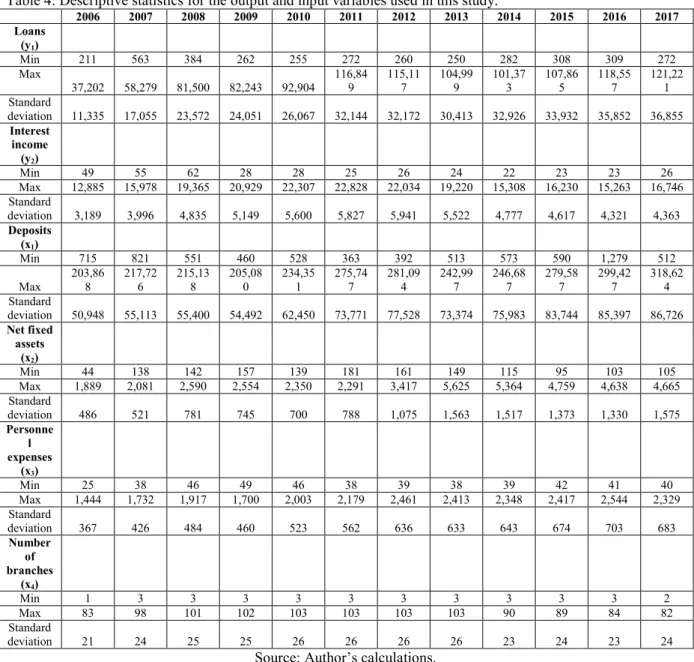
Meanwhile, table 4 presents the descriptive statistics for the outputs and inputs used in this paper, respectively the minimum, maximum and standard deviation of each indicator, through the years 2006-2017. 4.2 Results
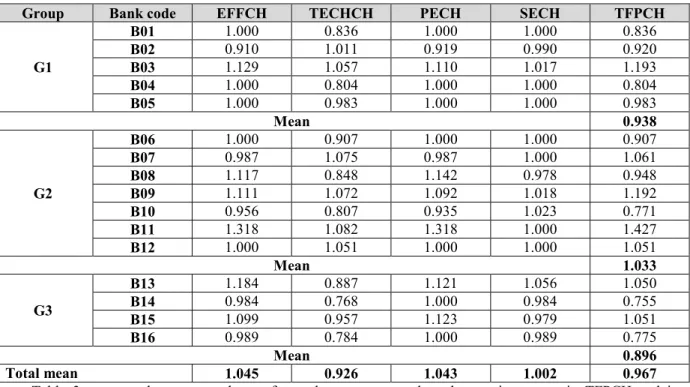
For calculating output-oriented Malmquist productivity index, in this study I used DEAP version 2.1 software, by Tim Coelli (1996). Table 2 presents the results generated, for each of 16 banks under analysis (Note 4), for total factor productivity change (TFPCH), its components efficiency change (EFFCH) and technological change (TECHCH) and the subcomponents of efficiency change, pure technical efficiency change (PECH) and scale efficiency change (SECH).
For the period 2006-2017, on average, the banking system has experienced an increase in efficiency by 4.5% and a decrease in technological aspect by 7.4%. A value of TECHCH, lower than 1, has also affected the total factor productivity change, resulting in an average decrease by 3.3%. Both subcomponents of efficiency change, has shown improvement during this period, respectively PECH=1.043 and SECH=1.002.
I divided into three groups the whole sample of banks under analysis, based on the supervisory method used considering their assets weight (Note 5). As table 2 presents, two of the largest banks (from G3), have shown a productivity increase during 2006-2017, by 5%. This increase is induced by the positive change in technical efficiency (with a larger impact coming from its pure efficiency component), while they have experienced a deterioration in technological improvement.
The medium size banks (G2 banks) are those that have experienced on average a total factor productivity increase during this period. Four of the banks of this group showed values of larger than 1 for TFPCH, a result mainly driven by the positive shift in technology. This result is in line with the findings of Varesi (2015), which concluded that medium and small size banks result to be more productive than the large banks.
From the five banks that fall under G1 group, only one bank shows increase in total factor productivity, which is derived from improvement in efficiency and technology of this bank. Three of the banks show no change in efficiency during the period 2006-2017, as EFFCH=1.
Table 2: Malmquist productivity index and its components, for each bank (2006-2017). Source: Author’s calculations
Group Bank code EFFCH TECHCH PECH SECH TFPCH
G1 B01 1.000 0.836 1.000 1.000 0.836 B02 0.910 1.011 0.919 0.990 0.920 B03 1.129 1.057 1.110 1.017 1.193 B04 1.000 0.804 1.000 1.000 0.804 B05 1.000 0.983 1.000 1.000 0.983 Mean 0.938 G2 B06 1.000 0.907 1.000 1.000 0.907 B07 0.987 1.075 0.987 1.000 1.061 B08 1.117 0.848 1.142 0.978 0.948 B09 1.111 1.072 1.092 1.018 1.192 B10 0.956 0.807 0.935 1.023 0.771 B11 1.318 1.082 1.318 1.000 1.427 B12 1.000 1.051 1.000 1.000 1.051 Mean 1.033 G3 B13 1.184 0.887 1.121 1.056 1.050 B14 0.984 0.768 1.000 0.984 0.755 B15 1.099 0.957 1.123 0.979 1.051 B16 0.989 0.784 1.000 0.989 0.775 Mean 0.896 Total mean 1.045 0.926 1.043 1.002 0.967
Table 3 presents the average change for each year compared to the previous year, in TFPCH and its components. The results show that efficiency change has been greater than 1, for the period 2006-2012 and after that period, it has shown regress. A considerable increase of EFFCH results in 2017, which has positively affected the total change in productivity for the whole banking system (increase by 19.2%, compared to the previous year). The lowest value of technological change is noticed in 2008, with the outburst of financial crises. This result comes in line with results of other authors (see Madhanagopal and Chandrasekaran, 2014) which conclude a decline in technological progress during and after crisis period, which might have happened due to competition between the banks for survival and having no possibility to focus on technological improvements. The same results derive in the study of Varesi (2015) for the Albanian banking sector analyzed during 2008-2013 period.
Table 3: Malmquist productivity index and its components, through the years. Source: Author’s calculations.
YEAR EFFCH TECHCH PECH SECH TFPCH
2006-2007 1.045 0.912 1.104 0.947 0.953 2007-2008 1.451 0.421 1.425 1.018 0.611 2008-2009 1.064 1.033 1.020 1.043 1.099 2009-2010 1.014 1.123 1.053 0.963 1.139 2010-2011 1.122 0.774 1.016 1.104 0.869 2011-2012 1.028 0.887 1.019 1.009 0.912 2012-2013 0.990 0.951 0.997 0.993 0.942 2013-2014 0.991 1.114 0.998 0.992 1.104 2014-2015 0.961 1.099 0.978 0.982 1.056 2015-2016 0.641 1.431 0.672 0.954 0.919 2016-2017 1.413 0.843 1.381 1.024 1.192 Mean 1.045 0.926 1.043 1.002 0.967 5. Conclusions
This paper estimated an output distance function to calculate the Malmquist productivity index which measures the total factor productivity change and its components: efficiency change and technical change. This paper aimed to measure the productivity and define the factors/components that affect it, contributing to the rare literature on Albanian banking sector productivity measurement.
The results taken, suggest that productivity of banks in Albania, on average, has decreased for the period 2006-2017. But it has also experienced values larger than 1 for specific years (i.e. 2009, 2010, 2014, 2015 and 2017). The decomposition of the Malmquist productivity index into its subcomponents shows that the productivity values are positively affected by efficiency change rather than by technological change. This means
that some of the banks in the sample are shifting towards the best frontier (are catching up). The efficiency change has been mainly driven from positive effects of pure and scale efficiency.
Productivity growth resulted higher (on average) for medium size banks (in terms of total assets), than for large and small banks. This comes in line with other authors’ conclusions.
Future research on this topic may focus on measuring Malmquist index, using alternative inputs or outputs. Another interesting area of research would also be the econometric analysis of the determinants of productivity of the banking sector.
References
Angelidis, D. & Lyroudi, K. (2006). Efficiency in the Italian Banking Industry: Data Envelopment Analysis and Neural Networks. International Research Journal of Finance and Economics, 5, 155-165.
Bank of Albania’s Financial Stability Report (2017), Available at: https://bankofalbania.org/.
Bank of Albania’s Annual Supervision Reports (2006-2017), Available at: https://bankofalbania.org/.
Berg, S. A., Forsund, F. & Jansen, E. (1992). Malmquist Indices of Productivity during the Deregulation of Norwegian Banking, 1980- 89. Scandinavian Journal of Economics, 94, 211-228.
Berger, A. N. & Humphrey, D. B. (1997). Efficiency of Financial Institutions: International Survey and Directions for Future Research. European Journal of Operational Research, 98, 175-212.
Caves, D.W., Christensen, L. R. & Diewert, W. E. (1982). The Economic Theory of Index Numbers and Measurement of Input, Output and Productivity. Econometrica, 50, 1393-1414.
Coelli, T. (1996). A Guide to DEAP Version 2.1: A Data Envelopment Analysis (Computer) Program. Center for Efficiency and Productivity Analysis Working Paper, No. 96/08, University of New England.
Elyasiani, E. & Median S. M. (1990b). Efficiency in the commercial banking industry. A production frontier approach. Applied Economics, 22, 539-551.
Färe et al.(1994). Productivity Growth, Technical Progress and Efficiency Change in Industrialized Countries. The American Economic Review, 84(1), 66-83.
Favero, C. & Papi, L. (1995). Technical efficiency and scale efficiency in the Italian banking sector: a non-parametric approach. Applied Economics, 27, 385-395.
Fukuyama, H. (1995). Measuring efficiency and productivity growth in Japanese banking: a nonparametric frontier approach. Applied Financial Economics, 5, 95-107.
Gilbert, R. A. & Wilson P. W. (1998). Effects of deregulation on the productivity of Korean banks. Journal of Economics and Business, 50, 133-155.
Guarda, P. & Rouabah, A. (2009). Bank Productivity and Efficiency in Luxembourg: Malmquist Indices from a Parametric Output Distance Function. SUERF Studies: 2009/4, 151-166.
Hasan, I., Lozano-Vivas A. & Pastor J. (2000). Cross-border Performance in European Banking. Bank of Finland Discussion Paper No. 24/2000.
Kamau, W. A. (2011). Intermediation efficiency and productivity of the banking sector in Kenya. Interdisciplinary Journal of Research in Business, 1(9), 12-26.
Kirikal, L., Sõrg, M. & Vensel, V. (2004). Estonian Banking Sector Performance Analysis Using Malmquist Indexes And DuPont Financial Ratio Analysis. International Business & Economics Research Journal, 3(12), 21-36.
Kirikal, L. (2005). Productivity, the Malmquist Index and the Empirical Study of Banks in Estonia. PhD thesis. Tallinn University of Technology. Available at: https://digi.lib.ttu.ee/archives/2006/2006-07/1153225915.pdf
Krishnasamy, G., Ridzwa, H. A., & Perumal, V. (2004). Malaysian post merger banks' productivity: application of Malmquist productivity index. Managerial Finance, 30(4), 63-74.
Lyroudi, K. & Angelidis, D. (2006). Measuring banking productivity of the most recent European Union member countries; A non-parametric approach. Journal of Economics and Business, IX(1), 37-57.
Madhanagopal, R. & Chandrasekaran R. (2014). Global Economic Crisis and Productivity Changes of Banks in India: A DEA-MPI Analysis. International Journal of Data Envelopment Analysis and *Operations Research*, 1(3), 40-48.
Malmquist, S. (1953). Index numbers and indifference surfaces. Trabajos de Estatistica, 4, 209-242.
Noulas, A. (1997). Productivity growth in the Hellenic banking industry: state versus private banks. Applied Financial Economics, 7, 223-228.
OECD (2001). Measuring Productivity: Measurement of Aggregate and Industry – Level Productivity Growth. OECD Manual 2001. Available at: http://www.oecd.org/sdd/productivity-stats/2352458.pdf
Rezitis, N. A. (2006). Productivity Growth in the Greek Banking Industry: A Non-Parametric Approach. Journal of Applied Economics, IX(1), 119-138.
Schure, P., Wagenvoort, R., O’Brien, D. (2004). The efficiency and the conduct of European banks: Developments after 1992. Review of Financial Economics,13, 371- 396.
Toçi, Z. V. (2010). Efficiency of Banks in South - East Europe: with special reference to Kosovo. Central Bank of the Republic of Kosovo Working Papers, 4.
Varesi, L. (2015). Measuring the productivity of a mainly foreign owned banking sector using non-parametric approach; Case of Albania. The 2015 WEI International Academic Conference Proceedings, Athens, Greece, 37-56.
Notes
Note 1. Please refer to OECD Glossary of statistical terms.
Note 2. Such as credit reports, checks or other payment instruments, and insurance policy or claim forms (see Berger and Humphrey, 1997).
Note 3. According to Färe et al. (1994), efficiency change shows the change in how far observed production is from maximum potential production.
Note 4. For confidentiality reasons, I have not displayed the name of the banks, but instead I used codes of numbers, for each of the banks.
Note 5. Banks with an asset weight up to 2% of banking system’s assets (as of December 2017), are classified under G1 - small banks; banks with an asset weight between 2% and 7% of banking system’s assets, are classified under G2 – medium size banks, and the remaining banks (with an asset weight of more than 7%), are classified under G3 – large banks.
Table 4: Descriptive statistics for the output and input variables used in this study.
2006 2007 2008 2009 2010 2011 2012 2013 2014 2015 2016 2017 Loans (y1) Min 211 563 384 262 255 272 260 250 282 308 309 272 Max 37,202 58,279 81,500 82,243 92,904 116,849 115,117 104,999 101,373 107,865 118,557 121,221 Standard deviation 11,335 17,055 23,572 24,051 26,067 32,144 32,172 30,413 32,926 33,932 35,852 36,855 Interest income (y2) Min 49 55 62 28 28 25 26 24 22 23 23 26 Max 12,885 15,978 19,365 20,929 22,307 22,828 22,034 19,220 15,308 16,230 15,263 16,746 Standard deviation 3,189 3,996 4,835 5,149 5,600 5,827 5,941 5,522 4,777 4,617 4,321 4,363 Deposits (x1) Min 715 821 551 460 528 363 392 513 573 590 1,279 512 Max 203,868 217,726 215,138 205,080 234,351 275,747 281,094 242,997 246,687 279,587 299,427 318,624 Standard deviation 50,948 55,113 55,400 54,492 62,450 73,771 77,528 73,374 75,983 83,744 85,397 86,726 Net fixed assets (x2) Min 44 138 142 157 139 181 161 149 115 95 103 105 Max 1,889 2,081 2,590 2,554 2,350 2,291 3,417 5,625 5,364 4,759 4,638 4,665 Standard deviation 486 521 781 745 700 788 1,075 1,563 1,517 1,373 1,330 1,575 Personne l expenses (x3) Min 25 38 46 49 46 38 39 38 39 42 41 40 Max 1,444 1,732 1,917 1,700 2,003 2,179 2,461 2,413 2,348 2,417 2,544 2,329 Standard deviation 367 426 484 460 523 562 636 633 643 674 703 683 Number of branches (x4) Min 1 3 3 3 3 3 3 3 3 3 3 2 Max 83 98 101 102 103 103 103 103 90 89 84 82 Standard deviation 21 24 25 25 26 26 26 26 23 24 23 24