IRISH SOLAR ENERGY
ASSOCIATION
Response to the Renewable Electricity Support Scheme, Technology Review, DCENR
Table of Contents
Executive Summary ... 3
1.
Introduction ... 5
1.1 Utility-‐scale Solar Projects ... 5
1.2 Domestic Rooftop (< 10 kW) Solar Installations ... 6
1.3 Commercial Rooftop Solar Projects ... 6
2. Benefits of Solar ... 8
2.1 Climate Change and Energy Security ... 8
2.2 Job Creation ... 8
2.3 Agriculture and Biodiversity ... 10
2.4 Complement to Wind ... 11
2.5 Economic and Social Benefits ... 12
3. Costs of Solar ... 13
3.1 Cost Summary for Utility-‐scale Solar Projects ... 13
3.11 Utility-‐scale EPC Costs ... 13
3.12 Funding Costs ... 14
3.13 Case Study: 5 MW Solar Farm in Kildare ... 14
3.14 Operating Costs ... 15
3.15 Valuation Model ... 15
3.16 Forecast of Competitively Outcome from Auction ... 16
3.2 Cost summary for Domestic and Commercial Rooftop solar PV projects ... 17
3.21 Domestic Rooftop PV Cost Summary ... 18
3.22 Commercial Rooftop Scale EPC Costs ... 19
4.
Deployment ... 21
4.1 Costs of Deployment – Utility Scale ... 21
4.2 Costs of Deployment – Rooftop ... 23
5.
Support Scheme – Subsidy ... 25
5.1 Utility-‐scale Solar Projects ... 25
5.11 Auction Mechanism ... 25
5.12 Structure of Support ... 26
5.13 “Market Premium” and Market Reference Prices, Including Balancing Costs ... 26
5.14 Duration of Support ... 26
5.15 Support Counterparties ... 26
5.16 REFIT R-‐Factor Reconciliation, Setting of PSO Levy ... 27
5.17 Separate Competition and Budget ... 27
Case Study: Contracts for Difference (CfD) in the UK ... 28
5.2 Commercial Rooftop and Domestic Rooftop (< 6 kw) ... 28
5.21 Feed-‐In-‐Tariff Mechanism ... 28
5.22 Structure of Support – Rooftop ... 30
5.23 Duration of Support ... 30
Case Study: FiT in Germany ... 31
Appendix: Answers to Consultation Questions ... 32
Process Layout and Approach ... 32
Policy Context ... 33
Technology related ... 34
Eligibility ... 37
Support mechanism ... 37
Allocation ... 37
Scheme Limits / Cost controls ... 38
Tariffs ... 39
Tariff from Auction – Utility Scale ... 40
Generation tariff -‐ Roof top ... 41
Appendix I: Solar PV Jobs in Ireland ... 42
Employment Generated ... 42
Potential Employment Projections for Ireland: ... 43
Appendix II: ISEA Members ... 44
Executive Summary
In July 2014, the Irish Solar Energy Association (‘ISEA’), through its submission for the Green Paper on Energy Policy in Ireland, made the case for solar energy in Ireland. A combination of falling costs, improved technology levels and increased availability of finance means that, with the right level of government support, solar PV could be rapidly deployed in Ireland with the potential to provide between 10% and 20% of Ireland’s renewable energy requirements by 2020. Combined with the ongoing rollout of onshore wind, this would ensure that the Ireland would easily exceed the projected target of 4,000 Megawatts (‘MW’) of renewable energy capacity by 2020.
The purpose of this submission by ISEA to the Department of Communications, Energy and Natural Resources’
(‘DCENR’) Renewable Energy Support Scheme, Technology Review Consultation is to refresh the
recommendations made in the Green Paper submission based on a greater understanding of the opportunities in the Irish market built up by ISEA members over the last 12 months, and to provide supporting data to support the principal policy recommendations.
The key points in this submission are as follows:
1) The projected deployment rate for solar is faster than originally estimated. ISEA now believes that
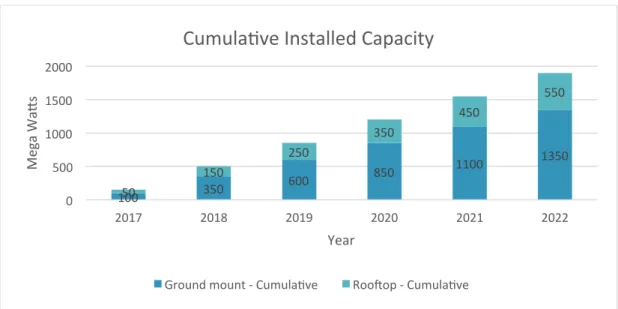
between 800 MW and 1,150 MW of installed capacity is realistic by 2020 and 1,900 MW by the end of 2022.
2) The average cost over 25 years to provide a support mechanism for the deployment of 1,900 MW of
solar by 2023 is estimated to be €24m per annum, or €0.023/kwh, representing 1% of a typical consumer’s electricity bill.
3) Installation costs for solar farms will fall by 21% between 2015 and 2018, assuming the lifting of the
Minimum Import Price on Chinese solar modules that was introduced by the European Commission in 2013.
4) Utility scale (>1 MW) ground-‐mounted solar farms deployed in 2017 will require revenue/kwh of
€0.14 -‐ €0.16, reflecting a level of support equivalent to €0.07-‐€0.09/kwh. Lower levels of support will be required for projects deployed in subsequent years as costs decline, with solar energy expected to be grid-‐competitive by 2023.
5) To ensure that the level of support provided to solar accurately reflects conditions in the market, and
to avoid the boom and bust scenarios experienced in other European countries such as Spain, Italy and the UK, a competitive auction for utility-‐scale solar is recommended from day one.
6) A Contracts for Difference based support mechanism is recommended with a dedicated budget
reserved for Solar until 2020. This will allow the solar industry to build the necessary scale to be able to compete in a technology-‐neutral auction from that date.
7) Roof-‐mounted schemes should be eligible for a generation tariff based support mechanism (ReFiT or
equivalent). The required generation tariff ranges from €0.095/kwh for large commercial rooftops to €0.15/kwh for domestic rooftop schemes for an installation in 2017, declining over time for installations in subsequent years.
Section 1 of this submission will focus on the different applications of solar and demonstrate that a mix of utility scale and rooftop is required in order to maximise the benefits of developing a solar industry. Section 2 will explore the benefits of solar beyond those related to achieving Ireland’s renewable energy targets. Section 3 will go into detail on the current and projected costs of deploying solar schemes to justify the recommended support levels, while Section 4 analyses the total projected cost of the support mechanism over 20 years. Finally section 5 goes into detail on the recommended support mechanism for utility scale and rooftop solar schemes.
Figure 1. Cumulative installed capacity 2017-‐2022
100 350 600 850 1100 1350 50 150 250 350 450 550 0 500 1000 1500 2000 2017 2018 2019 2020 2021 2022 Me ga W ag s Year
Cumulaive Installed Capacity
1.
Introduction
Solar energy is a rapidly developing technology that has minimal impact on the environment with maximum benefits. With the correct support it has the potential to become one of the most economically viable renewable energy source in the world.
To date, solar energy has been overlooked in Ireland with the focus on other renewable energy sources, particularly wind. However, as many other Northern European countries have recognised, solar is an important component of the renewable energy mix and provides a significant opportunity for Ireland to accelerate the rollout of renewable energy at an affordable cost, while creating new employment opportunities.
The Irish Solar Energy Association (ISEA) represents over 50 companies that constitute a dynamic and growing solar sector in this country. We recognise the potential for solar in Ireland, not only as a means for meeting Ireland’s renewable energy and electricity targets, but as a long-‐term sustainable and clean option with numerous benefits for Ireland economically, socially and environmentally.
We believe that, with the right policy framework, solar energy could account for between 10% and 20% of renewable energy generation capacity by 2020, representing 800MW – 1,150 MW of installed generation capacity. This will make a significant contribution to Ireland’s 2020 carbon reduction targets, create a minimum of 4,000 direct jobs and solidify Ireland’s position as a Centre of Excellence for Renewable Energy, which has recently been reinforced by the selection of Dublin as the location for the 2014 Renewable Energy Finance Forum.
The Department of Energy, Communication and Natural Resource’s (DCENR) technology review consultation on the Renewable Electricity Support Scheme (“the Consultation”) therefore represents an important opportunity to maximise renewable energy delivery through further diversification of renewable energy sources in Ireland.
The Irish Solar Energy Association (ISEA) argues in this paper that solar photovoltaic (PV) projects can and should be a part of that renewable energy mix. ISEA, through this submission, outlines 3 elements for the deployment of solar in Ireland:
• Utility-‐scale ground mounted solar.
• Commercial rooftop.
• Domestic rooftop (< 6kW) solar installations.
A mixture of different incentives is needed for each of the elements due to their scale, cost-‐base and ability as individual projects to interact with the wholesale market. Through this submission ISEA will present: the benefits of solar in Ireland, an evaluation of the costs of solar (providing a detailed review of capital expenditure), potential deployment scenarios, and a support scheme mechanism for solar in the form of an auction. Estimates will also be made on what a suitable potential is for the deployment of commercial rooftop, domestic and ground mounted solar in Ireland by 2023 to achieve appropriate economies of scale.
1.1 Utility-‐scale Solar Projects
Utility-‐scale solar projects are defined as those projects that are >1MW in capacity and are typically installed on greenfield or brownfield sites. Generated electricity is exported directly to the grid with revenue being received through a bilateral Purchase Power Agreement (PPA) that comprises a market component, based on the wholesale price of electricity and a subsidy component. The principal advantages of utility scale projects are that deployment costs are cheaper, due to economies of scale and there are ready sources of finance in the form of infrastructure funds and project debt. Experience in other European countries has shown that deployment of utility scale solar can be extremely rapid, with the UK deploying over 7,000 MW between 2010
and 2015. As such, utility-‐scale solar is a useful tool for governments that need to rapidly address a shortfall in achieving renewable energy targets.
While the deployment costs of solar continue to fall, the rate of decline has slowed since 2013 due to the introduction by the European Commission of the Minimum Import Price on imported solar modules and the impact of the weaker euro. Nevertheless, ISEA projects that installation costs will fall by 21% between 2015 and 2018, making solar projects viable at a tariff of between €0.14 and €0.16/kwh. This will decline over time to €0.14/kwh in 2018 and €0.13 in 2019. Grid parity is projected by 2023.
Assuming a deployment of 1,350MW of utility-‐scale solar between 2017 and 2022, the average annual cost to
the PSO customer over a 251 year subsidy timeframe is €24 million. Deployment at this level will contribute
significantly towards Ireland’s 2020 and 2030 targets, and will cost €0.023/kwh over the lifetime of the subsidy scheme. Support calculations for these figures are provided in the main body of our response.
Consistent with State Aid Guidelines, this document will recommend an auction process for utility-‐scale solar projects and address why a specific budget should be ring fenced for solar until 2020. This will be based on a two-‐way contract for difference mechanism.
1.2 Domestic Rooftop (< 10 kW) Solar Installations
Domestic Rooftop refers to solar PV on homes. The benefit of domestic rooftop solar is that it facilitates the Irish consumer to offset costly retail electricity with energy generated from the roof of their home. The move towards domestic solar will reduce the risk of electricity price volatility and enhance energy security for consumers. As the cost of solar PV at a domestic scale continues to fall, ultimately towards grid parity, the benefits to consumers will be proportionately greater.
It is proposed that a domestic generation tariff for rooftop should be introduced, in addition to the consumer receiving revenue from the estimated 50% of electricity that is exported to the grid. This will ensure greater deployment of solar PV at a domestic scale, which will provide homeowners with the opportunity to reduce their electricity bills and recoup the costs of installation.
Energy storage solutions are also an important factor, with large scale adoption expected by 2020 as costs fall. This will increase the amount of self-‐generated power consumed domestically, further improving the attractiveness of solar PV systems.
1.3 Commercial Rooftop Solar Projects
Commercial rooftop solar PV refers to rooftop PV installations on retail, industrial, agricultural buildings, state and semi-‐state organizations. Solar PV systems for commercial and industrial use have similar benefits to those of domestic systems – lower electricity bills, protection against future electricity price rises, and a smaller carbon footprint -‐ but with the added advantage of generating larger amounts of electricity and generally being able to better match on-‐site generation with on-‐site demand.
This decentralised application of solar PV technology is particularly promising for the Irish businesses as it generates renewable electricity during the day, at the time when the building owner is consuming it (when ‘brown’ electricity is often at its peak prices) and, unlike centralised generation, it avoids grid transmission and distribution costs by supplying directly into the distribution board of the business under the roof. It is often during daylight hours when these businesses have a demand for that electricity and rooftop solar PV
1 While each individual project is recommended to receive government support for 20 years, projects deployed between 2017 and 2022
encourages business owners and developers to size systems to their base load to minimise export to the grid and maximise savings from offsetting day time ‘brown’ electricity.
The Department of Energy and Climate Change (DECC) in the UK recognised the potential of this solar PV application, arguing that deployment in the commercial and industrial sector needed to be much stronger if it was to match what has been seen in others parts of Europe (DECC, 2014). DECC have also worked at removing barriers to adoption such as, increasing permitted development rights for rooftop installations up to 1MWp.
2. Benefits of Solar
The benefits of solar extend beyond the provision of clean energy and electricity. In the context of Ireland’s renewable energy mix, solar PV is a complementary source of energy to wind, and other renewable technologies. Thus it contributes to the creation of a diverse, resilient and secure electricity supply. This in turn creates additional benefits for Ireland such as: enabling Ireland to achieve its EU targets for climate and energy in 2020, and the EU 2030 Climate and Energy Framework, creating jobs, generating income for farmers, and supporting economic and social growth.
Further with constant innovations, stemming from decreasing costs of technology and increasing interest, the applications of solar are constantly expanding, ranging from solar panels in electric vehicles, to solar walls on buildings. Solar PV will only continue add value to economic, environmental and social policy objectives of the Irish Government.
2.1 Climate Change and Energy Security
Addressing the impacts of climate change is intertwined with energy security. It is well documented that fossil fuels contribute to greenhouse gas (GHG) emissions, leading to increased air pollution, rising temperatures and rising sea levels, key climate change impacts facing Ireland. Mitigating these impacts and reducing fossil fuel consumption while stimulating economic growth and creating energy security is an immediate and long-‐term policy challenge.
Energy security has been highlighted by the SEAI, ESRI and IEA as a critical energy policy issue. Ensuring that Ireland has a secure energy supply now and in the future is critical to the growth of the Irish economy. Currently Ireland is heavily dependent on fossil fuels, to meet energy demand. Critically Ireland supports 100%
of its oil demand through imports, while its natural gas demand import dependency is at 95.3%2. Local
production of natural gas is anticipated to be increased with the development of the Corrib project, which is, however, expected to peak within 6 years. As such, Ireland is heavily dependent on energy imports to meet its energy demands and, with the volatility of oil prices energy costs will rise thereby creating multiple threats to energy security and economic security.
Solar PV can be quickly deployed and has the potential to comprise between 10% and 20% of Ireland’s renewable energy generation by 2020. It can therefore, contribute to the security of supply by providing predictable and reliable indigenous electricity generation thereby, increasing the resilience of Ireland’s energy supply.
2.2 Job Creation
3
Beyond EU policies and targets, solar PV contributes additional benefits to Ireland’s economy and society. The International Renewable Energy Agency (IRENA) estimates that 11.3 direct jobs are created for every MW of solar capacity installed, 11 in construction and 0.3 in operations and management. Therefore, the rollout of 1,350MW of solar capacity will create approximately 4,500 direct jobs in Ireland supporting utility-‐scale solar alone. As we expect the rollout of solar to continue after grid parity is achieved in 2023, the construction jobs can be considered sustainable in the long term. Figure 3, presents the number of jobs that potentially could be created annually, based on ISEA’s projections for the solar market. The number of indirect jobs and induced
2 IEA (2014). Energy Supply Security 2014
3 The creation of employment and education opportunities is a significant benefit that is discussed in detail in
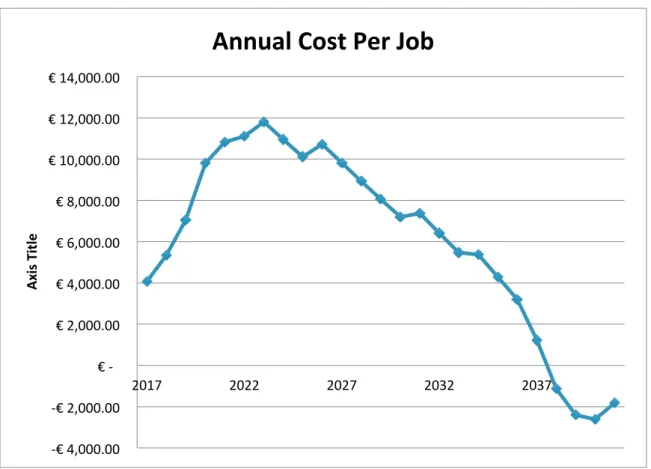
employment generated from the solar market is approximately 14,000 jobs4. Based on the projected costs of the proposed solar support outlined in section 4, table 11, the projected annual cost per job is €4,000 in 2017. This increases to €12,000 per job between 2017 and 2023 as more solar capacity is deployed, then begins to decrease as the overall cost of the support mechanism decreases, reaching zero in 2038
It should be noted that this analysis focuses purely on jobs created to directly service the domestic Irish market. It is likely that further jobs will be created as international solar companies, seeing the opportunities in the Irish market, choose to establish their European operations here. In particular, given the current wave of EU protectionism, it is believed that a number of Chinese solar module manufacturers are considering setting up a base in Ireland. Further jobs will be created indirectly, particularly in sectors that support solar such as financial services. Lastly, there will be induced employment stemming from the increased purchasing power of people involved in the sector and cost savings that trickle down to Irish citizens.
Figure 2. Annual cost per job created
4 Indirect jobs is calculated assuming a multiplier of 3.4
-‐€ 4,000.00 -‐€ 2,000.00 € -‐ € 2,000.00 € 4,000.00 € 6,000.00 € 8,000.00 € 10,000.00 € 12,000.00 € 14,000.00 2017 2022 2027 2032 2037 Ax is T itl e
Figure 3. Number of jobs created per year5
2.3 Agriculture and Biodiversity
As utility scale Solar PV farms require large land area, the most common source of land to be used is barren/degraded agricultural land in rural locations. The costs of using land for activity other than agricultural activities is often cited in the arguments against the installation of solar PV farms. However, research has demonstrated that there are benefits. During the lifetime or a solar PV farm, the land can be used simultaneously for a range of profitable activities such as sheep grazing, bee-‐keeping, and the production of high value crops such as pumpkins, asparagus and cut-‐flowers.
Solar farms also Solar PV projects provide an increased, diversified and stable source of income for landowners, encouraging the next generation to keep farming the land:
• Rental payments over 25 years (RPI indexed)
• Cheaper electricity
• Effective hedge against variability in annual farm income and energy price
Solar PV has the potential to benefit and enhance biodiversity, in the context of agricultural land regeneration (and in peat-‐land regeneration). Simple measures, and an appropriate ecological or biodiversity plan, can ensure that the biodiversity of a site is enhanced over the lifetime of the project.
Planned and constructed correctly, solar has a very light touch on the land with little or no concrete being used. Mounting systems are friction piled using a simple process that is 100% reversible. With correct system design around 95% of the land used remains under grass sward and is available for agricultural production or biodiversity management. This sward can be managed in a manner that permits differing heights, and benefits from microclimate conditions that enhances biodiversity.
Solar farms provide an opportunity for ground nesting birds, as within sites wildflowers meadow and grasslands can provide valuable nesting sites for species like the curlew and corncrake, two species who’s nesting habitats have been degraded due to land changes. These ground nesting birds are protected from predation within a solar farm as the site is likely to be fenced.
5 Direct jobs employment factor 11 for construction for 1 year, 0.3 for operations and management life time of project, indirect jobs multiplier of 3.4 (Rutovitz and Harris (2012).
“Calculating Global Energy Sector Jobs: 2012 Methodology”. Institute for Sustainable Futures.
1650 3850 3850 3850 3850 3850 3850 45 150 255 360 465 570 675 1695 4000 4105 4210 4315 4420 4525 0 1000 2000 3000 4000 5000 2017 2018 2019 2020 2021 2022 2023 Nu mb er of jo bs Year
Jobs in Solar PV
Lastly, studies of the benefits land regeneration have shown knock-‐on effects in the tourism and recreation sector due to the increased biodiversity. As such there is potential for rural economies to experience growth and new opportunities with the installation of solar PV farms.
2.4 Complement to Wind
A challenge with renewable energy technologies is the dependence on the source from which energy is derived. Generation of wind energy is dependent on the presence of wind, and solar is dependent on radiation from the sun. As stand-‐alone technologies, their reliability is not a guarantee. However, as a “basket of goods” renewable energy technologies complement each other and increase overall predictability. In the case of Ireland, with rapidly changing weather patterns, solar is highly complementary to wind.
As the output of a solar plant is seasonal, it can be predicted very accurately on a monthly basis. Additionally, by its nature, its output is predictable on an intraday basis, with peak output occurring during the middle of the day, when demand is relatively high. As the figures below show, wind output picks up at the end of the day, as solar output declines and electricity demand peaks. Given the complementarities, a balanced mix of solar and wind technologies, will facilitate a reduction in the amount of baseload generation required from fossil fuel sources.
Figure 4. Intraday Solar and Wind Generation
Intraday Solar Generation Intraday Wind Generation
Figure 5. Intraday Demand for Electricity
2.5 Economic and Social Benefits
The economic benefits of solar extend beyond job creation. There is a growing demand, especially by and for multinational companies (MNC), to engage in green practices. The use of clean energy is a key factor in this. MNCs, such as Google and Apple, have demonstrated that clean energy is a key corporate goal and therefore have shifted towards using renewables for their data centres. Critically, MNCs are also demanding that the cities in which they locate consistently provide high quality living environments.
There are social benefits associated with solar PV as well. For example, in the UK the Department of Energy and Climate Change (2014) note that some landlords that have installed solar PV on their housing stock already and have passed on the energy cost savings to the tenants. This has social benefits in helping to alleviate fuel poverty and spreads the benefits of solar PV across the social spectrum. Domestic rooftop solar PV empowers consumers to take control of and influence their energy security, which would be welcomed by
the wider public6.
For Ireland, solar PV can be applied in a similar manner, and enable the government to sustainably meet the energy and heating demands of vulnerable populations. Further, community ownership of solar PV projects not only provides energy but income; as well as a profitable means of incorporating and promoting the solar PV that not only benefits individuals, but communities and government, by reducing costs and equitably sharing the benefits. Moreover, the shift to solar PV for electricity generation is strengthened by the strong public acceptance of solar, which has been shown to have 80% of public support in the UK due to its minimal
negative impact.
6 DECC (2014) UK Solar PV Strategy Part 2: Delivering a Brighter Future
https://www.gov.uk/government/uploads/system/uploads/attachment_data/file/302049/uk_solar_PV_strate gy_part_2.pdf
3. Costs of Solar
3.1 Cost Summary for Utility-‐scale Solar Projects
ISEA is providing this information to show overall estimated costs for the inclusion of solar PV as a technology in the next renewable scheme in Ireland. The resulting Levelised Cost of Electricity (‘LCOE’) presented here is based on a set of assumptions, which may or may not represent the commercial realities on the ground when it comes to a competitive auction. We therefore suggest using this LCOE analysis, updating as needed, to provide for a cap in the allowable cleared price for any competitive auction. This is discussed further in the section discussing the proposed renewable scheme design.
Table 1 provides a summary of the total costs of developing and constructing a 5MW solar farm in 2015 and 2017 respectively. Engineering Procurement and Construction (EPC) costs are based on the construction costs for a similar project in the UK, while grid connection and development costs reflect the higher cost base in Ireland. A development margin of €100,000 per Megawatt, representing less than 10% of the total cost, has been included. This is a reasonable level for most developers given the higher risks involved with developing solar projects in Ireland and is significantly lower than the margins enjoyed by wind developers in recent years.
Table 1. Cost summary for a 5MW solar farm.
2015 2017
Cost/MW Total (5MW) Cost/MW Total (5MW)
EPC Costs € 1,084,759 € 5,423,797 € 916,000 € 4,580,000.00 Grid Connection Costs € 80,000 € 400,000 € 80,000 € 400,000.00 Development/Finance Costs € 91,600 € 458,000 € 91,600 € 458,000.00
TOTAL CONSTRUCTION COSTS € 1,256,359 € 6,281,797 € 1,087,600 € 5,438,000
Development Margin € 100,000 € 500,000 € 100,000 € 500,000.00
TOTAL PROJECT COSTS € 1,356,359 € 6,781,797 € 1,187,600 € 5,948,000
3.11 Utility-‐scale EPC Costs
Table 2 presents a detailed breakdown of the EPC costs in 2015 and includes projections through to 2018. Key points are as follows:
• Modules: The cost of modules is being kept artificially high by the Minimum Import Price and the Anti-‐dumping Duties that the European Commission has placed on solar PV products imported from China, an action that lacks the support from 18 of the 28 EU member states and the solar industry in Europe. As of September 2015, the Minimum Import Price is €0.56 per watt, approximately 20% above the global market price. Consequently, the majority of utility scale solar farms currently being constructed use non-‐Chinese modules, for which the costs have been driven up by a limited supply and the weakening euro. The Minimum Import Price is expected to extend into 2016, and therefore only a 5% drop in module prices is expected for that year. In 2017 and 2018, prices are anticipated to fall by 20% and 10% respectively as the Minimum Import Price and the Anti-‐dumping Duties are removed and the cost of modules in Europe returns to global norms, thus eliminating the
burden on European energy consumer.
• Balance of Systems Costs: Balance of Systems costs comprising other components, labour and project management costs are expected to fall by approximately 2.5% per annum. Improved design requiring less core materials and the arrivals of new entrants to the market will continue to drive the cost of
other solar specific components down, while increased competition and improved efficiency will reduce the cost of services. Certain costs such as Civil Works and security will track the overall
construction market and are expected to increase over time.
Table 2. Utility scale EPC cost projections. Cost per kilowatt peak (kwp) of installed capacity.
2015 2016 2017 2018 Assumptions
Modules € 0.56 € 0.53 € 0.43 € 0.38
-‐5% 2016; -‐20% 2017; -‐10% 2018
Balance of Systems € 0.42 € 0.41 € 0.40 € 0.39 -‐2.5% per annum EPC Margin € 0.11 € 0.10 € 0.09 € 0.08 5% reduction per annum
Total EPC (cost/wp) € 1.08 € 1.04 € 0.91 € 0.85
21% decrease over three years
3.12 Funding Costs
The valuation of Solar projects is based on a target Internal Rate of Return (IRR) for the end buyer. In the UK, earlier projects were valued based on a target IRR of 8.5% -‐ 9.5%. This has fallen, with the valuation basis being closer to 7.5% and projected to fall further. A reasonable basis, therefore, for the valuation for Irish solar farms in 2017 is 7%, although some more sophisticated developers may be able to secure a lower blended cost of funds in the range of 6% -‐ 6.5%.
3.13 Case Study: 5 MW Solar Farm in Kildare
Table 3 shows the breakdown of revenues and costs for a 5 Megawatt solar farm in Kildare, with solar
radiation levels at 1,050 kilowatt hours per kilowatt peak of installed capacity7. Kildare, rather than Wexford
or Cork, was chosen as the case study to provide a more representative view of the viability of solar projects over a larger portion of the country. Assuming revenue per kilowatt hour of €0.15, the solar farm will generate a gross revenue of €666,698 in the first year. This gross revenue is based on a ‘Performance Ratio’ of 83%, which is the percentage of electricity exported by the system after accounting for technical losses. The resulting annualised load factor for a solar PV panel is of the order of 11% of installed capacity.
Table 3. Net revenues for a 5MW solar Farm
3.14 Operating Costs
Operating costs are €148,690 and account for 21% of the gross revenues. This is a higher percentage than for an equivalent project in the UK due to the following factors:
• Rent: Rent varies across the country and is approximately €950 per acre in the areas with the highest solar resource. This is higher than the original estimates due to competition in the market for suitable
solar sites.
• Business rates: Business rates have increased significantly for wind in the last year to €21,000 per MW. This will be reduced once it has been taken into account that solar yields less revenue per MW than wind. Therefore the assumption for Ireland is €7,000 per MW, which is still significantly higher
than the UK
• Distribution and grid fees: This represents 1.5% of gross revenue and is a cost specific to Ireland. • Operations & Maintenance, Insurance, Other: These costs are assumed to be similar to the UK.
3.15 Valuation Model
Solar projects are valued using a Discounted Cashflow model which assumes that revenue will be generated over a 25 year period. The key variables that affect the valuation are the revenue/kwh and the discount rate used (internal rate of return, IRR). Table 4 shows how the valuation can vary based on different combinations of the revenue/kwh and the discount rate. Based on the example of the 5MW project described above, a revenue/kwh of €0.15 and a discount rate of 6.5% would give a valuation of €5,571,065.
YEAR 2017 2018 2019 2020 2021
Installed capacity (kwp) 5,000 5,000 5,000 5,000 5,000 radiation (source; SolarGis; optimised angle) 1,050 1,050 1,050 1,050 1,050
Performance Ratio 83.0% 82.7% 82.4% 82.1% 81.8% Unit price €/kwh 0.1500 0.152 0.155 0.157 0.159 Gross Revenue € 653,625 € 661,107 € 668,675 € 676,330 € 684,072 Distribution Upside € 13,073 € 13,222 € 13,374 € 13,527 € 13,681 Revenue Total Revenue € 666,698 € 674,330 € 682,049 € 689,857 € 697,754 Rent -‐€ 26,145 -‐€ 26,537 -‐€ 26,935 -‐€ 27,339 -‐€ 27,749 O&M -‐€ 60,000 -‐€ 60,900 -‐€ 61,814 -‐€ 62,741 -‐€ 63,682 Insurance -‐€ 16,250 -‐€ 16,494 -‐€ 16,741 -‐€ 16,992 -‐€ 17,247 Business Rates -‐€ 35,000 -‐€ 35,525 -‐€ 36,058 -‐€ 36,599 -‐€ 37,148 Distribution and Grid Fees -‐€ 10,250 -‐€ 10,404 -‐€ 10,560 -‐€ 10,718 -‐€ 10,879 Other -‐€ 7,800 -‐€ 7,917 -‐€ 8,036 -‐€ 8,156 -‐€ 8,279 Operating Expenses
Total OpEx -‐€ 155,445 -‐€ 157,777 -‐€ 160,143 -‐€ 162,545 -‐€ 164,984 NET PROFIT € 511,253 € 516,553 € 521,906 € 527,311 € 532,770
Table 4. Valuation of a 5MW utility scale solar project
Assuming the project was constructed in 2017 at a cost of €5,438,000, as outlined in table 1 above, this would result in a total developer’s profit of €133,000 representing a margin of 2.5%, while a tariff of €0.16/kwh, would generate a margin of €636,000. Extending this analysis, the developer’s margin/MW can be calculated based on the different valuation scenarios outlined above. These are summarised in table 5, assuming a construction date of 2017 and an EPC cost of €916,000/MW.
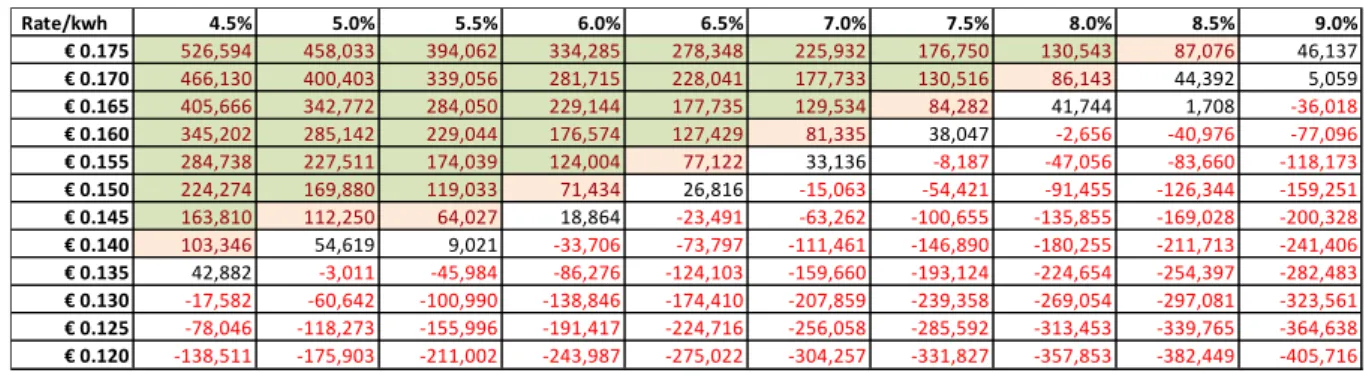
Given the level of risk involved with entering a new solar market such as Ireland, a target margin per MW of €100,000 is appropriate. With discount rates for solar projects at 7%, then the minimum viable price in 2017 is €0.16/kwh, with €0.155 marginal. Below this rate, only the larger developers, with access to lower cost of funds and greater economies of scale – scale which the Irish market might not be able to facilitate – would be able to participate in the market.
Table 5. Margin/MW for 5MW plant constructed in 2017. (EPC Cost: €916,000/MW)
3.16 Forecast of Competitively Outcome from Auction
The above analysis is based on a number of assumptions in relation to module costs and the lifting of the Minimum Import Price, discount rates and the USD/EUR exchange rate. These variables may change, resulting in a different outcome. To address these uncertainties, ISEA recommends an auction process is followed to determine the prevailing tariff for a particular year. Based on the table above, a tariff cap of €0.16 -‐ €0.17/kwh should be set for 2017 and adjusted for future years based on the outcome of the first auction. This will ensure that the rollout of utility-‐scale solar is successful, while ensuring that savings realised by the industry are passed onto consumers in the form of lower tariffs.
Based on the above, and the assumption that EPC costs continue to fall as per table 2, a tariff of €0.16/kwh would be sufficient for projects commissioned in 2017, decreasing by €0.01/kwh for projects commissioned in
Rate/kwh 4.5% 5.0% 5.5% 6.0% 6.5% 7.0% 7.5% 8.0% 8.5% 9.0% € 0.175 8,069,957 7,727,154 7,407,295 7,108,409 6,828,724 6,566,645 6,320,736 6,089,700 5,872,366 5,667,671 € 0.170 7,767,637 7,439,001 7,132,266 6,845,559 6,577,192 6,325,650 6,089,565 5,867,702 5,658,945 5,462,283 € 0.165 7,465,316 7,150,847 6,857,238 6,582,708 6,325,661 6,084,655 5,858,394 5,645,704 5,445,525 5,256,896 € 0.160 7,162,996 6,862,694 6,582,209 6,319,858 6,074,129 5,843,660 5,627,223 5,423,706 5,232,105 5,051,508 € 0.155 6,860,676 6,574,541 6,307,180 6,057,007 5,822,597 5,602,665 5,396,052 5,201,708 5,018,685 4,846,120 € 0.150 6,558,355 6,286,388 6,032,151 5,794,156 5,571,065 5,361,670 5,164,881 4,979,710 4,805,264 4,640,733 € 0.145 6,256,035 5,998,235 5,757,122 5,531,306 5,319,534 5,120,675 4,933,709 4,757,712 4,591,844 4,435,345 € 0.140 5,953,715 5,710,082 5,482,093 5,268,455 5,068,002 4,879,680 4,702,538 4,535,714 4,378,424 4,229,958 € 0.135 5,651,394 5,421,929 5,207,064 5,005,605 4,816,470 4,638,685 4,471,367 4,313,715 4,165,003 4,024,570 € 0.130 5,349,074 5,133,776 4,932,036 4,742,754 4,564,938 4,397,690 4,240,196 4,091,717 3,951,583 3,819,183 € 0.125 5,046,754 4,845,623 4,657,007 4,479,904 4,313,407 4,156,695 4,009,025 3,869,719 3,738,163 3,613,795 € 0.120 4,744,434 4,557,470 4,381,978 4,217,053 4,061,875 3,915,700 3,777,854 3,647,721 3,524,743 3,408,408 Target IRR Rate/kwh 4.5% 5.0% 5.5% 6.0% 6.5% 7.0% 7.5% 8.0% 8.5% 9.0% € 0.175 526,594 458,033 394,062 334,285 278,348 225,932 176,750 130,543 87,076 46,137 € 0.170 466,130 400,403 339,056 281,715 228,041 177,733 130,516 86,143 44,392 5,059 € 0.165 405,666 342,772 284,050 229,144 177,735 129,534 84,282 41,744 1,708 -‐36,018 € 0.160 345,202 285,142 229,044 176,574 127,429 81,335 38,047 -‐2,656 -‐40,976 -‐77,096 € 0.155 284,738 227,511 174,039 124,004 77,122 33,136 -‐8,187 -‐47,056 -‐83,660 -‐118,173 € 0.150 224,274 169,880 119,033 71,434 26,816 -‐15,063 -‐54,421 -‐91,455 -‐126,344 -‐159,251 € 0.145 163,810 112,250 64,027 18,864 -‐23,491 -‐63,262 -‐100,655 -‐135,855 -‐169,028 -‐200,328 € 0.140 103,346 54,619 9,021 -‐33,706 -‐73,797 -‐111,461 -‐146,890 -‐180,255 -‐211,713 -‐241,406 € 0.135 42,882 -‐3,011 -‐45,984 -‐86,276 -‐124,103 -‐159,660 -‐193,124 -‐224,654 -‐254,397 -‐282,483 € 0.130 -‐17,582 -‐60,642 -‐100,990 -‐138,846 -‐174,410 -‐207,859 -‐239,358 -‐269,054 -‐297,081 -‐323,561 € 0.125 -‐78,046 -‐118,273 -‐155,996 -‐191,417 -‐224,716 -‐256,058 -‐285,592 -‐313,453 -‐339,765 -‐364,638 € 0.120 -‐138,511 -‐175,903 -‐211,002 -‐243,987 -‐275,022 -‐304,257 -‐331,827 -‐357,853 -‐382,449 -‐405,716
each subsequent year. Lower tariffs of €0.14-‐€0.15 may be possible for projects located in the sunniers parts of Ireland. Following these assumptions, solar will achieve grid parity in Ireland by 2023 (see next section). These figures differ from the original projections put forth in ISEA’s submission to the Green Paper on Energy Policy in Ireland in August 2014. This is primarily due to the increased strength of the US dollar against the Euro, driving up component costs and the increase in the Minimum Import Price for solar modules made in China.
3.2 Cost summary for Domestic and Commercial Rooftop solar PV projects
Commercial rooftop solar projects are valued using a discounted cashflow model which assumes that revenue will be generated over a 20 year period. The gross revenue variables that affect the valuation are the generation tariff/kWh and Power Purchase Agreement (PPA) between the developer and the business consuming the electricity generated on their roof. The other key variable is the discount rate used (internal rate of return, IRR).
From researching the UK, German and US markets, the longest payback, or lowest return on investment, which would be viable for commercial rooftop solar is where projects are developed on behalf of an infrastructure fund at no upfront capital cost to building owners/occupiers. In return, occupiers receive savings through a discounted PPA. The income from the building occupier via the PPA combined with the generation tariffs proposed herein creates a 20 year gross revenue stream. Deducting the operational expenses from this gross revenue stream and applying the discounted cash flow methodology, combined with the addition of development and capital costs derives an internal rate of return.
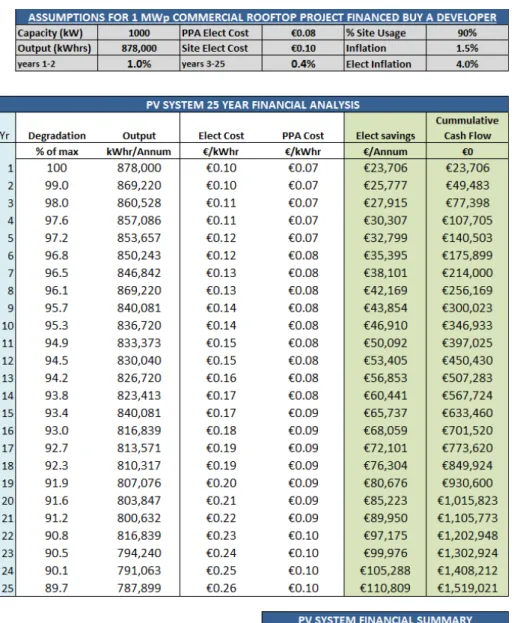
In the case of commercial rooftop solar projects, valuation is based on a target Internal Rate of Return (IRR) for the developer. While 7% is a reasonable basis for the valuation for utility scale solar in 2017, rooftop projects are be perceived as higher risk due to the reliance on the financial covenant strength of the building occupier as the PPA forms a substantial element of the revenue stream. It is suggested an IRR of 7.5% is more reflective of the associated expected returns for commercial rooftop in Ireland in 2017 (0.5% higher than what has been proposed for utility scale solar). Table 6 illustrates the minimum level of tariff required for varying sizes of system which is designed to give a 7.5% fixed rate of return to investors while providing a reasonable power price to businesses to adopt this renewable electricity source. Table 6 also includes the level of support for proposed for domestic rooftop PV which is provides a typical homeowner in Dublin a 7.5 year payback and where the consumers benefits from decentralised generation.
Table 6. Cost summary for rooftop solar
Based on the example of the 1MWp project, a generation tariff/kwh of €0.095/kWh and an IRR of 7.5% would give a valuation of €1,306,390/MWp which covers the EPC costs, development costs and developer margin. This example project will also derive €1.5m in electricity savings for the business or occupier under that commercial roof over the lifetime of the system. This figure is supported by the calculations and assumptions in Table 7 and it points towards the benefits of rooftop solar making Irish businesses more competitive by lowering their operational expenses through cheaper greener energy which is generated where it is being consumed.
3.21 Domestic Rooftop PV Cost Summary
Financial payback is a key determining factor associated with the decision to invest in PV. Market consensus strongly suggests that anything over a 7.5 year payback would not be considered for the discerning consumer. The financial model for a typical domestic home in Dublin with a 30 degree pitch roof facing 25 degrees from south is illustrated in Table 7. A generation tariff of 15c/kWh is required to make domestic rooftop solar PV viable. Table 8 shows the cost for domestic.
Table 7. Benefit to business of a developer funded commercial rooftop project
Tables 8. Costs for domestic
3.22 Commercial Rooftop Scale EPC Costs
Table 9 presents a detailed breakdown of the EPC costs in 2015 and includes projections through to 2018. Key points are as follows:
• Modules: The cost of modules is being kept artificially high by the Minimum Import Price and the anti-‐dumping duties that the