Spring 2019
Customer churn: A study of factors affecting customer churn
Customer churn: A study of factors affecting customer churn
using machine learning
using machine learning
KritiFollow this and additional works at: https://lib.dr.iastate.edu/creativecomponents Part of the Business Analytics Commons
Recommended Citation Recommended Citation
Kriti, "Customer churn: A study of factors affecting customer churn using machine learning" (2019). Creative Components. 207.
https://lib.dr.iastate.edu/creativecomponents/207
This Creative Component is brought to you for free and open access by the Iowa State University Capstones, Theses and Dissertations at Iowa State University Digital Repository. It has been accepted for inclusion in Creative Components by an authorized administrator of Iowa State University Digital Repository. For more information, please contact [email protected].
Churn using Machine Learning
by
Kriti
A creative component report submitted to the graduate faculty in partial fulfillment of the requirements for the degree of
Master of Science
Major: Information Systems
Program of Study Committee: Dr. Anthony Townsend, Major Professor
Dr. Sree Nilakanta
The student author, whose presentation was approved by the program of the study committee, is solely responsible for the content of this report. The Graduate College will ensure this report is
globally accessible and will not permit alterations after a degree is conferred.
Iowa State University Ames, Iowa
2019
TABLE OF CONTENTS
Page
LIST OF FIGURES ... iii
ACKNOWLEDGEMENT ... iv
ABSTRACT ... v
CHAPTER 1. INTRODUCTION ... 1
Research Goal………..2
CHAPTER 2. LITERATURE REVIEW ... 3
Challenged in Customer Churn………..3
Machine Learning Algorithms for Customer Churn………..5
CHAPTER 3. DATA DESCRIPTION ... 7
Data Collection………...7
Data Categorization and Preparation………..9
CHAPTER 5. DATA ANALYTICS... 18
Feature Extraction and Selection………..18
Model Building for Customer Churn………20
CHAPTER 6. VISUALIZATION ... 23
LIME Analysis………....26
CHAPTER 7. SUMMARY AND CONCLUSION ... 26
Summary of the Result……….26
Conclusion………26
Limitation and Future Studies………...26
REFERENCES ... 28
LIST OF FIGURES
Figure 1- Customer Churn Types………4
Figure 2 – Data Mining to gain insights………..6
Figure 3 - Customer Churn Ratio………...10
Figure 4 - Gender vs Customer Churn………...10
Figure 5 - Partner vs Customer Churn………...10
Figure 6 - Dependents vs Customer Churn………11
Figure 7 – Senior Citizen vs Customer Churn………...11
Figure 8 - Tenure vs Customer Churn………...11
Figure 9 – Phone Service vs Customer Churn………...12
Figure 10- Multiple Lines vs Customer Churn………..12
Figure 11- Internet Service vs Customer Churn………12
Figure 12- Online Security vs Customer Churn………12
Figure 13- Online Backup vs Customer Churn……….13
Figure 14- Device Protection vs Customer Churn………13
Figure 15- Tech Support vs Customer Churn………13
Figure 16- Streaming TV vs Customer Churn………...13
Figure 17- Streaming Movies vs Customer Churn ………...13
Figure 18- Contract vs Customer Churn………14
Figure 19- Paperless Billing vs Customer Churn………..14
Figure 20- Payment Method vs Customer Churn………..14
Figure 21- Monthly Charges vs Customer Churn………..14
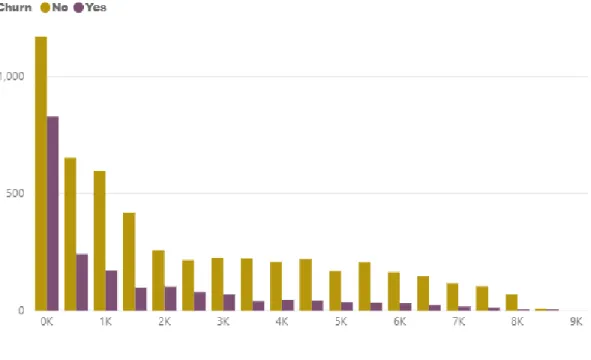
Figure 22- Total Charges vs Customer Churn………...15
Figure 23- Heatmap for the Variables………...16
Figure 24- FeatureTools to create new variables from existing ones………17
Figure 25- Extracting the top features from xGBoost Model………19
Figure 27- Getting the importance of top features from final xGBoostmodel………..20
Figure 28- xGBoost ROC Curve………21
Figure 29- Random Forest ROC Curve……….21
Figure 30- Decision tree ROC curve……….22
Figure 31- Visualization process………...23
Figure 32- LIME prediction for a moderate customer………..24
Figure 33- LIME prediction for a churning customer………...25
ACKNOWLEDGMENTS
Firstly, I would like to express my sincere gratitude to our Head of the Committee and Major Professor Dr. Anthony M. Townsend for the continuous support during my graduate study and related research, for his patience, motivation, and immense knowledge. His guidance helped me in all the time both on a professional and personal front
My sincere thanks to Dr. Sree Nilakanta for willing to be on the committee. His guidance and support throughout the course and this project have been helpful.
In addition, I would also like to thank my friends, colleagues, the department faculty and staff for making my time at Iowa State University a wonderful experience.
ABSTRACT
Customer churn is one of the principal issues in the Telecommunications Industry. Clients massively change their specialist co-ops within the limited ability to focus time. Client Churn implies lost entire or part of the administrations from the client by any association. In this paper, we will talk about the fundamental issue – What makes a client remain and what influences them to go? We have utilized the telecommunications market to break down the stirring issue and have taken Watson Analysis Dataset for our case study. The purposes behind churn, as observed from a market viewpoint are – in light of the fact that it's simple for the clients to switch supplier, it is hard to oversee or completely use the client information, the administrations given by the association are inadequate and the clients are not fulfilled. To comprehend the issue, we have utilized different tree-based classifiers in Python and did the examination of the top highlights which account in understanding the conduct of the clients. Lastly, we have depicted the constraints and future examination on it.
Keywords — churn prediction, data mining, decision trees, xGBoost, random forest, analysis
CHAPTER 1 - INTRODUCTION
Customer churn is an imperative issue that is frequently connected with the existing cycle of the business. At the point when the business is in a development period of its life cycle, deals are expanding exponentially and the number of new clients to a great extent dwarfs the number of churners. On the opposite side, organizations in a developed period of in their life cycle set their emphasis on decreasing the rate of customer churn.
The fundamental reasons for customer churn are divided into two groups: accidental and intentional. Accidental churn happens when the conditions are changing so keeps the clients from utilizing the services later on, for instance financial conditions that make benefits unreasonably costly for the client. Intentional churn happens when the clients change to another organization that gives comparable services, like better ideas from rivalry, further developed services and better cost for a similar service.
In recent years, churn prediction is becoming a very important issue in the telecommunications industry. In order to deal with this problem, the telecom operators must recognize these customers before they churn. Therefore, developing a unique classifier that will predict future churns is vital. This classifier must be able to recognize users who have a tendency to churn in the near future, so the operator will be able to react promptly with appropriate discounts and promotions. The most frequently used techniques for this purpose are learning algorithms for classification, like decision trees, logistics regression, k-nearest neighbors, Naïve Bayes, neural networks, etc. Moreover, researches should focus on identifying new features that are most effective in predicting customer churn. In this paper, we aimed to investigate the main reasons for churn among customers using Telco customer data. For this purpose, we gathered and processed the data, and based on these data, we implemented and compared four well-known
machine learning algorithms. Additionally, we identified the most important factors which are crucial for the customers to churn, that are tariff plan, subscriber contract, duration (length) of the contract, number of services, number of outgoing calls per month, and average call duration in the last month.
RESEARCH GOAL
The problem statement for this research is that ABC Inc. is now concerned about the number of customers leaving their landline business for cable competitors. The Data Science objective behind the problem statement is to build a machine learning model which predicts customer churn and also gives insights into the influencing factors and prescribe potential solutions to avoid churn.
CHAPTER 2 - LITERATURE REVIEW
Understanding the factors behind customer churn is very important in any business. Different market domains have some similar factors like the price offered to the customer, the benefits provided, the number of years for which customer is entangled with the organization, etc. Earlier papers have used Data analysis to understand customer behaviors using the regression models. Some research papers have used clustering to segment the groups of the customer of similar behaviors. One of those research papers is “A Review on Customer Churn Prediction in Telecommunication Using Data Mining Techniques (S. Babu1, Dr. N. R. Ananthanarayanan2)” where the authors have used the Data Mining techniques to predict customer churn. Research on such behaviors helps companies to take the necessary steps to retain customers. In this paper, we are going to address specifically the telecommunications industry and categorize the factors which contribute to it.
Challenges in Customer Churn
The objective of customer churn prediction is to predict the impending churners based on the predefined forecast horizon, assuming the data related with each subscriber in the network. According to Umayaparvathi & Iyakutti (2012), the customer churn prediction problem is normally characterized into three major stages, namely, training stage, test stage and prediction stage. In the training phase, the contribution for customer churn problem is from the historical data such as call details and personal and/or business customers’ data, which has been obtained and retained by the telecommunications service providers. Furthermore, in the training stage, the labels are structured in the list of churners’ records. In the test stage, the trained model with the highest accuracy is tested to predict the churners’ records from the actual dataset which does not
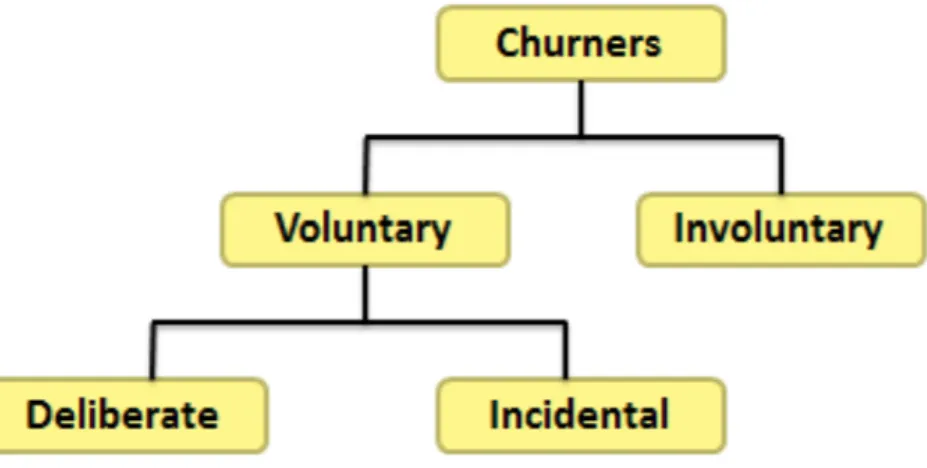
contain any churn label. Lastly, in the prediction stage, which is also known as the knowledge discovery process, the problem is classified as predictive modeling or predictive mining. Customer churn prediction helps the customer relationship management (CRM) to avoid customers who are expected to churn in future by proposing retention policies and offering better incentives or packages to attract the potential churners in order to retain them. Hence, the possible loss of the company’s revenue can be prevented. (Umayaparvathi & Iyakutti, 2012) Shaaban et al. (2012) stated that there are two types of churners, namely, involuntary and voluntary. Involuntary churners are the list of customers that are removed by the telecommunications service provider, itself, due to non-payment status, deception and non-usage of the phone. Meanwhile, voluntary churners are the customers that decide to terminate their service with the respective telecommunications service provider. Involuntary churners are easy to be recognized; however, the voluntary churners are more difficult to be identified. Generally, the customer churn problem in the telecommunications industry is voluntary.
Figure 1- Customer Churn Types
It can be seen in Figure 1 that voluntary churn is separated into two sub-categories which are deliberate churn and incidental churn. Deliberate churn results from factors such as economic
factors (example: price sensitivity), technology factors (example: more innovative technology is offered by another telecommunications service provider), poor customer service factors and others inconvenience related factors. Incidental churn is not caused by customers’ plan, but because of sudden changes occurred in the customers’ lives, such as changes in financial situation, geographical or relocation changes and others. (Shaaban et al., 2012)
Machine Learning Algorithms for Customer Churn
Many data mining algorithms have been reviewed and SVM, Bayes Network, decision tree, ANN, amongst others, were found to be the most popular algorithm in customer churn prediction. Some researchers also have combined a few algorithms and established an innovative algorithm in order to produce better accuracy rate. Additionally, the enhanced algorithm methodology such as AdaBoost was found to be very valuable, as it can enhance the accuracy performance of weak algorithms. However, the accuracy performance of each algorithm differs in every research. This is due to the different dataset used and the different input variables chosen for the experiment.
Most of the literature focused more on data mining algorithms, but only a few of them focus on distinguishing the important input variables for churn prediction to be used for data mining algorithms implementation. Additionally, only noticeably one literature that had actually combined social network based variables in the input variables for data mining algorithms implementation. Moreover, the class imbalance problem was found to be not addressed on some of the literature.
CHAPTER 3 - DATA DESCRIPTION
The telecommunications industry is concerned with the number of customers leaving their landline business for cable competitors. They need to understand who is leaving and what factors influence them. This project is focused on building a machine learning model which predicts customer churn and also gives insights into the influencing factors and prescribe potential solutions to avoid churn.
Firstly it is very important for us to understand the various attributes of a customer. We would need to understand the types of services and the price they are offered; various other customer relationships attributes such as (age, sex, dependents etc.)
The following paragraphs will talk in details about the steps taken at each stage of the research.
1. Data Collection
The case study in the project is a telecommunications company. We have collected the data from the IBM website - “Using Customer Behavior Data to Improve Customer Retention” (Apr,
2015). The link to the data can be found here -
https://www.ibm.com/communities/analytics/watson-analytics-blog/predictive-insights-in-the-telco-customer-churn-data-set/
The identified data sets are divided into the following segments - customer master, enrollments and billing tables. These tables have historical information but for this exercise we will be considering the latest values of all the attributes. A data extract from these tables is obtained to further cleanse, process and create a new feature from the existing attributes.
There are in total 7055 records with 20 features and the data set includes information about the following:
Customers who left within the last month – the column is called Churn
Services that each customer has signed up for – phone, multiple lines, internet, online security, online backup, device protection, tech support, and streaming TV and movies Customer account information – how long they’ve been a customer, contract, payment
method, paperless billing, monthly charges, and total charges
Demographic info about customers – gender, age range, and if they have partners and dependents
Following are the features present in the dataset:
• customerID - Customer ID
• gender - Whether the customer is a male or a female
• SeniorCitizen - Whether the customer is a senior citizen or not (1, 0)
• Partner - Whether the customer has a partner or not (Yes, No)
• Dependents - Whether the customer has dependents or not (Yes, No)
• Tenure - Number of months the customer has stayed with the company
• PhoneService - Whether the customer has a phone service or not (Yes, No)
• MultipleLines - Whether the customer has multiple lines or not (Yes, No, No phone service)
• InternetService - Customer’s internet service provider (DSL, Fiber optic, No)
• OnlineSecurity - Whether the customer has online security or not (Yes, No, No internet service)
• OnlineBackup - Whether the customer has an online backup or not (Yes, No, No internet service)
• DeviceProtection - Whether the customer has device protection or not (Yes, No, No internet service)
• TechSupport - Whether the customer has tech support or not (Yes, No, No internet service)
• StreamingTV - Whether the customer has streaming TV or not (Yes, No, No internet service)
• StreamingMovies - Whether the customer has streaming movies or not (Yes, No, No internet service)
• Contract - The contract term of the customer (Month-to-month, One year, Two years)
• PaperlessBilling - Whether the customer has paperless billing or not (Yes, No)
• PaymentMethod - The customer’s payment method (Electronic check, Mailed check, Bank transfer (automatic), Credit card (automatic))
• MonthlyCharges - The amount charged to the customer monthly
• TotalCharges - The total amount charged to the customer
• Churn - Whether the customer churned or not (Yes or No)
2. Data Preparation
Each table stores customer ID which will be our primary key to combine the data sets. Some tables such as billing dataset consist of transactional information which is then aggregated to a customer level. Finally we will have a data set wherein each row in the dataset represents a customer and their attributes.
After the base data set is created, we do some exploratory data analysis like looking at churn by gender, type of service, tenure etc. to understand the data better.
Figure 3 - Customer Churn Ratio
The following are the analysis of various attributes in the dataset. We have compared some major attributes in the dataset from different segments:
1. Customer Master Data
Figure 6 - Dependents vs Customer Churn Figure 7 – Senior Citizen vs Customer Churn
2. Customer Enrollment Data
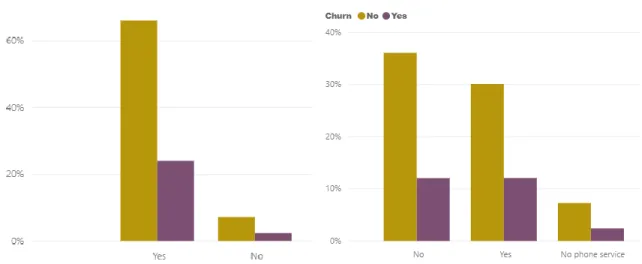
Figure 9 – Phone Service vs Customer Churn Figure 10- Multiple Lines vs Customer Churn
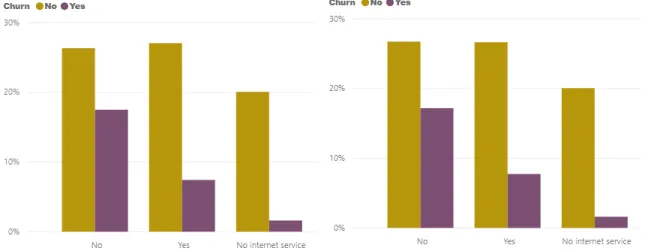
Figure 13- Online Backup vs Customer Churn Figure 14- Device Protection vs Customer Churn
Figure 15- Tech Support vs Customer Churn Figure 16- Streaming TV vs Customer Churn
Figure 17- Streaming Movies vs Customer Churn
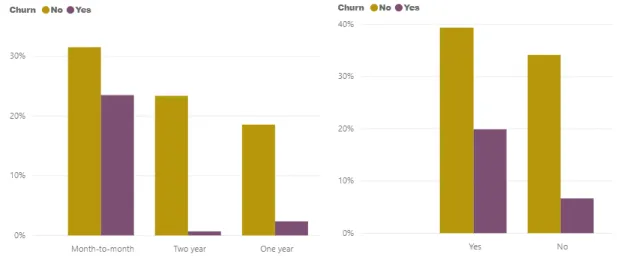
Figure 18- Contract vs Customer Churn Figure 19- Paperless Billing vs Customer Churn
Figure 20- Payment Method vs Customer Churn
Figure 23- Heatmap for the Variables
Since we do not understand the entire spectrum and operations of this company, creating new feature such as interaction variables will be difficult. At the same time we do not want to choose only a set of calculations to engineer features which might introduce bias to the learning process.
To overcome this challenge, we will use a python package – FeatureTools; this will help us in creating interaction variables and also perform deep feature synthesis which will result in creating a lot of features with all permutations and combinations.
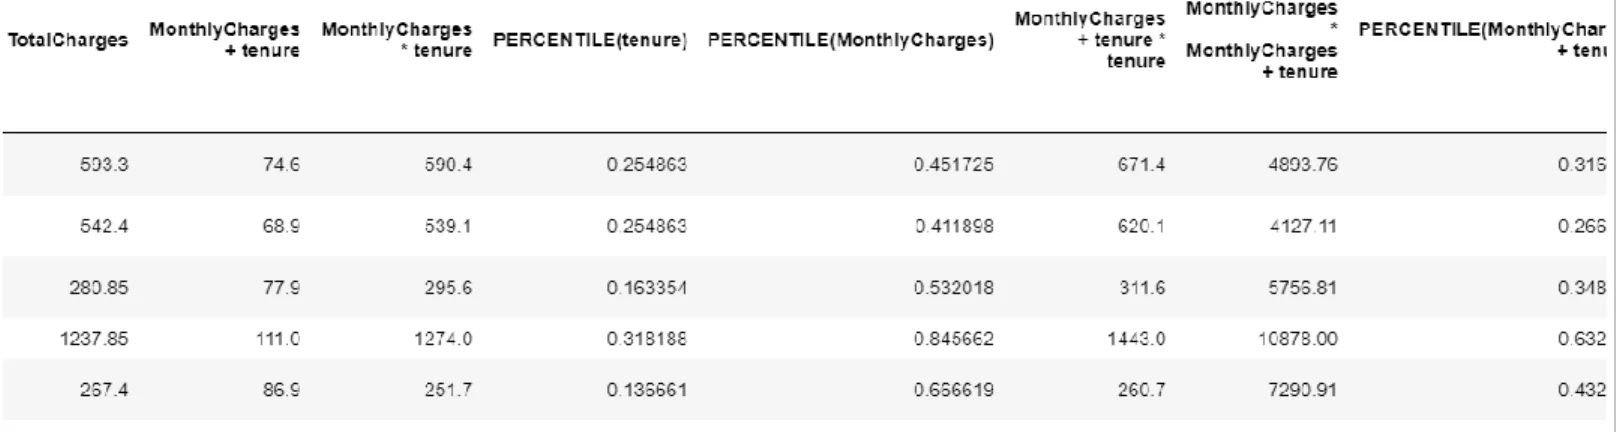
Using the FeatureTools library in Python, we were able to create 724 features out of the existing 19 features. This used a number of combinations and mathematical transformations to create the new features. Some of the transformations were based on the following : 'add_numeric_scalar', 'multiply_numeric', 'cum_mean', 'absolute', 'cum_max', 'divide_by_feature', 'add_numeric', etc. A sample of the newly created features is given below and the full feature collection is provided in Table 2.
CHAPTER 4 - DATA ANALYTICS
1. Feature Selections
Since we used feature tools to prepare new attributes which are a lot, we will have another problem which is what features to consider. Since this is a classification problem and has a lot of categorical inputs, tree-based classification models are a good fit.
We will start fitting a regular decision tree or random forest and extract the feature which splits a lot of data across estimators. Getting the top variables which explain most of the variations can help us in feature selection.
Another way we could possibly try is dimensionality reduction via methods like PCA. But unfortunately transforming PCA attributes are tough and since explaining influencing variables are an important part of our objective we will go with the first approach.
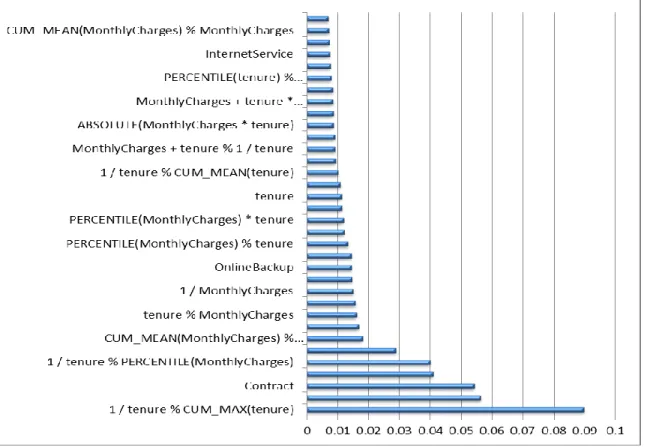
We tried various approaches to understand the feature selection like decision Tree, Random Forest, LightGBM and xGBoost. The best model to predict the top features to classify the customers was xGBoost. Hence, we used it to get the top features useful for classifying the customers.
We further explored the model using only the top features to understand the variation of the AUROC curve and found that the model was able to perform well with only the top features when given in the model.
Figure 25- Extracting the top features from xGBoost Model
After applying only the top important features to reduce the dimensionality, we got the following importance of variables:
Figure 27- Getting the importance of top features from final xGBoostmodel
This explains that the top features like Contract, TechSupport, Online Security and Tenure are very important attributes in classifying the customers as churning or not.
2. Model Building for Customer Churn
Once we have roughly the important features, we can then try various tree-based algorithms, and apply hyper-parameter techniques such as grid/ random search or even Bayesian optimization to get the best estimators.
The model can be evaluated on an AUROC curve and thresholds can be adjusted to the best estimator.
xGBoost:
Figure 28- xGBoost ROC Curve
Random forest:
Decision Tree:
Figure 30- Decision tree ROC curve
From the AUROC, we can see that the xGBoost gave the best results because we were able to classify the customers who are churning and not. We were also able to understand what are the top factors which are driving this churn, so that we can help the business people to drive the behavior which would reduce customer churn.
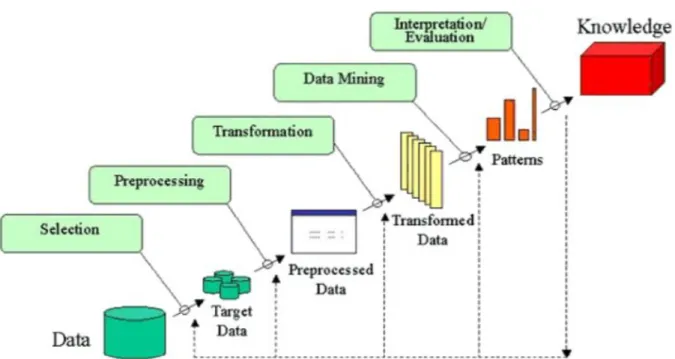
CHAPTER 5 - VISUALIZATION
Integrate all these results from the model and create a visualization to possibly show the causal factors and can be presented to the leadership. This can also help us understand prescriptive actions which should be integrated into our visualization and then the final version can be circulated to all the relationship managers to take actions.
Figure 31- Visualization process
1. LIME Analysis
LIME ( Local Interpretable Model-agnostic Explanations )is a novel explanation technique that explains the prediction of any classifier in an interpretable and faithful manner by learning an interpretable model locally around the prediction.
What has LIME had to offer on model interpretability? 1. A consistent model agnostic explainer [ LIME ].
2. A method to select a representative set with explanations [ SP-LIME ] to make sure model behaves consistently while replicating human logic. This representative set would provide an intuitive global understanding of the model.
LIME explains a prediction so that even the non-experts could compare and improve on an untrustworthy model through feature engineering. An ideal model explainer should contain the following desirable properties:
Interpretable - It should provide qualitative understanding between the input variables and the response. It should be easy to understand.
Local Fidelity - It might not be possible for an explanation to be completely faithful unless it is the complete description of the model itself. Having said that it should be at least locally faithful i.e it must replicate model’s behavior in the vicinity of the instance being predicted.
Model Agnostic - The explainer should be able to explain any model and should not make any assumptions about the model while providing explanations.
Global perspective - The explainer should explain a representative set to the user, so that the user has a global intuition of the model.
Figure 33- LIME prediction for a churning customer
Figure 34- LIME prediction for a non-churning customer
Model explainability is a priority in today’s data science community. As data scientists, we want to prevent model bias and help decision makers understand how to use our models in the right way.
In the above figures, we have added factors of three customers, one who is likely to churn, one who is likely to not churn and one who is a moderate customer because we cannot say a lot about them.
CHAPTER 8 - CONCLUSION AND FUTURE RESEARCH
CONCLUSION
The predictions from the ML model can help in understanding the customers who might leave and their service. With this information the company can do the following:
✓ Relationship Managers(RM) get a daily feed on who has the propensity to churn and what are the influencing factors
• This can help trigger a conversation with the customer and understand their pain points and possibly fix the situation even before the churn occurs
• This can create more customer entanglement as the RM would reach out to them anticipating issues will eventually increase their lifetime value
✓ Handling customer churn will help us reduce the number of dispute calls, this can help us in reduce the operational cost of call centers
FUTURE RESEARCH
o The model can be deployed to run on a regular basis to understand the changes in the behavior of the customers and the relationship managers can act accordingly
o Collect more data from customers going forward such as reviews, ratings etc. to understand more about why a certain group of customers might be leaving – Opportunity to apply Natural Language processing to free form textual reviews
o Access to the CRM information which has call logs, the reason for call etc.. and find out patterns of leading indicators for attrition.
o Capture the geographic information of the customer and correlate with some of the demographic attributes to find out patterns around customer churn and geography
o Adding in other telecommunications providers data might help us understand the market share
o Adding the total cost of the customer will help us understand profitability at a customer level. This can then be married to all the data sets mentioned above to understand an ideal profile of a customer and drive new customer acquisition strategies
o Gaining visibility to promotional information will help us understand the lift of sales for each type of promotion; combining these data sets with the above ones will also help tailor pricing and promotional strategies
By deploying data systems which can capture all these data sets we will be able to understand a complete profile of each customer and their activity and not only reduce customer churn but can also drive incremental revenue.
REFERENCES
Singh, J., and D. Sirdeshmukh. “Agency and Trust Mechanisms in Consumer Satisfaction and Loyalty Judgments.” Journal of the Academy of Marketing Science 28, no. 1 (January 1, 2000): 150–67.
https://doi.org/10.1177/0092070300281014.
Siguaw, Judy A, Sheryl E Kimes, and Jule B Gassenheimer. “B2B Sales Force Productivity: Applications of Revenue Management Strategies to Sales Management.” Industrial Marketing Management 32, no. 7 (October 2003): 539–51. https://doi.org/10.1016/S0019-8501(02)00278-X.
Beck, Norbert, and David Rygl. “Categorization of Multiple Channel Retailing in Multi-, Cross-, and Omni‐Channel Retailing for Retailers and Retailing.” Journal of Retailing and Consumer Services 27 (November 2015): 170–78. https://doi.org/10.1016/j.jretconser.2015.08.001.
Hosseini, Seyed Mohammad Seyed, Anahita Maleki, and Mohammad Reza Gholamian. “Cluster Analysis Using Data Mining Approach to Develop CRM Methodology to Assess the Customer Loyalty.” Expert Systems with Applications 37, no. 7 (July 2010): 5259–64.
https://doi.org/10.1016/j.eswa.2009.12.070.
McKechnie, Sally. “Consumer Buying Behaviour in Financial Services: An Overview.” International Journal of Bank Marketing 10, no. 5 (May 1992): 5–39.
https://doi.org/10.1108/02652329210016803.
Ahuja, Vandana, and Yajulu Medury. “Corporate Blogs as E-CRM Tools – Building Consumer Engagement through Content Management.” Journal of Database Marketing & Customer Strategy Management 17, no. 2 (June 1, 2010): 91–105. https://doi.org/10.1057/dbm.2010.8. Sashi, C.M. “Customer Engagement, Buyer‐seller Relationships, and Social Media.” Management
Decision 50, no. 2 (March 2, 2012): 253–72. https://doi.org/10.1108/00251741211203551. Dick, A. S., and K. Basu. “Customer Loyalty: Toward an Integrated Conceptual Framework.” Journal
of the Academy of Marketing Science 22, no. 2 (March 1, 1994): 99–113.
https://doi.org/10.1177/0092070394222001.
Yi, Youjae, Rajan Nataraajan, and Taeshik Gong. “Customer Participation and Citizenship Behavioral Influences on Employee Performance, Satisfaction, Commitment, and Turnover Intention.”
Journal of Business Research 64, no. 1 (January 2011): 87–95.
https://doi.org/10.1016/j.jbusres.2009.12.007.
Kim, Su-Yeon, Tae-Soo Jung, Eui-Ho Suh, and Hyun-Seok Hwang. “Customer Segmentation and Strategy Development Based on Customer Lifetime Value: A Case Study.” Expert Systems with Applications 31, no. 1 (July 2006): 101–7. https://doi.org/10.1016/j.eswa.2005.09.004.
Kandampully, Jay, and Hsin‐Hui Hu. “Do Hoteliers Need to Manage Image to Retain Loyal Customers?” International Journal of Contemporary Hospitality Management 19, no. 6 (August 28, 2007): 435–43. https://doi.org/10.1108/09596110710775101.
McEachern, Morven G., Monika J.A. Schröder, Joyce Willock, Jeryl Whitelock, and Roger Mason. “Exploring Ethical Brand Extensions and Consumer Buying Behaviour: The RSPCA and the ‘Freedom Food’ Brand.” Journal of Product & Brand Management 16, no. 3 (June 5, 2007): 168–77. https://doi.org/10.1108/10610420710751546.
Verhoef, Peter C., P.K. Kannan, and J. Jeffrey Inman. “From Multi-Channel Retailing to Omni-Channel Retailing.” Journal of Retailing 91, no. 2 (June 2015): 174–81.
https://doi.org/10.1016/j.jretai.2015.02.005.
Chang, Hui-Chu, and Hsiao-Ping Tsai. “Group RFM Analysis as a Novel Framework to Discover Better Customer Consumption Behavior.” Expert Systems with Applications 38, no. 12
(November 2011): 14499–513. https://doi.org/10.1016/j.eswa.2011.05.034.
Bolton, Ruth N., P. K. Kannan, and Matthew D. Bramlett. “Implications of Loyalty Program Membership and Service Experiences for Customer Retention and Value.” Journal of the Academy of Marketing Science 28, no. 1 (January 1, 2000): 95–108.
https://doi.org/10.1177/0092070300281009.
Noone, Breffni M, Sheryl E Kimes, and Leo M Renaghan. “Integrating Customer Relationship Management and Revenue Management: A Hotel Perspective.” Journal of Revenue and Pricing Management 2, no. 1 (April 2003): 7–21. https://doi.org/10.1057/palgrave.rpm.5170045.
Miles, Morgan, and covin. “Miles, M., & Covin, J. (2000). ‘Environmental Marketing: A Source of Reputational, Competitive, and Financial Advantage,’ Journal of Business Ethics, 23(3): 299-311.” Journal of Business Ethics 23 (February 1, 2000): 299–311.
https://doi.org/10.1023/A:1006214509281.
Jaakkola, Elina. “Purchase Decision-Making within Professional Consumer Services: Organizational or Consumer Buying Behaviour?” Marketing Theory 7, no. 1 (March 2007): 93–108.
https://doi.org/10.1177/1470593107073847.
Devabhaktuni, Vijay, Mansoor Alam, Soma Shekara Sreenadh Reddy Depuru, Robert C. Green, Douglas Nims, and Craig Near. “Solar Energy: Trends and Enabling Technologies.” Renewable and Sustainable Energy Reviews 19 (March 2013): 555–64.
https://doi.org/10.1016/j.rser.2012.11.024.
Hennig‐Thurau, Thorsten, and Alexander Klee. “The Impact of Customer Satisfaction and Relationship Quality on Customer Retention: A Critical Reassessment and Model Development.” Psychology & Marketing 14, no. 8 (December 1, 1997): 737–64.
https://doi.org/10.1002/(SICI)1520-6793(199712)14:8<737::AID-MAR2>3.0.CO;2-F.
Razzouk, Nabil, Victoria Seitz, and David Michael Wells. “The Importance of Brand Equity on Purchasing Consumer Durables: An Analysis of Home Air‐conditioning Systems.” Journal of
Consumer Marketing 27, no. 3 (May 4, 2010): 236–42.
https://doi.org/10.1108/07363761011038301.
Taylor, Steven A., Kevin Celuch, and Stephen Goodwin. “The Importance of Brand Equity to Customer Loyalty.” Journal of Product & Brand Management 13, no. 4 (June 2004): 217–27.
https://doi.org/10.1108/10610420410546934.
Prabhu, Jaideep, and Chatura Ranaweera. “The Influence of Satisfaction, Trust and Switching Barriers on Customer Retention in a Continuous Purchasing Setting.” International Journal of Service Industry Management 14, no. 4 (October 1, 2003): 374–95.
https://doi.org/10.1108/09564230310489231.
Payne, Adrian, and Pennie Frow. “The Role of Multichannel Integration in Customer Relationship Management.” Industrial Marketing Management 33, no. 6 (August 2004): 527–38.
APPENDIX