Pressing the
Right Buttons
Calculator Use in Schools and in
Junior Cycle Mathematics
Summary Report on Phase II of the Study of the Effects of Calculator Use
on Mathematics in Schools and in the Certificate Examinations
Paul Surgenor, Elizabeth Oldham, Seán Close, Gerry Shiel,
Thérèse Dooley and Michael O’Leary
Pressing the
Right Buttons
Calculator Use in Schools and in
Junior Cycle Mathematics
Summary Report on Phase II of the Study of the Effects of Calculator
Use on Mathematics in Schools and in the Certificate Examinations
Paul Surgenor, Elizabeth Oldham, Seán Close, Gerry Shiel,
Thérèse Dooley and Michael O’Leary
Education Department, St Patrick’s College, Dublin School of Education, Trinity College, Dublin Educational Research Centre, St Patrick’s College, Dublin
Copyright © 2007, St. Patrick’s College Cataloguing-in-Publication Data
Surgenor, Paul
Pressing the right buttons: calculator use in schools and Junior Cycle mathematics / Paul Surgenor…[et al.].
vi, 48 p., tables, 30 cm.
Includes bibliographical references
1. Junior Certificate Mathematics Examination–Ireland. 2. Mathematics–Study and teaching (Secondary)–Ireland. 3. Mathematical ability–Testing. 4. Pocket calculators. I Title 2007 510.712 dc/22 Designed by TOTAL PD
Published by St. Patrick’s College
Electronic version available at http://www.erc.ie
Contents
Preface
v
1
What is the background to the study?
1
2
What does the research literature say about calculators in
mathematics?
6
3
How were the calculator tests and questionnaires developed? 9
4
How was the study implemented?
12
5
How did students perform on the calculator tests?
15
6
What were students’ attitudes to calculators?
22
7
What were teachers’ attitudes to calculators?
25
8
How did students’ performance on the calculator tests and
the Junior Certificate mathematics examination compare?
29
9
What can we learn from the study?
34
References 37
Appendices
39
Appendix A: Sample parallel items for each calculator test 39
Appendix B: Glossary
44
Preface
The study of the effects of calculator use in schools and in the Certificate Examinations arose in the context of the introduction of calculators in the revised Junior Certificate mathematics syllabus (implemented in September 2000, with first examination in June 2003), and the decision to allow the use of calculators in the Junior Certificate
mathematics examination from June 2003 onwards.
The effects of calculator usage on mathematics achievement were studied in two phases – before and after the formal introduction of calculators into the Junior Cycle mathematics syllabus (DES/NCCA, 2000). Phase I (Close, Oldham, Shiel, Dooley, Hackett, & O’Leary, 2004) involved administering three calculator tests to a nationally-representative sample of Third-year students who had studied the pre-2000 Junior Certificate mathematics syllabus, and who did not have access to a calculator when attempting the Junior Certificate mathematics examination in June 2002. Phase II (Close, Oldham, Surgenor, Shiel, Dooley, & O’Leary, 2007) involved administering the same tests to a similar sample of students who had worked under the revised Junior Certificate mathematics syllabus and related teacher guidelines (DES/NCCA, 2002), and who had access to a calculator when sitting the Junior Certificate mathematics examination in June 2005. This is the summary report of the Phase II study.
Principal Objectives of the Phase II Study
In Phase II of the study, the principal objectives included:
• comparing the performances of the 2001 and 2004 Third-year cohorts on three tests of mathematics achievement
• examining the effects of calculator access versus non-access during the 2004 testing on student performance
• examining attitudes to, and extent of, calculator usage by students and their teachers in Third-year mathematics classes in 2004
• obtaining information on school policies on calculator use
• examining relationships between the performance of the 2004 students on the calculator tests administered in late 2004 and their performance on the 2005 Junior Certificate mathematics examination.
Acknowledgements
The research team wishes to thank the many teachers and students who participated in the different elements of the 2004 study.
Thanks are also due to Thomas Kellaghan, Director of the Educational Research Centre; the Department of Education and Science officials who liaised between the research team and the Department Research and Development Committee; the School of Education, Trinity College; the Department of Education, St Patrick’s College; staff members at the Educational Research Centre (including David Millar for providing advice on sampling, John Coyle for providing data management support, and Mary Rohan and Hilary Walshe for providing administrative support); and students from St. Patrick’s College who assisted with the scoring of tests and questionnaires.
What is the background to
the study?
In this section, an overview is given of the policy and practice with regard to calculator use in Irish mathematics education over the past four decades. The origin and structure of the Calculators in Mathematics Study are then described, and key results from Phase I of the study are presented. Issues relevant to Phase II of the study are identified.
Calculators in Irish Mathematics Education: the Historical Context
The current mathematics curricula in Irish primary and second level schools have evolved from the significantly changed courses that were initiated around forty years ago: in the mid-1960s (the period noted for ‘modern mathematics’) for second level curricula, and in 1971 for primary level when the ‘new’ curriculum was introduced. For neither development was the use of calculators an issue. Much the same can be said for the revisions of the modern second-level courses implemented in the mid-seventies.
However, at this time the debate about calculator use in mathematics education was well established elsewhere. By the end of the decade it had developed in Ireland, at least with respect to second level schooling. In 1980, the Irish Mathematics Teachers’ Association declared itself in favour of unrestricted calculator use in the state examinations – a position it has held ever since.
During the 1980s, arguments for calculator use typically emphasised their power in obviating tedious computation when this was not the main focus of attention (for example, when dealing with percentages, area or volume) and in preparing students for life beyond school. Arguments against more often addressed financial, social or practical issues: for example, who would provide the machines used in state examinations (the Department or the students) and what would happen if a calculator malfunctioned in the examination. Such pragmatic issues dominated the debate. The use of calculators as
learning toolsrather than as computational devices was not generally addressed. A further revision of the Intermediate Certificate courses began in 1982. When the revised courses were introduced in 1987, four-figure tables still featured, and no reference was made to calculators; moreover, the ban on calculator use in the Intermediate Certificate mathematics examination remained in force. In 1989 these courses were re-designated as Junior Certificate courses without any change in the syllabus or examinations.
1
Introduction of Calculators to Irish Mathematics Education
The first official appearance of calculators in Irish mathematics education occurred when non-programmable electronic calculators were permitted in the Leaving Certificate examination from 1986. The transition took place without any change in syllabus content or in the style of the examination questions. Thus, numbers were still chosen to facilitate paper-and-pencil computations, so that the advantage to students who chose to use calculators was minimised. In practice, however, use of a scientific calculator became the norm.
Explicit introduction of the calculator into the Leaving Certificate mathematics syllabus came in 1990 with the inception of the Ordinary Alternative syllabus. Parts of the course were built around calculator use, and the examination contained an optional question that tested computational skills with a calculator. The revised Higher and Ordinary level syllabuses introduced in 1992 refer to calculator use, but the corresponding
examinations were still designed in such a way as to facilitate paper-and-pencil computation. By 1995, however, when the Ordinary Alternative course was re-designated (with only minor changes) as a Foundation Level course, it had become obvious that the practical difficulties with regard to calculator use in examinations were minimal, and that the ‘calculator option’ question was much more popular than its traditional alternative. The latter was dropped. Thus, finally, a calculator was effectively ‘required’ – in the same way that pen or pencil, ruler and geometrical instruments were ‘required’, rather than just permitted – in a state examination in mathematics.
In the 1990s, a major revision of the Primary Curriculum was undertaken, and the revised curriculum was phased in from 2000. Its mathematics element incorporated calculator use from Fourth Class upwards; typical objectives state that the children should be able to perform [various operations and computations] ‘without and with a calculator’. Students arriving in second-level schools after the revised curriculum was implemented would therefore be expected to be accustomed to, and competent at, calculator use.
The position for the Junior Certificate was thus becoming anomalous. In any case, reviews of the courses by the National Council for Curriculum and Assessment (NCCA) Mathematics Course Committee in the early 1990s had identified the absence of
calculators from the syllabus and examinations as one of the chief negative aspects. Moreover, not only had practical objections to calculator use weakened, but a practical argument in favour had arisen: it was becoming increasingly hard to monitor illicit use of a tiny calculator, for example incorporated in a wrist-watch, during the examinations. This tended to counterbalance a genuinely educational argument that the Junior Certificate mathematics examination should test basic numeracy, and that at least one section of the examination should be done without calculators.
With the body of research broadly in favour of calculator use well established (see main report), the decision was taken to introduce calculators into the curriculum ‘for
What is the background to the study?
2000 for first examination in 2003. The types of calculators sanctioned for use in the state examinations are four-function and scientific (non-programmable) machines, though there is no embargo on the use of graphics calculators as teaching and learning tools.
The Effect of Calculator Use on Mathematics Study
The introduction of calculators into the mathematics curriculum provided opportunities for developments in teaching and learning, and for improvements in mathematics performance. However, it also raised concerns about the maintenance of computational skills for which calculator use is not appropriate.
In addressing these concerns, the Calculator Study took place in two phases. Phase I examined the final cohort studying the pre-2000 Junior Certificate mathematics syllabus (and undertaking the Junior Certificate mathematics examination without access to calculators), and Phase II examined the third cohort of students taking the revised Junior Certificate syllabus (hence familiar with, and permitted to use, calculators in the
examination). Each phase involved the administration of mathematics tests and questionnaires to nationally-representative samples of Third year students.
Three tests were developed to test different aspects of students’ mathematical skills in the presence or absence of a calculator. These were: a Calculator Inappropriatetest (taken without access to a calculator by all students in the sample, and containing items that students should be able to do without a calculator); a Calculator Optionaltest (taken by half the sample with access to a calculator and by the other half without such access, and containing items that students should be able to do with or without a calculator); and a
Calculator Appropriatetest (taken by all students with access to a calculator, and
containing items that would normally require a calculator). Questionnaires for students and teachers were also developed.
The test results from Phase I of the study provided base-line data on the performance of students who had followed the pre-2000 Junior Certificate mathematics syllabus. Results from the Calculator Optional test revealed that students with calculator access scored significantly higher than students without such access. Attitudes of teachers and students to calculator use were generally positive. While many teachers did not allow calculator use in their classes at the time, most were in favour of calculator use in the examinations. As well as providing baseline data, the findings from Phase I shaped the research
Comparing Phase I and Phase II Studies
In comparing results from Phase I and Phase II of the study, several factors must be taken into account.
First to be considered are changes directly related to the revised syllabus and its
implementation. Revisions were not restricted to calculator usage. The tests in the study focused on areas for which the introduction of the calculator appeared to constitute the only significant change; however, other alterations may have affected teachers’ approach to the syllabus or students’ learning, and hence student performance in general.
Moreover, a perception that the Higher course in particular had been ‘shortened’ seems to have led to some reduction in the time allocated to Junior Cycle mathematics in some schools.
A second factor relates to the time elapsing between the two phases of the study. Phase II examined students from the third cohort following the revised syllabus, and hence testing for Phase II was carried out three years after that for Phase I. This had the intended outcome of allowing teachers to become familiar with the revised syllabus, and teachers and students to do likewise with regard to the style of the Junior Certificate examinations. It therefore provided a truer reflection of the implemented syllabus than would have been the case if the first cohort had been examined. An inevitable
consequence of the passage of time, however, is that any underlying demographic, cultural, or other trends affecting student performance may have had a stronger effect on the 2004 cohort than on those preceding it.
An additional point of interest with regard to the lapse in time is that the proportion of the candidates for the Junior Certificate mathematics examination who opt for the Higher course has grown. For the two examination cohorts sampled for the study, the proportions were 39% in 2002 and 42% in 2005 (Figure 1.1). This is part of a welcome trend but raises some difficulties, especially for level-specific comparisons between the cohorts.
A third factor is that when the revised syllabus was designed, scientific calculators in general did not have ‘fraction keys’. Such keys have become increasingly usual during the intervening period, but the full extent of teachers’ and students’ familiarity with, and willingness to use, them is not known. The issue highlights the importance of estimation skills in the presence of technology. It also illustrates the fact that any study involving technology is likely to have to cope with rapid changes in the power of that technology.
Figure 1.1: Percentages of Students Taking Each Junior Certificate Examination Level for Mathematics, by Year1
*2001 cohort (Phase I) took the Junior Certificate Examination in 2002 **2004 cohort (Phase II) took the Junior Certificate Examination in 2005
What is the background to the study?
1 (Source – State Examination Commission; http://www.examinations.ie)
60 50 40 30 20 10 0 2001 2002* 2003 2004 2005** Foundation Ordinary Higher
What does the research
literature say about
calculators in
mathematics?
The literature review in the report of Phase I of the project established that students’ basic skills were not adversely affected by calculator usage during mathematics lessons, and that, in some cases, instruction in effective calculator usage resulted in gains in achievement in computation and problem solving. The literature emphasised that an increased focus on mental arithmetic and estimation in classes is necessary where calculators are routinely available during mathematics instruction. This chapter of the report updates the Phase I review.
Calculator Usage
Calculators are now widely available in the homes of primary and second-level students in Ireland (Shiel, Surgenor, Close & Millar, 2006; Close et al., 2004). The frequency of the usage of the scientific calculator among secondary students has increased, owing to the fact that it is now part of the Junior Certificate mathematics syllabus and
examination. On the other hand, the uptake of calculators in primary-level mathematics classes in Ireland, although showing improvement since 1999, is disappointing. In the 2004 National Assessment of Mathematics Achievement (NAMA 2004) (Shiel et al., 2006) it was found that one-third of pupils in Fourth class ‘hardly ever’ or ‘never’ used them. It is possible that the inclusion of calculator appropriate items in primary mathematics tests will promote the integration of the calculator in senior primary mathematics lessons.
The purposes for which the calculator is used in mathematics instruction also warrant attention. It had been hoped that calculator usage in mathematics classes would promote growth in problem-solving and investigative work and a decreased emphasis on paper and pen calculations. In NAMA 2004, it emerged that in Fourth classes where there is frequent access by pupils to the calculator (daily or weekly), it is most often used for checking answers and routine computations. In the TIMSS (2003) international assessment (Mullis, Martin, Gonzalez & Chrostowski, 2004), it was reported that the calculator is used most often by Eighth grade students for the solution of complex problems, routine computations and checking of answers and least often for the
exploration of number concepts. The failure to exploit the device to its full potential may
reinforce negative attitudes towards it on the part of teachers. This could account for a noticeable decline across countries in ‘frequent’ calculator usage among Eighth grade students as reported in TIMSS 1999 (Mullis, Martin, Gonzalez, Gregory, Garden, O’Connor, Chrostowski, & Smith, 2000). Professional development courses have been found to have a positive effect on teachers’ beliefs about the potential of the calculator as a tool for exploration of mathematics (Schmidt, 1999). This suggests such courses should be made available to both primary and secondary teachers.
Calculators and Achievement
The most frequently cited report regarding the effect of the non-graphing calculators on mathematical achievement is that of Hembree and Dessart (1986, 1992). They
conducted meta-analyses of 79 studies over a 15 year period. One finding of their study was that, on tests of problem-solving where access to calculator was permitted, there were positive effects for students of all ability levels. The results of Phase I of this project support the finding that calculator availability during assessment is a key factor in producing better results. However, access to a calculator during assessment can impede performance if students are not familiar with its use (Hopkins, 1992) or if they have not had prior experience in using it in mathematics tests (Bridgeman, Harvey & Brasswell, 1995).
The beneficial effects of the calculator are not confined to its availability in tests of mathematical achievement. In the final report of Phase I of the current project, reference was made to several studies that showed the advantages conferred by the calculator to students who were exposed to it during mathematics instruction (e.g., ARK (Hedrén, 1985), CAN (Shuard, 1992) and CPM (Groves & Stacey, 1998)). In these studies, project children demonstrated a better ability to solve word problems and a superior
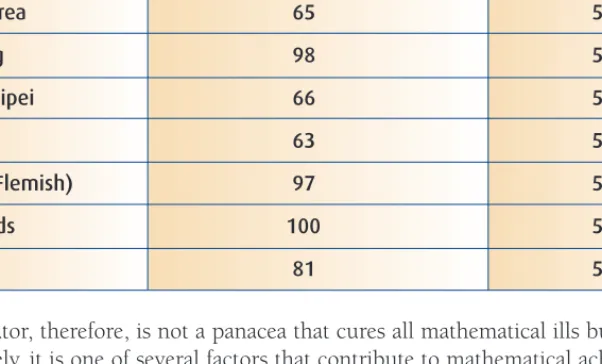
understanding of topics such as place-value in large numbers and decimal numbers. They also performed as well or better on tests of basic skills than those who did not have exposure to the calculator. Research on the use of graphics calculators in secondary-level mathematics shows that these tools are likely to improve understanding of function and graph concepts, problem-solving skills, and readiness for the study of calculus. However, access to a calculator is just one factor among several associated with mathematical performance. This was illustrated in TIMSS 2003 where the frequency of calculator usage differs across the eight top scoring countries as shown in Table 2.1. The average scale score of Hong Kong and that of Chinese Taipei, for example, differ by a mere one point, yet the countries have dissimilar patterns of calculator usage.
Table 2.1: Calculator Usage in High-Scoring Countries in TIMSS (2003)
The calculator, therefore, is not a panacea that cures all mathematical ills but, used appropriately, it is one of several factors that contribute to mathematical achievement and to the flexible mathematical thinking that is required in today’s society.
Key Points
• While the frequency of calculator use in homes and second-level schools is increasing, uptake in the Senior classes at primary level is still low.
• In Ireland and elsewhere, calculators have been used most often for checking answers and doing routine operations.
• Failure to exploit the calculator to its full potential may reinforce negative attitudes towards it on the part of teachers.
Country Singapore 100 605 Rep. of Korea 65 589 Hong Kong 98 586 Chinese Taipei 66 585 Japan 63 570 Belgium (Flemish) 97 537 Netherlands 100 536 Hungary 81 529
% of Students Whose Teachers Reported That Calculators Are
Permitted
How were the calculator
tests and questionnaires
developed?
This chapter provides information on the rationale for, and content of, the calculator tests, and teacher and student questionnaires that were developed.
Calculator Tests
The process of designing suitable items to assess calculator issues, curricular issues, and assessment issues, and assembling them into tests is described in detail in the main Phase I and Phase II reports. In short, the final design for the test specified three
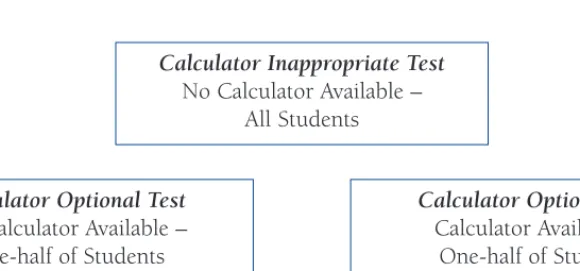
measures: a Calculator Inappropriate test (in which calculators were not available to any students); a Calculator Optional test (in which calculators were available to half of the cohort and not available to the other half); and a Calculator Appropriate test (of which there were two forms, Booklet 1 and Booklet 2, both of which permitted calculator access) (Figure 2.1).
Figure 2.1: Summary of Tests Developed
The requirements to test mental and written arithmetic, understanding of number, and data analysis, shaped the mathematical topics and skills tested.
Test items fell into one of two categories: those which assessed ‘knowledge of
mathematical facts, procedures and concepts’, and those which assessed ‘knowledge of
3
Calculator Optional Test No Calculator Available –
One-half of Students
Calculator Optional Test Calculator Available –
One-half of Students Calculator Inappropriate Test
No Calculator Available – All Students
Calculator Appropriate Test Calculator Available –
All Students
applications to real-life contexts’. Tests included both multiple-choice and short constructed-response items, and displayed an overall ‘gradient of difficulty’, that is the Calculator Inappropriate test was intended to be easier than the Calculator Optional test, which, in turn, was intended to be easier than the Calculator Appropriate test. Minor changes were made to the tests in 2004 to amend or remove items that functioned poorly in Phase I.
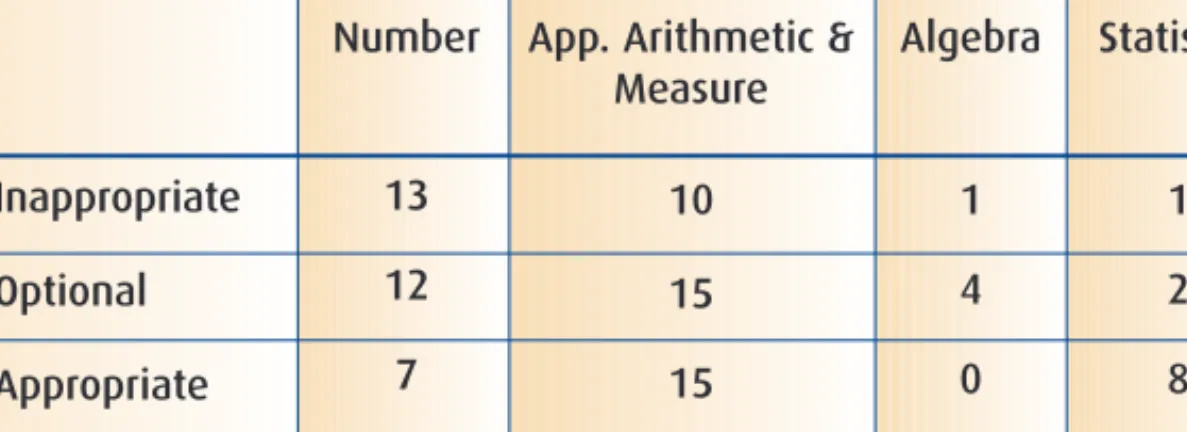
Test items focused chiefly on assessing the Junior Certificate syllabus content area of Applied Arithmetic & Measure (because of its relevance for the use of real-life data), followed by Number Systems and Statistics (as these are the most calculator sensitive topics accessible to all Third-year students), and Algebra (focusing on the solution of simple equations) (Table 3.1).
A selection of sample items from the three tests is provided in Appendix A.
Questionnaires
Teacher and Student Questionnaires were written for Phase I and developed further for Phase II. These were designed to investigate variables that might be associated with student performance on the tests, and to provide both background data on participating students and their teachers and information on school policies on calculators and arithmetic skills.
The teacher questionnaire sought to ascertain teachers’ attitudes towards calculator usage by students in a variety of contexts, including the home, the classroom and the
Certificate examinations. For Phase I, the questionnaire also sought information about the relative emphasis that teachers placed on various aspects of school mathematics. For Phase II – carried out when calculator use was allowed in the Junior Certificate
mathematics examinations – the questions on this topic were replaced by questions seeking information in two areas: school or teacher policy with regard to numeracy issues, including calculator use; and teachers’ experience of aspects, benefits and problems of calculator usage.
Table 3.1: Number of Items on Each Calculator Test, by Mathematics Content Area
Number of Items Number
13 12 7
App. Arithmetic & Measure 10 15 15 Algebra 1 4 0 Statistics 1 2 8 Total 25 33 30 Test Calculator Inappropriate Calculator Optional Calculator Appropriate
The student questionnaire sought information on students’ calculator usage at home and at school in a range of subjects, including mathematics, and asked about students’ attitudes to mathematics in general and towards calculator usage in particular. In Phase II, additional questions were asked in order to investigate students’ experience of calculator use in the revised curriculum.
Key Points
• Three tests were developed: a Calculator Inappropriate test, a Calculator Optional test, and a Calculator Appropriate test.
• Items were either multiple-choice or constructed-response.
• The main areas assessed were Number and Applied Arithmetic & Measure. • Teacher and student questionnaires were also developed.
4
Stratum Secondary (large) Secondary (small) Vocational (large) Vocational (small) Comm/Comp TotalDefined Population Achieved Sample Schools n % Students n % Schools n % Students n % 45.1 15.9 14.0 10.7 14.4 100 270 95 84 64 86 599 27410 4275 8229 2776 9463 52153 52.6 8.2 15.8 5.3 18.1 100 32 7 17 4 13 73 43.8 9.6 23.3 5.5 17.8 100 671 115 329 75 269 1459 46.0 7.9 22.5 5.1 18.4 100
How was the study
implemented?
This chapter describes implementation of the Phase II study, including the sample of schools and students involved, the scaling procedures, and the approaches taken to analyse the data.
The Sample of Schools and Students
Phase II was implemented in November 2004 – the same time of the year as the Phase I main study – to enhance the validity of comparisons drawn between the 2001 and 2004 samples.
The target population consisted of Third-year students in schools on the Department of Education and Science’s post-primary schools database for the 2003-04 school year. As in 2001, students in special schools, or in full-time special (resource) classes in ordinary schools, were excluded.
Schools were stratified by type (Secondary, Vocational, Community/ Comprehensive) and size (large or small) (Table 4.1). Within each stratum, schools were sorted by the
percentage of female students in Third year and by school size. Schools were then selected using probability proportional to size systematic sampling. The numbers and percentages of students and schools in the defined and the achieved samples are presented in Table 4.1. One class in each participating school was selected at random from a list of Third-year classes. The school response rate was 66% (73 schools after replacement).
Table 4.1: Numbers and Percentages of Schools and Students in the Defined Population and Achieved Sample, by Stratum – Phase II
In all, 1459 Third-year students completed the calculator tests, and 1448 of these students also completed the Student Questionnaire. Of the 73 teachers whose classes participated in the study, 71 completed the Teacher Questionnaire. Weights were computed to compensate for the unequal distribution of students in different strata in the sample (see the main report for full details of the weighting process).
Comparison of the 2001 and 2004 Samples
Every effort was made to ensure that the Phase II sample was both representative of the population of Third-year students in Ireland and also broadly equivalent with the Phase I sample. Across the two phases, the achieved samples are broadly similar, though there were proportionately fewer large Secondary schools/students, and proportionately more large Vocational schools/students in the Phase II sample, relative to the Phase I sample. The proportions of male and female students in Phase I and Phase II were broadly similar, with 43% and 45% of the Phase I and Phase II samples male, and 53% and 54% female (data on gender were missing for some students in both years).
Implementation in Schools
Participating schools appointed co-ordinators to liaise with the Educational Research Centre and oversee the administration of the testing.
In all cases, the 30-minute Calculator Inappropriate test was administered first. Students did not have access to a calculator for this test. After a short break, students were administered the 40-minute Calculator Optional test. The calculator and non-calculator versions of the test (only the directions with respect to calculator usage were different) were distributed to alternate students. After another short break, the 25-minute
Calculator Appropriate test was administered, the two forms being randomly distributed within classes. Following another short break, the Student Questionnaire was
administered. Teachers were encouraged to complete the Teacher Questionnaire at the same time as students were working on their questionnaire.
Scaling the Calculator Tests
Scaling of the calculator tests using Item Response Theory (IRT) meant that it was possible to implement some minor changes to the tests without invalidating comparison across the two phases. The performance of students in 2004 was placed on the same scales that were developed in 2001, allowing for valid comparisons of achievement over time. More details of the scaling procedure can be found in Chapter 4 of the Main Phase II report.
Analysis of the Data
In general, mean raw scores, scale scores, percent correct scores, scores associated with selected percentile ranks, and percentages of students reported are weighted population estimates that take into account the unequal representation of students from different schools and school types in the sample. They were obtained by applying weights to students’ scores during analysis. Mean and percentage scores in this report are often accompanied by a standard error. A standard error is a measure of the extent to which an estimate derived from a sample (for example, a mean score) is likely to differ from the true (unknown) score in the population. Using these standard errors, it is possible to estimate whether differences (for example, between scores in Phase I and Phase II) occur due to chance, or whether the differences are ‘real’ (or statistically significant). If
differences are identified as being statistically significant, we can say that we are 95% confident that the differences are real, and not simply due to chance (see Appendix B).
Key Points
• The achieved samples for Phase I (2001) and Phase II (2004) samples were broadly equivalent.
• In both phases, about 45% of students were males and approximately three-fifths of students intended to sit the Junior Certificate mathematics examination at Higher level.
• 73 schools took part in the Phase II study. These were drawn from the Secondary, Vocational, and Community/Comprehensive sectors, and included schools of various size.
• The performance of students in 2004 was placed on the same scales that were developed in 2001, allowing for valid comparisons of achievement over time.
How did students perform
on the calculator tests?
In this chapter, the performance of students on the calculator tests in 2001 and 2004 is compared. First, overall performance is considered. Then performance in mathematics content areas assessed is examined. The chapter concludes with analyses of rough work recorded by students in 2004 on their test booklets.
Overall Performance on the Calculator Tests in 2001 and 2004
Scale scores on the 2001 and 2004 tests can be compared directly, because scores are placed on the same underlying scale using Item Response Theory. Comparison of raw scores and percent correct scores involved the items common to both the 2001 and 2004 tests.
The mean score on the Calculator Inappropriate test in 2004 (a scale score of 243) was lower than in 2001 (250) (Figure 5.1). However, the difference is not statistically significant. A similar finding emerged for the Calculator Optional test (no calculator available condition). Students achieved a mean score of 227 in 2004, compared with 236 in 2000, and again the difference is not statistically significant. Taken together, these results point to a non-siginficant drop in basic computational skills since 2001. Students did better in 2004 than in 2001 on the two tests for which a calculator was available. The mean score on the Calculator Optional test (calculator available condition) in 2004 was 272. This was greater than the mean score of 266 in 2001. However, the difference is not large enough to reach statistical significance.
5
Figure 5.1: Mean Scale Scores for the Calculator Inappropriate, Calculator Optional, and Calculator Appropriate Tests, 2001 and 2004
* Denotes a significant difference in performance between 2001 and 2004
Students taking the Calculator Appropriate test in 2004 achieved a higher mean score (263) that students taking the same test in 2001 (250).The difference was statistically significant. Students scoring at the 10th, 50th and 75th percentiles (but not the 90th) on this test in 2004 achieved significantly higher scores than their counterparts in 2001. Hence, experience with use of the calculator seems to have benefited lower- achieving and average students to a greater extent that higher-achieving students.
While it is encouraging that performance on the Calculator Appropriate test in 2004 was better than 2001, it must be acknowledged that mean percent correct scores on this test were lower than on the other tests in both years. In 2004, the mean percent score on the Calculator Appropriate test was 41%, while in 2001, it was 35%. In contrast, the mean percent correct score for the Calculator Inappropriate test in 2004 was 57%, while in 2001, it was 60%. Hence, despite calculator availability, students do relatively less well on the types of complex, real-life problem-solving items on the Calculator Appropriate test, for which access to a calculator is viewed as being helpful.
Performance on Mathematics Content Areas in 2001 and 2004
Each item on the calculator tests was categorised according to the mathematics content area of the syllabus it addressed – Number Systems, Applied Arithmetic & Measure, Algebra, or Statistics. The overall results by content area for 2001 and 2004 when the three tests are combined are presented in Table 5.1.
280 270 260 250 240 230 220 210 200
Inappropriate Optional Optional Appropriate* (Access) (No Access)
2001 2004
Content Area
Number Systems*
Applied Arithmetic & Measure** Algebra*** Statistics**** 2001 2004 % 60.6 46.4 46.2 50.1 SE 1.79 1.87 2.92 2.11 % 60.8 45.7 48.3 49.8 SE 1.20 2.00 1.67 2.04
Table 5.1: Mean Percent Correct Scores, by Mathematics Content Areas
* 32 items; ** 41 items; *** 5 items; ****9 items
The lack of statistically significant changes in percent correct scores on each content area (on the three calculator tests combined) suggests that the overall mathematical skills of students have not significantly changed on any of the major content areas over the three-year period of the study. When the results for each calculator test are analysed separately, however, several significant differences are discernible.
On the Calculator Optional test, the 2004 group who had access to calculators did significantly better than the 2001 group with access to calculators, on both Number Systems and Algebra, and slightly better (though not significantly so) on Applied
Arithmetic & Measure and Statistics. This finding indicates that students were able to use calculators with somewhat greater effect on calculator optional tasks in these areas in 2004 than in 2001. On the other hand students without access to a calculator for this test did significantly less well on Number Systems in 2004 than in 2001.
As indicated above, in both 2001 and 2004, items on the Calculator Appropriate test were more difficult for students than items on the other tests. Items which caused most difficultly were in the area of Applied Arithmetic & Measure, though there was a significant increase in percent correct scores on this content area between 2001 and 2004.
Performance on Individual Items
An item-by-item comparison within each calculator test identified items on which overall student performance significantly increased or decreased between 2001 and 2004. On the Calculator Inappropriate test, students in 2004 did significantly better on five of the seven items on which there was a significant difference. Items from the test for which the largest increase and decrease were recorded are presented in Figure 5.2.
Figure 5.2: Items on the Calculator Inappropriate Test on which There Was a Significant Increase or Decrease in Percent Correct Scores between 2001 and 2004
SED = Standard Error of the Difference
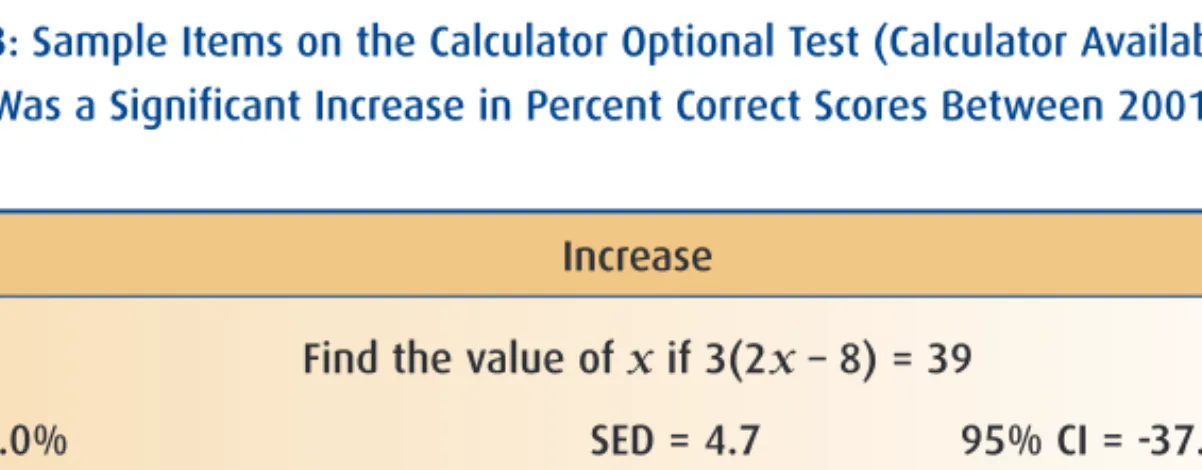
On the Calculator Optional test, when students had access to calculators, overall performance was higher in 2004 than in 2001, but not significantly so. However, when items were considered separately, there was a significant increase in performance on 13 of them. Descriptions of two of these items are presented in Figure 5.3.
Figure 5.3: Sample Items on the Calculator Optional Test (Calculator Available) on which There Was a Significant Increase in Percent Correct Scores Between 2001 and 2004
SED = Standard Error of the Difference
Increase 0.4956 corrected to 2 places of decimals is:
Difference = 10.0% SED = 2.5 95% CI = -14.9 to -5.1 The length of a rectangle is 6 cm, and its perimeter is 16 cm. What is the area of the
rectangle in square centimetres?
Difference = 11.0% SED = 5.1 95% CI = -21.2 to -0.8 Decrease
The Smith family uses about 6000 litres of water per week. Approximately how many litres of water do they use per year?
Difference = -8.0% SED = 1.1 95% CI = 5.7 to 10.3
If
x
= 0.3, find the value of 5x
.Difference = -8.0% SED = 3.1 95% CI = 1.8 to 14.2
Increase
Find the value of
x
if 3(2x
– 8) = 39Diff = 28.0% SED = 4.7 95% CI = -37.4 to -18.7
Evaluate: 1 + (0.3)2
√0.25
On the Calculator Optional test, when students had no access to calculators, students in 2004 recorded significant increases in percent correct scores on 9 of the 14 items and a significant drop on 5. Descriptors for the items on which the largest increases and decreases in performance were noted are presented in Figure 5.4.
Figure 5.4: Sample Items on the Calculator Optional Test (No Calculator Access) on which There was a Significant Increase or Decrease in Percent
Correct Scores between 2001 and 2004
SED = Standard Error of the Difference
On the Calculator Appropriate test, on which there were 27 common items, students in 2004 performed significantly better than students in 2001 on 18 items, and significantly less well on one. Descriptions of selected items, including the item for which there was a significant decrease, are presented in Figure 5.5.
How did students perform on the calculator tests?
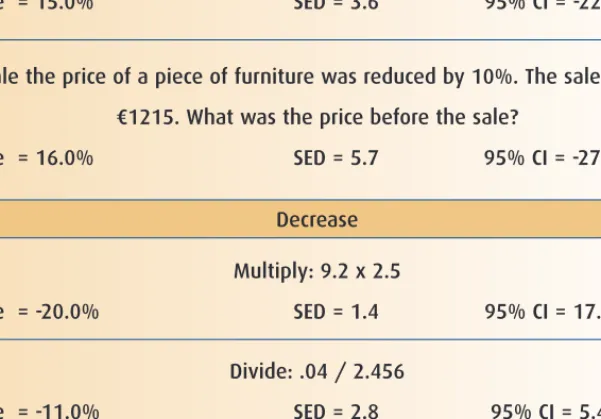
Increase
Find the value of 3.8 + (3.2 x 6)
Difference = 15.0% SED = 3.6 95% CI = -22.3 to -7.7
In a sale the price of a piece of furniture was reduced by 10%. The sale price was €1215. What was the price before the sale?
Difference = 16.0% SED = 5.7 95% CI = -27.5 to -4.5 Decrease Multiply: 9.2 x 2.5 Difference = -20.0% SED = 1.4 95% CI = 17.3 to 22.7 Divide: .04 / 2.456 Difference = -11.0% SED = 2.8 95% CI = 5.4 to 16.6
Figure 5.5: Sample Items on the Calculator Appropriate Test (No Calculator Access) on which There was a Significant Increase or Decrease in
Percent Correct Scores between 2001 and 2004
Investigation of Students’ Rough Work
An analysis of the calculations recorded in the ‘Rough Work column’ of each test provides some insight as to how the students responded the test questions.
In 2001 the investigation of students’ work was undertaken using a small, representative selection of the scripts. These students were more likely to show their work when they did not have access to a calculator than when they had access. On the Calculator Appropriate test, few students recorded any work in the rough work column. For items on the Calculator Inappropriate test requiring estimation, students tended to find exact answers using pen and paper or, in multi-choice format, to state that the correct answer was not given.
In 2004 all scripts were analysed in terms of rough work usage. The mean number and percent of rough work records per student per test is presented in Table 5.2. Predictably, the highest proportion of rough work was found for students who took the Calculator Optional test without access to calculators. Where calculators were available, there was a substantial reduction in the amount of rough work shown. Correlations between volume of rough work and mean scale scores on the calculator tests are all positive and
significant. Hence, students who produced more rough work generally did better on the calculator tests than students who produced less rough work. The strongest correlation was for the Calculator Optional test (no access to calculator) (0.51), and weakest for the Calculator Inappropriate test (0.36), in which many of the items were designed to be done mentally.
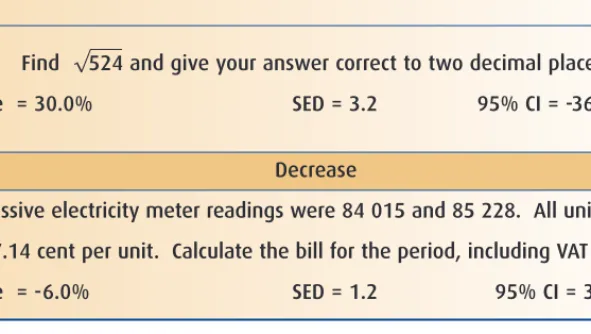
Increase
Fill in the missing operations (+, -, x, ÷): 27 (36 11) = 675
Difference = 30.0% SED = 1.2 95% CI = -32.5 to -27.5
Find √524 and give your answer correct to two decimal places.
Difference = 30.0% SED = 3.2 95% CI = -36.4 to -23.6 Decrease
Two successive electricity meter readings were 84 015 and 85 228. All units are charged at 7.14 cent per unit. Calculate the bill for the period, including VAT at 10%.
Test
Inappropriate Optional (Calc) Optional (No Calc) Appropriate (Bk 1) Appropriate (Bk 2) No. of Items 25 33 33 15 15 Mean no of RW records/student 8.1 9.7 18.2 3.9 4.3 Mean % of RW records/student 32.2 30.3 56.9 26.1 28.3
Table 5.2: Extent of Rough Work Usage by Students on the Calculator Tests (2004)
Key Points
• In 2004, students performed less well on the tests for which they did not have calculator access than in 2001. However, differences in performance on the Calculator Inappropriate and Calculator Optional tests (without calculator access) were not statistically significant. This can be interpreted as indicating that the integration of calculators into the Junior Certificate mathematics classes has not, as feared, had a detrimental effect on students’ basic mathematics skills. • In 2004, students performed better on the tests for which they had access to a
calculator than in 2001. The improvement was statistically significant on the Calculator Appropriate test, but not on the Calculator Optional (with calculator access) test. The improved performance on the Calculator Appropriate test suggests that students’ ability to make use of the calculator in solving problems improved over the three years.
• Access to a calculator for the Calculator Optional test provided a clear advantage, compared with no calculator access.
• Incidence of rough work was highest on the Calculator Optional test (with no calculator access), and substantially lower on the Calculator Optional (with calculator access), the Calculator Inappropriate, and the Calculator Appropriate tests.
• Students who produced more rough work performed better on the calculator tests than students who produced less rough work.
What were students’
attitudes to calculators?
This chapter examines associations between student variables and performance on the calculator tests. First, associations among gender, socioeconomic status, and performance are described; then students’ access to, and use of, calculators are considered; finally, students’ attitudes to mathematics and to calculator use are examined. Responses for 2004 are based on the 1448 students who completed the Student Questionnaire.
Gender and Socioeconomic Status
As in 2001, there were no statistically significant gender differences in performance on any of the calculator tests. However, there were some non-significant differences. Female students were marginally ahead of males on just one test in 2001 (Calculator Optional), but were marginally ahead on two in 2004 (the Calculator Optional and Calculator Appropriate tests).
Based on the occupation of their parents, each student was identified as belonging to the upper, middle, or lower socioeconomic group (SEG). In both 2001 and 2004, students in the upper SEG achieved mean scores that are significantly higher than those of students in the lower SEG on all three calculator tests. In 2004, but not in 2001, students in the middle SEG significantly outperformed their counterparts in the lower SEG on all three tests.
Students’ Access to and Use of Calculators
In 2004, almost all students reported that they owned, or had access to, a calculator at school and at home. Scientific calculators were most popular, and less than 1% of students used, or had access to, a graphics calculator.
Students were asked about the frequency of calculator use in four subjects: Mathematics, business studies, science, and technology. While 81% of students used a calculator ‘often’ in mathematics and 62% did so with the same frequency in business studies, less than 3% reported using a calculator ‘often’ in science, and three-quarters ‘never’ used one in technology.
When asked about calculator usage at primary school, 72% of students reported that they never used a calculator in their primary mathematics classes, while 3% reported using it ‘often’. With regard to the frequency of calculator usage in different areas of mathematics at post-primary level, just over 10% of students reported that they never
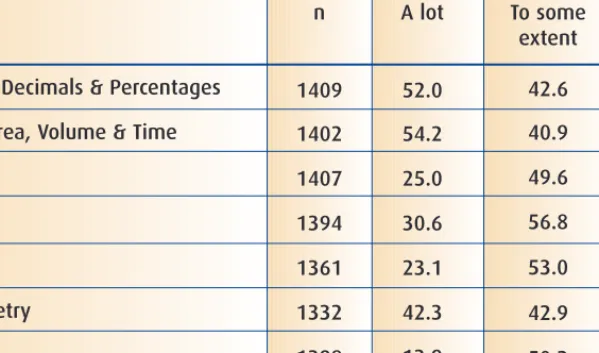
used a calculator in their First year mathematics classes, though by Second year, this figure had dropped to 5%. The frequency of calculator use in Third year in each mathematics area is displayed in Table 6.1. On average, students who reported using a calculator ‘a lot’ in a particular area tended to achieve higher scores on the Calculator tests than students who did not.
Comparisons with 2001, not surprisingly, show increased calculator usage in
mathematics classes, from fewer than 1% using a calculator ‘often’ in 2001, to over 80% in 2004. Calculator use in business studies classes remained about the same, while there was a slight increase in use in both science (0.6%) and technology (5.2%) classes.
* These areas, rather than the content areas referred to in the syllabus, were used in the student questionnaire
Students’ Attitudes to Mathematics
Students responded to a series of attitudinal questions relating to mathematics and calculators. Females had more positive attitudes towards mathematics than had males, while males had a significantly stronger belief about the usefulness of mathematics. The easiest areas of mathematics, according to students, were Graphs followed by Fractions, Decimals & Percentages, Statistics, and Algebra, while the most difficult areas were Geometry and Trigonometry. Interestingly, when these are compared with the areas teachers identified as easy or difficult to teach (see Chapter 7), Functions & Graphs, and Number Systems were identified as easiest to teach, while Geometry and Trigonometry were considered more difficult.
Area*
Fractions, Decimals & Percentages Length, Area, Volume & Time Algebra Statistics Geometry Trigonometry Graphs n 1409 1402 1407 1394 1361 1332 1398 A lot 52.0 54.2 25.0 30.6 23.1 42.3 13.9 Never 5.4 4.9 25.5 12.7 24.0 14.8 36.0 To some extent 42.6 40.9 49.6 56.8 53.0 42.9 50.2
Table 6.1: Percentages of Students Indicating Various Levels of Calculator Usage in Different Mathematics Content Areas (2004)
Students’ Attitudes to Calculators
The proportions of students who ‘agreed’ or ‘strongly agreed’ that a calculator can help with performance and that its use should be allowed for class and homework increased from two-thirds in 2001, to over 90% in 2004. Similar proportions in 2004 believed that calculators were not only for students with difficulties in mathematics, and that a
calculator should not replace the need for pen and paper calculations.
Student attitudes to calculator use in mathematics and other subjects were mixed. Students who supported the availability of calculators across subjects including
mathematics tended to perform better on the Calculator Appropriate test than those who did not. On the other hand, students who were more negatively disposed to calculator usage, and felt it could make them lazy at school mathematics tended to do less well on each of the calculator tests than students who did not hold such views. Aspects of calculator use that students enjoyed most were the ease and speed of computation and the convenience for basic operations, algebra, and fractions. The main perceived
disadvantages of calculator use were the greater potential for making mistakes, difficulty in using the calculator, and a fear that calculators ‘do not engage the brain’. The
proportion of students who believed a calculator could make them lazy at school mathematics decreased from 55% in 2001 to 41% in 2004.
Key Points
• In 2004, females outperformed males on the Calculator Optional and Calculator Appropriate tests, though differences were not statistically significant.
• Students from higher socioeconomic backgrounds performed significantly higher on all three calculator tests than students from lower socioeconomic
backgrounds in both 2001 and 2004.
• Almost three-quarters of students in 2004 reported that they had never used a calculator in their mathematics classes at primary level, though the vast majority of these would have completed primary school before the implementation of the 1999 Primary School Curriculum.
• There was a large increase in calculator usage in mathematics classes, from fewer than 1% using a calculator ‘often’ in 2001, to over 80% using one ‘often’ in 2004.
• Between 2001 and 2004, there was a substantial increase in the proportion of students who believed a calculator could help mathematics performance and that it should be used in class and at home.
• Students in the 2004 study enjoyed the ease and speed of computations when using a calculator, though some expressed concern over the potential for error. • Students reported Functions & Graphs, and Number Systems as the easiest
aspects of Mathematics, and Geometry and Trigonometry as the most difficult aspects.
What were teachers’
attitudes to calculators?
A Teacher Questionnaire was administered in both 2001 and 2004. This chapter examines teachers’ attitudes towards the use of calculators in Junior Cycle mathematics classes and in the Junior Certificate mathematics examination.
Background of Teachers
There was no significant difference between 2001 and 2004 in the proportion of students taught by male and female teachers (marginally more students were taught by female rather than male teachers in 2004). There was, however, an increase in teachers’ level of experience, with more students in 2004 (32%) taught by teachers with more than 25 years experience, than in 2001 (19%). The majority of students in 2004 (almost two-thirds) were taught by teachers who regarded any negative effect of the Junior Certificate mathematics examination on students’ progress in mathematics as minimal. While teachers in 2004 reported Algebra and Statistics as the most enjoyable content areas to teach, most also perceived Algebra to be one of the areas that students have most difficultly with (along with Trigonometry and Geometry).
School Policy on Calculators
Just over one-fifth (22%) of students in the 2004 study were taught by teachers who said that their school had a policy on calculators, and approximately a quarter of these were in schools in which the policy was described as official. In the minority of schools in which policies were in place, they had been agreed among mathematics teachers (70% of students); they required that calculator use be taught in First year (57%); and they forbade the use of mobile phones as calculators (89%).
Use of Calculators in Junior Cycle Mathematics Classes
Although many teachers of students in the 2001 study did not permit calculator use for home or class work at that time, almost three-quarters were in favour of calculator use where relevant. By 2004, when students were permitted to use calculators in the Junior Certificate mathematics examination, most pupils (almost 90%) were taught by teachers who were in favour of calculator use for mathematics class work and homework.
7
According to teachers, calculators were most used in the areas Trigonometry and Applied Arithmetic & Measure, while there was limited use in Sets, Geometry and Algebra. From a selection of 13 calculator activities aimed at developing relational understanding, mental arithmetic and estimation skills (see Appendix 2), teachers of over half of the students (52%) said they sometimes used the ‘Guess and Press’ activities, while teachers of 38% of pupils said they sometimes used the ‘Square and Square Root’ activity. There was little use of any of the other activities by teachers.
Almost 90% of students were taught by teachers who reported that they taught estimation skills, two-thirds were taught by teachers who taught calculator operation skills, and almost 40% by teachers who taught mental arithmetic skills. Teachers indicated that these skills are mainly taught in First year and, to a considerably lesser degree, in Second and Third years. The lack of emphasis on mental arithmetic skills may be due to expectations that students coming in from primary schools would be proficient in this area, or the fact that such skills are not explicitly tested in the Junior Certificate mathematics examination. Most students (90%) were taught by teachers who gave ‘some’ or ‘much’ emphasis to encouraging students to record intermediate results in doing calculations with calculators.
Most students had teachers who ensured that their students could use the more familiar features of calculators (e.g., percent, fraction, power, brackets, and +/- keys), though fewer students were supported in using the constant function and memory keys (Table 7.1). Students whose teachers ensured they could use the fraction keys scored
significantly higher on the Calculator Appropriate test than those whose teachers did not ensure they could use fraction keys.
Percentage key Brackets Fraction keys
Interpreting the display “Power” keys
Memory
Constant function + / - key
Exponential (scientific) form
Yes n % No n % Missing n % 68.9 83.1 76.8 69.9 90.9 27.8 21.1 92.6 60.6 1019 1213 1122 1021 1327 406 308 1352 885 369 176 266 309 32 940 983 29 441 25.3 12.0 18.2 21.2 2.2 64.4 67.3 2.0 30.2 71 71 71 131 101 114 169 79 135 4.9 4.9 4.9 8.9 6.9 7.8 11.6 5.4 9.2
Table 7.1: Percentage of Students Whose Teachers Ensured Various Calculator Features Could be Used (2004)
The percentage of students taught by teachers who allowed the use of calculators at all times increased from 38 in First year to 78 in Third year. Most students in the 2004 study were taught by teachers who indicated that they encouraged or required the use of some sort of method to check the answers students obtained with their calculators. Just over half of students (56%) were taught by teachers who stated that the availability of calculators in class had affected their teaching methods. The areas where they considered their teaching methods to have been affected most included Statistics, Trigonometry, Sets, and Applied Arithmetic & Measure. Specific comments by teachers included references to students’ ability to check answers, quicker and more accurate calculations, benefits of the calculator to weaker students, and more time available for teaching methods.
Perceived Advantages and Disadvantages of Calculator Access in
Junior Certificate Mathematics
More than four-fifths of students were taught by teachers who indicated that a calculator was beneficial in improving accuracy in students’ work, and in increasing their ability to move through topics. However, almost 50% of the students were taught by teachers who saw no benefit in calculator access for the clarification of concepts and procedures. When the teachers were asked to specify particular benefits, responses fell under the main categories of saving time, greater ease of teaching some topics, and giving students (especially weaker students) confidence and independence.
Ninety percent of the students were taught by teachers who said they had little or no problem in teaching students how to use the calculator within each topic. When asked to specify drawbacks of calculators, responses referred to loss or breakage of calculators, use of incorrect mode, inappropriate use of or over-reliance on calculators, and a decline in various aspect of numeracy (mental arithmetic, estimation, concepts, tables,
computational skills).
Graphics calculators and computer algebra systems (CAS) were rarely used at Junior Cycle level in Ireland. Indeed, only 5% of students were taught by teachers who said that the school had a set of graphics calculators. Eight percent of students were taught by teachers who said their schools had at least one CAS calculator.
Almost two-thirds of students were taught by teachers who said they made different use of calculators with lower-achieving students than with other students. The students of these teachers scored significantly higher on the Calculator Appropriate test than did the students of teachers who said they did not make different use of calculators.
Teachers’ General Comments
Teachers were invited to add further comments at the end of the questionnaire. Most of the comments can be clustered into the following groups:
• General attitudes to calculator use, both positive and negative.
• Recognition of specific advantages of calculator use (less drudgery, support for lower-performing students, benefits for particular topics) and disadvantages (loss of mental arithmetic and computational skills).
• Attribution of blame for difficulties to primary schools. • Recognition that calculators are a feature of everyday life.
• Policy issues (for example, with respect to non-use of calculators in First year, and provision for ‘calculator free’ days).
Key Points
• About 22% of students in the 2004 study were taught by teachers who said that their school had a policy on calculators, and approximately a quarter of these had an ‘official’ policy.
• Most students (86%) were taught by teachers who were supportive of calculator use for mathematics class work and homework.
• The teaching of estimation, calculation, and mental arithmetic skills occurs largely in First year.
• Just over half of students were taught by teachers who stated that the availability of calculators in class had affected their teaching methods, particularly the areas of Statistics, Trigonometry, Sets, and Applied Arithmetic & Measure.
• According to teachers, the benefits of calculator use included saving time, greater ease of teaching some topics, and increasing confidence and independence among students, especially the weaker ones.
• Disadvantages of calculator use included practical management issues, inappropriate use of or over-reliance on the calculator, difficulty in using calculators effectively, and a possible decline in some aspects of numeracy.
How did students’
performance on the
calculator tests and the
Junior Certificate
mathematics examination
compare?
The relationship between the performance of students on the calculator tests (taken in November 2004) and their performance on the Junior Certificate mathematics
examination (taken in June 2005) is considered in this chapter.
Performance of Students on the Calculator Tests and the 2005
Junior Certificate Mathematics Examination
Students’ 2005 Junior Certificate results were matched to their calculator test results. Of those matched, over half (54%) sat the Higher level, 41% sat the Ordinary level, and 5% sat the Foundation level paper. The mean scores on the Calculator Inappropriate and Calculator Appropriate tests of students taking the Higher level mathematics examination were 271 and 291 respectively (Table 8.1). These were significantly higher than the corresponding mean scores of students taking Ordinary level (216 and 236) and Foundation level (172 and 195).
How did students’ performance on the calculator test and the Junior Certificate mathematics examination compare?
JC Level n %
Higher 783 54.3
Ordinary 587 40.7
Foundation 73 5.0
Inappropriate
Mean SE Mean SE Mean SE Optional Appropriate 5.58 2.42 1.82 270.6 216.0 171.5 276.1 223.2 183.8 4.28 0.80 3.34 291.0 235.5 194.6 1.90 2.04 7.32 Calculator 350 300 250 200 150 100 50 0
Higher Ordinary Foundation
Access No Access
Table 8.1: Mean Scale Scores on the Calculator Tests (2004), by Junior Certificate Mathematics Examination Level (2005)
The performance of students at the three examination levels on the Calculator Optional test is summarised in Figure 8.1.
Figure 8.1: Mean Scale Scores on the Calculator Optional Test (2004), by Calculator Access and Junior Certificate Mathematics Examination Level (2005)
At each examination level, students with access to a calculator did significantly better than students without. The benefit of calculator access is clearly noted when it is observed that the mean scale score of Ordinary level students with access to a calculator (243) approaches (but is not statistically different from) that of Higher level students without access (251). Similarly, the performance of Foundation level students with calculator access (200) is not significantly different from that of Ordinary level students without access (203). This suggests that calculator access is beneficial to lower-achieving students on the types of problems assessed by the Calculator Optional test.
Correlations between Calculator Test Performance and 2005
Junior Certificate Grades in Mathematics
Correlations between students’ performance on the calculator tests in November 2004 and their grades in their 2005 Junior Certificate mathematics examination2are strong, positive, and statistically significant (in the range of 0.4 to 0.5) for Higher and Ordinary levels, but lower for the Foundation level (0.0 to 0.3). The stronger correlations for Higher and Ordinary suggest that the calculator tests better capture the range of achievement among students at these levels.
Setting aside the level of the Junior Certificate mathematics examination taken, the correlation between scaled Junior Certificate mathematics grade and performance on the Calculator Inappropriate test is 0.70, while for the Calculator Appropriate test it is 0.69. For the Calculator Optional test, the correlation is stronger when students had access to a calculator (0.8) than when they did not (0.7), though this is not the case for 2001. Taken together, the correlations reported here support the validity of the calculator tests as suitable instruments for assessing aspects of the taught Junior Certificate mathematics course.
Performance on Junior Certificate Mathematics (2001 to 2005)
This section looks at performance on the Junior Certificate mathematics examination in the two years preceding first examination of the revised syllabus (2001, 2002), and in the first three years succeeding it. In considering the data presented in Figure 8.2, it should be noted that changes in grade distributions may arise for a variety of reasons other than calculator availability, including variation in the proportion of students taking each examination level, the intrinsic difficulty of the questions, and the nature of the scoring schemes. The proportion of students achieving A to C grades at higher level increased at first examination of the revised syllabus in 2003, but, by 2005, had reverted to the 2001 level. At Ordinary level, more students achieved grades A to C in 2003 and 2004 and unlike Higher level the proportion achieving A to C in 2005 exceeded that for 2002. It is also noticeable that the proportion of students achieving grade E or lower at Foundation level, while comparatively low in 2003 and 2004, increased in 2005. This may, however, reflect a shift of students from Foundation to Ordinary level, with some very low achievers representing a greater proportion of Foundation level students in 2005 than in earlier years.
2 Numerical values were assigned to students’ grades, ranging from 1 (Grade F at Foundation level) to 12
(Grade A at Higher level)
How did students’ performance on the calculator tests Junior Certificate Mathematics examination compare?
Figure 8.2: Performance on the Junior Certificate Mathematics Examination, by Level (2001 to 2005)3
3 (Source – State Examination Commission; http://www.examinations.ie)
100 80 60 40 20 0 Pe rc entage 2001 2002 2003 2004 2005 Higher Level A-C D E-NG 100 80 60 40 20 0 Pe rc entage 2001 2002 2003 2004 2005 Ordinary A-C D E-NG 100 80 60 40 20 0 Pe rc entage 2001 2002 2003 2004 2005 Foundation Level A-C D E-NG
Key Points
• Students taking Higher level mathematics in 2005 achieved significantly higher scores than Ordinary or Foundation level students on each of the three
calculator tests.
• For students taking each examination level, mean scale scores were significantly higher on the Calculator Optional test when students had access to a calculator than when they did not.
• The mean scale score of Ordinary level students with access to a calculator on the Calculator Optional test was not significantly different from that of Higher level students without access.
• Similarly, there was no difference in the performance of Ordinary level students with no calculator access and Foundation level students with access on the same test. These findings indicate calculator access can narrow the gap between students of differing ability levels on the types of problems assessed by the Calculator Optional test.
• In general, the proportion of students achieving an ‘A to C’ grade increased following implementation of the revised syllabus (first examined in 2003). The greatest improvement was noted for Ordinary level students.
How did students’ performance on the calculator tests Junior Certificate Mathematics examination compare?
What can we learn from
the study?
The main goal of Phase I of the study, implemented in 2001, was to assess Junior Cycle students’ performance on key areas of numeracy in the mathematics curriculum in place at the time when calculators played no part in the curriculum or Junior Certificate mathematics examination. Phase II of the study was carried out in 2004, following implementation of a curriculum in which calculator usage was actively promoted, to obtain data in the same key areas, and to compare with the data from Phase I. As was the case in 2001, average percent correct scores in 2004 on the Calculator Inappropriate test are significantly higher than on the Calculator Optional test. Average scores on both these tests are significantly higher than scores on the Calculator
Appropriate test, supoorting the validity of the study design and the stability of the tests. In both 2001 and 2004, students with access to a calculator did significantly better on the Calculator Optional test than students who did not have access.
With regard to the effects of the calcultor on mathematics achievement over time, the performance of students in 2004 who did not have access to a calculator on the Calculator Optional test was lower than in 2001, though not to a significant extent. When students did have calculator access, however, their performance in 2004 on the Calculator Optional and Calculator Appropriate tests was significantly higher than in 2001.
Where Junior Certificate mathematics examination level is concerned, the benefit of calculator access is evident. On the Calculator Optional test, the mean scale score of Ordinary-level students who had access to a calculator approached, and was not significantly different from, the mean score of Higher level students without access to a calculator.
The non-significant decrease in performance on the Calculator Inappropriate and Calculator Option tests, when students do not have calculator access, should be monitored over time, but should not be cause for concern unless this trend is shown to continue. There are many factors besides calculator availability which should be taken into consideration. Firstly, changes in the syllabus were not limited to those involving calculator usage. For example, efforts were made to change teachers’ instructional and assessment processes through the provision of inservice. The potential for cultural and demographic changes in the three years between each phase and marginal differences in the achieved samples may also be associated with these changes. The attitudes of both teachers and students to calculators could be another important factor. In 2004, almost half of students were taught by teachers who stated that the availability of calculators in class had not affected their teaching methods, and a similar proportion saw no benefit in