DigitalCommons@ILR
DigitalCommons@ILR
Federal Publications Key Workplace Documents
1-2013
Refundable Tax Credits
Refundable Tax Credits
Congressional Budget Office
Follow this and additional works at: https://digitalcommons.ilr.cornell.edu/key_workplace
Thank you for downloading an article from DigitalCommons@ILR. Thank you for downloading an article from DigitalCommons@ILR. Support this valuable resource today!
Support this valuable resource today!
This Article is brought to you for free and open access by the Key Workplace Documents at DigitalCommons@ILR. It has been accepted for inclusion in Federal Publications by an authorized administrator of DigitalCommons@ILR. For more information, please contact [email protected].
If you have a disability and are having trouble accessing information on this website or need materials in an alternate format, contact [email protected] for assistance.
Abstract Abstract
The U.S. tax code contains many preferences that lower or eliminate the amount of taxes owed. Those preferences include deductions, exclusions, and tax credits, which can be either refundable or
nonrefundable. Refundable tax credits differ from other preferences in a significant way: Whereas other preferences reduce the amount of taxes owed to the government, refundable credits can result in net payments from the government. Specifically, if the amount of a refundable tax credit exceeds a filer’s tax liability before that credit is applied, the government pays the excess to that person or business.
In the federal budget, the portion of refundable credits that reduces the amount of taxes owed is counted as a reduction in revenues, and the portion that exceeds people’s tax liabilities is treated as an outlay. Since 1975, when the first refundable tax credit took effect, outlays have accounted for between 50 percent and 80 percent of the annual budgetary costs of refundable tax credits.
The number and total costs of the refundable credits in the income tax system have grown considerably since 1975. The number of credits peaked at 11 in 2010 before dropping to 6 in 2013 (see Figure 1). Their total costs (that is, the reduction in revenues and the increase in outlays) reached a high of $238 billion in 2008. (That amount and other annual costs discussed in this report are expressed in 2013 dollars.) Those costs will drop to $149 billion in 2013, the Congressional Budget Office (CBO) estimates, mostly for the earned income tax credit (EITC) and the child tax credit. By 2018, three more credits will have expired, and the EITC and the child tax credit will have been scaled back.
Those cutbacks in refundable tax credits will be more than offset, however, by new health-related subsidies provided through the tax system. Starting in 2014, a new refundable tax credit will be available to some people for the purchase of health insurance through newly created exchanges. The cost of that credit will be about $110 billion by 2021, CBO and the staff of the Joint Committee on Taxation (JCT) project, bringing the total cost of refundable tax credits in that year to $213 billion— roughly the same as the costs in 2009 and 2010, even though the number of refundable tax credits will have fallen by more than half between 2010 and 2021.
Keywords Keywords
refundable tax credits, federal budget, revenue, Congressional Budget Office Comments
Comments Suggested Citation Suggested Citation
Congressional Budget Office. (2013). Refundable tax credits. Washington, DC: Author.
CBO
Refundable
Tax Credits
JANUARY 2013
Numbers in the text and tables may not add up to totals because of rounding. Unless otherwise indicated, all years referred to in this study are calendar years.
Federal tax liabilities are the amount of federal taxes people owe on the basis of their annual income, regardless of when the taxes are paid. The portion of refundable tax credits that reduces the amount of federal tax liabilities is counted as a reduction in revenue. The portion that exceeds people’s tax liabilities is treated as an outlay.
Throughout this report, the costs of refundable tax credits are given in 2013 dollars. The Congressional Budget Office (CBO) used the price index for personal consumption expenditures to convert nominal costs into real (inflation-adjusted) costs.
Historical data on the effect of most refundable tax credits on the federal budget (including the reduction in tax liabilities and the increase in outlays) are based on a sample of tax returns. The data are available through 2009 from Internal Revenue Service (IRS), Statistics
of Income, Individual Income Tax Returns, Publication 1304 (various years), and, for 2010,
from “SOI Tax Stats - Individual Income Tax Returns Publication 1304 (Complete Report),”
www.irs.gov/uac/SOI-Tax-Stats-Individual-Income-Tax-Returns-Publication-1304-(Complete-Report) (December 18, 2012). Data on a refundable tax credit for corporations are available through 2009 from IRS, “SOI Tax Stats - Corporation Complete Report,”
www.irs.gov/uac/SOI-Tax-Stats-Corporation-Complete-Report (November 29, 2012). Projections are based on estimates from the staff of the Joint Committee on Taxation.
Summary 1
Changing Nature of Refundable Tax Credits 1
Effects on the Economy and the Tax System 1
Administrative Challenges in Providing Subsidies 2
Transparency of Refundable Tax Credits 3
The Structure of Tax Preferences 3
Costs of Refundable Tax Credits 6
Sharp Increase in Costs from 1975 to 2010 6
Declining Costs from 2010 to 2013 6
Rising Costs After 2013 8
The Evolution of Refundable Tax Credits 9
Earnings-Based Credits 9
Expenditure-Based Tax Credits 12
Credits Related to the Alternative Minimum Tax 13
Effects of Refundable Tax Credits 13
Effects on Economic Efficiency 14
Effects on Equity 15
Effects on Simplicity of the Tax System 16
Administrative Challenges in Providing Subsidies 16
Reaching Eligible People 17
Timing of Payments 19
Compliance 20
Budgetary Treatment of Refundable Tax Credits 22
Transparency of Total Costs 22
Allocation of Costs Between Outlays and Revenues 22
Appendix: Description of Refundable Tax Credits 25
List of Tables and Figures 30
Summary
The U.S. tax code contains many preferences that lower or eliminate the amount of taxes owed. Those preferences include deductions, exclusions, and tax credits, which can be either refundable or nonrefundable. Refundable tax credits differ from other preferences in a significant way: Whereas other preferences reduce the amount of taxes owed to the government, refundable credits can result in net payments from the government. Specifically, if the amount of a refundable tax credit exceeds a filer’s tax lia-bility before that credit is applied, the government pays the excess to that person or business.
In the federal budget, the portion of refundable credits that reduces the amount of taxes owed is counted as a reduction in revenues, and the portion that exceeds peo-ple’s tax liabilities is treated as an outlay. Since 1975, when the first refundable tax credit took effect, outlays have accounted for between 50 percent and 80 percent of the annual budgetary costs of refundable tax credits. The number and total costs of the refundable credits in the income tax system have grown considerably since 1975. The number of credits peaked at 11 in 2010 before dropping to 6 in 2013 (see Figure 1). Their total costs (that is, the reduction in revenues and the increase in outlays) reached a high of $238 billion in 2008. (That amount and other annual costs discussed in this report are expressed in 2013 dollars.) Those costs will drop to $149 billion in 2013, the Congressional Budget Office (CBO) estimates, mostly for the earned income tax credit (EITC) and the child tax credit. By 2018, three more credits will have expired, and the EITC and the child tax credit will have been scaled back.
Those cutbacks in refundable tax credits will be more than offset, however, by new health-related subsidies provided through the tax system. Starting in 2014, a new refundable tax credit will be available to some people for the purchase of health insurance through newly created exchanges. The cost of that credit will be about
$110 billion by 2021, CBO and the staff of the Joint Committee on Taxation (JCT) project, bringing the total cost of refundable tax credits in that year to $213 bil-lion—roughly the same as the costs in 2009 and 2010, even though the number of refundable tax credits will have fallen by more than half between 2010 and 2021.
Changing Nature of Refundable Tax Credits
Not only have the number and costs of refundable tax credits changed over the years, but the nature of those credits has evolved. Eligibility for the first refundable tax credit—the earned income tax credit—was based primarily on the recipient’s earnings, adjusted gross
income, and the number of children in his or her home.1
However, many of the newer refundable tax credits are not limited to people with earnings but are instead used to compensate people for expenditures on items such as health insurance and higher education. Once restricted to low-income workers who live with children, eligibility for some refundable tax credits has been extended—first to workers with very low income who do not live with children, then to people who incur certain types of expenses but who may not work, and more recently to some businesses.
Effects on the Economy and the Tax System
The growth of refundable credits affects the economy and the tax system in several ways. The credits affect:
Economic efficiency—how resources are allocated in
the economy;
Equity—how tax burdens are allocated among
households with varying demographic and economic characteristics; and
1. Adjusted gross income includes earnings and other taxable income (such as investment income), net of exclusions of some types of income (tax-exempt interest, for example) and certain adjustments.
Simplicity of the tax system—what the costs are of complying with and administering taxes.
Credits affect the allocation of resources by favoring cer-tain activities or goods. Credits that decline in value as income rises prompt some people to work fewer hours. However, credits that increase as earnings rise, such as the EITC at certain income levels, provide an incentive for some people to work more. The EITC also draws people into the labor force by increasing their after-tax income. On balance, that latter effect appears to dominate; researchers have identified a link between expansions of the EITC and increases in the number of people— especially single mothers—who have entered the workforce.
In addition, the growth of refundable tax credits has contributed to a decline in average tax rates among households in the bottom 40 percent of the income distribution. That decline is most notable for individual income tax rates, which between 2007 and 2009 became increasingly negative for low-income households (that is, on average, those households received money back from the federal government instead of owing income taxes). Most of those households, however, pay federal payroll taxes.
Refundable tax credits also affect the administration of taxes. By adding more complicated rules, more tax forms, and more computations, the credits increase the costs incurred by taxpayers in complying with the tax code and by the government in administering those laws.
Administrative Challenges in Providing Subsidies
Most refundable tax credits were created to meet social policy goals, such as providing income support for low-income households, expanding health insurance coverage, or increasing college enrollment. But those goals could instead be pursued through spending programs, such as the Supplemental Nutrition Assistance Program (formerly known as the Food Stamp program), the Temporary Assistance for Needy Families program, Medicaid, the Children’s Health Insurance Program, and the Pell Grant program.
The choice between using the tax system and relying on spending programs to meet such goals hinges largely on administrative considerations, such as the effectiveness in reaching the target population, timeliness, and the ability to ensure compliance with rules. Each of those considerations affects the costs incurred by the federal
Figure 1.
Number and Total Costs of
Refundable Tax Credits,
Calendar Years 1975 to 2021
Sources: Congressional Budget Office based on data from the Internal Revenue Service (IRS) and estimates from the staff of the Joint Committee on Taxation. Historical data for refundable tax credits that are reported on individual tax returns are available through 2009 from IRS, Individual Income Tax Returns, Publication 1304 (various years), and, for 2010, from “SOI Tax Stats - Individual Income Tax Returns Publication 1304 (Complete Report),” www.irs.gov/uac/SOI-Tax-Stats-Individual -Income-Tax-Returns-Publication-1304-(Complete -Report) (December 18, 2012). Historical data for the refundable tax credit for corporations—the prior-year alternative minimum tax credit—are available through 2009 from IRS, “SOI Tax Stats - Corporation Complete Report,” www.irs.gov/uac/SOI-Tax-Stats-Corporation -Complete-Report (November 29, 2012).
Note: The costs of credits that switch from refundable to nonrefundable status (or vice versa) are shown only for the period in which they are refundable.
1975 1984 1993 2002 2011 2020 0 2 4 6 8 10 12 Number in Effect
Total Costs (Billions of 2013 dollars)
1975 1984 1993 2002 2011 2020 0 50 100 150 200 250
government and the burdens imposed on people who are eligible for benefits and on the third parties who might be asked to provide evidence of applicants’ eligibility. Mini-mizing those costs and burdens, then, can be a factor in deciding between the tax system and spending programs as a means to deliver subsidies.
Delivering assistance to low-income families using either approach has advantages and disadvantages. In some cases, it is simpler to distribute assistance to low-income workers through the tax system: Most of those workers already file tax returns to claim refunds of income taxes withheld during the year even if they do not owe any taxes, and they can generally claim a credit by attaching one more form to their return. By comparison, claiming assistance through spending programs can be more time-consuming and intrusive for beneficiaries, especially if they must take time off from work to apply for the benefit in person at a government agency. But spending programs can more easily reach people who do not have to file tax returns and who are already receiving certain benefits from other government agencies. In many instances, caseworkers attached to those programs assist claimants by determining eligibility for them.
The two approaches differ in other ways. Spending pro-grams can be designed to provide assistance as the need arises, whereas people typically file tax returns only once a year, which makes it more challenging to provide timely assistance during the year. Overpayments are gen-erally higher for refundable tax credits than for subsidies operated through spending programs, primarily because the Internal Revenue Service (IRS) cannot verify that applicants meet all eligibility requirements before benefits are paid. However, additional verification steps raise the administrative and compliance costs of spending programs relative to those of the tax system.
Transparency of Refundable Tax Credits
Some analysts have suggested that the scope of federal budgetary commitments is masked because as much as half of the cost of all refundable tax credits (as well as the full costs of other tax preferences) has been recorded as a reduction in revenues, thereby making the budget appear smaller. Moreover, those preferences are not displayed in separate accounts in the budget in the same manner as spending programs. Only the outlay portion of each refundable tax credit is easily identified in the budget in a separate line item. The remaining costs are not presented individually; they are, instead, reflected in the total
amount of revenues recorded. That presentation makes the readily identifiable budgetary costs of refundable tax credits appear smaller than the full costs of those credits. As a result, providing Congressional review and oversight is more difficult for the credits than for spending programs.
The Structure of Tax Preferences
The preferences in the U.S. tax code that reduce or, in some cases, eliminate a taxpayer’s income tax liability can take the form of exclusions, deductions, or credits, each of which affects the calculation of tax liabilities in a different way:
A tax exclusion reduces the amount of income that tax filers report on their tax return.
A tax deduction is an expense that is reported on tax returns and then subtracted from reported income
when calculating taxable income.2
A nonrefundable tax credit offsets an individual’s tax liability, reducing it dollar for dollar.
A refundable tax credit also offsets tax liabilities, but eligible individuals and businesses receive the full amount of the credit even if they do not have any tax to offset. As a result, they receive money back from the government, on net, rather than owing taxes.
Whereas tax credits reduce the amount of taxes owed dollar for dollar, exclusions and deductions reduce tax liabilities by less than the amount reported on the tax return. Because exclusions and deductions lower taxable income, their net impact generally depends on a tax-payer’s marginal tax rate (the rate that applies to the last
2. The tax code gives taxpayers a choice between itemizing deduc-tions for certain specified expenses, such as state and local income taxes and mortgage interest, and claiming the standard deduction, which is a flat dollar amount that does not depend on the actual amount spent. Generally, taxpayers find it more advantageous to itemize deductions if the sum of those deductions is greater than the standard deduction. The standard deduction or itemized deductions are subtracted from adjusted gross income when calcu-lating taxable income. Some deductions—for, example, the one for contributions to an individual retirement account—can be claimed by any eligible taxpayer, even if he or she also claims the standard deduction; such preferences are sometimes referred to as “above-the-line” deductions and are subtracted from total income to compute adjusted gross income.
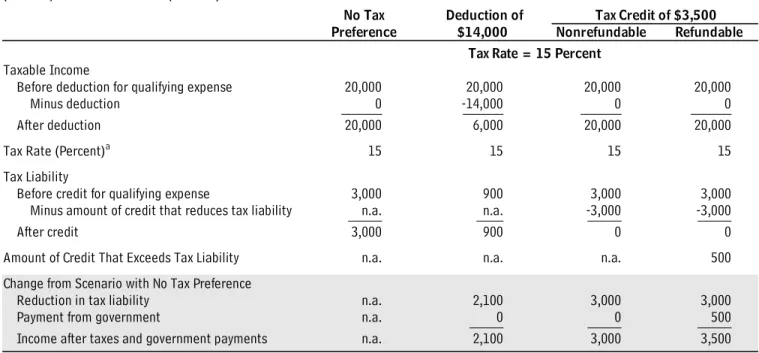
Table 1.
Illustrative Effects of Alternative Tax Preferences on Tax Liabilities
(Dollars, unless otherwise specified)
Continued
dollar of income).3 Hence, as tax rates increase, so does
the value of tax exclusions and deductions. For example, a person who is in the 25 percent tax bracket and deducts payments of $14,000 for, say, home mortgage interest reduces his or her tax liability by $3,500, but that
reduction increases to $4,900 for a homeowner in the 35 percent bracket (see Table 1, which illustrates the effect of tax preferences on the amount of taxes owed). By contrast, a nonrefundable tax credit directly reduces the filer’s income tax liability, meaning that the benefit received is simply equal to the amount of the credit but is not to exceed the filer’s tax liability. Thus, an individual who is in the 25 percent tax bracket and has $14,000 of Taxable Income
Before deduction for qualifying expense 80,000 80,000 80,000 80,000
Minus deduction ______n.a. -14,000______ ______n.a. ______n.a.
After deduction 80,000 66,000 80,000 80,000
Tax Rate (Percent)a 25 25 25 25
Tax Liability
Before credit for qualifying expense 20,000 16,500 20,000 20,000
Minus amount of credit that reduces tax liability ______n.a. ______n.a. ______-3,500 ______-3,500
After credit 20,000 16,500 16,500 16,500
Amount of Credit That Exceeds Tax Liability n.a. n.a. n.a. 0
Change from Scenario with No Tax Preference
Reduction in tax liability n.a. 3,500 3,500 3,500
Payment from government n.a. _____0 _____0 _____0
Income after taxes and government payments n.a. 3,500 3,500 3,500
Taxable Income
Before deduction for qualifying expense 250,000 250,000 250,000 250,000
Minus deduction _______0 _______-14,000 _______0 _______0
After deduction 250,000 236,000 250,000 250,000
Tax Rate (Percent)a 35 35 35 35
Tax Liability
Before credit for qualifying expense 87,500 82,600 87,500 87,500
Minus amount of credit that reduces tax liability ______n.a. ______n.a. ______-3,500 ______-3,500
After credit 87,500 82,600 84,000 84,000
Amount of Credit That Exceeds Tax Liability n.a. n.a. n.a. 0
Change from Scenario with No Tax Preference
Reduction in tax liability n.a. 4,900 3,500 3,500
Payment from government n.a. _____0 _____0 _____0
Income after taxes and government payments n.a. 4,900 3,500 3,500
No Tax
Tax Rate = 35 Percent Tax Rate = 25 Percent Preference $14,000
Deduction of
Nonrefundable Refundable Tax Credit of $3,500
3. As income rises, the value of some tax preferences declines—and is eventually eliminated—because of special phaseout rules. For simplicity, the discussion in this section ignores phaseout rules.
Table 1. Continued
Illustrative Effects of Alternative Tax Preferences on Tax Liabilities
(Dollars, unless otherwise specified)
Source: Congressional Budget Office.
Notes: For simplicity, the amounts of the deduction and tax credits are the same in each set of examples. Taxable income is equal to adjusted gross income, net of deductions and exemptions. Adjusted gross income includes earnings and other taxable income (such as investment income), net of exclusions of some types of income (tax-exempt interest, for example) and certain adjustments. The starting point in the examples assumes that all deductions and exemptions—other than the tax preference for the illustrative qualifying expense—have already been subtracted from adjusted gross income.
n.a. = not applicable.
a. For simplicity, the same tax rate is assumed to apply to the entire amount of the individual’s income.
mortgage interest payments would generally benefit equally from a $3,500 tax credit (for example, a credit equal to 25 percent of mortgage interest) or a deduction of the full amount of those interest payments.
Unlike the value of exclusions and deductions, the dollar value of a nonrefundable tax credit is not affected by one’s income and tax bracket, as long as the person’s tax liabil-ity (before the credit) is greater than the amount of the credit. As a result, a person in the 35 percent bracket would prefer a $14,000 deduction to a $3,500 tax credit because the deduction would provide that person with $1,400 more in tax benefits than would the credit. The value of exclusions, deductions, and nonrefundable tax credits is limited, however, by the amount of taxes a person owes. People generally do not have any income tax liability (before credits) if their income is below a certain
amount—about $27,100 for a family with two children (or about 120 percent of the federal poverty guideline for a family that size) and about $9,800 for an individual with no children (about 90 percent of the poverty
guide-line for a one-person family) in 2012.4 A person who is
eligible for a $3,500 nonrefundable credit and owes the IRS $3,000 in income taxes can claim the credit only up to the amount equaling his or her tax liability—in this case, $3,000 (see, for example, the person in the 15 percent tax bracket in Table 1).
Refundable tax credits differ from other tax preferences in that their value may exceed the amount of income taxes the filer owes. The person in the previous example Taxable Income
Before deduction for qualifying expense 20,000 20,000 20,000 20,000
Minus deduction ______0 -14,000______ ______0 ______0
After deduction 20,000 6,000 20,000 20,000
Tax Rate (Percent)a 15 15 15 15
Tax Liability
Before credit for qualifying expense 3,000 900 3,000 3,000
Minus amount of credit that reduces tax liability _____n.a. ____n.a. -3,000_____ -3,000_____
After credit 3,000 900 0 0
Amount of Credit That Exceeds Tax Liability n.a. n.a. n.a. 500
Change from Scenario with No Tax Preference
Reduction in tax liability n.a. 2,100 3,000 3,000
Payment from government n.a. _____0 _____0 _____500
Income after taxes and government payments n.a. 2,100 3,000 3,500
Preference $14,000 Nonrefundable Refundable Tax Rate = 15 Percent
No Tax Deduction of Tax Credit of $3,500
4. The income tax thresholds in this example reflect the standard deduction and personal exemptions (for taxpayers and their dependents) available to each family or individual in 2012.
(eligible for a $3,500 credit and owing $3,000 in income taxes) could claim the full $3,500 if the credit was refundable, even though that amount exceeded (by $500) the amount of taxes owed. In that case, on net, the gov-ernment would pay the individual rather than the other way around. Lawmakers sometimes place limits on the amount of the credit a person can receive if he or she does not have any income tax liability; in those instances, the credits are referred to as partially refundable.
Costs of Refundable Tax Credits
The first refundable credit was established in 1975, and the number of those credits began increasing in 1998; 11 different credits were in place in 2010. The costs of refundable tax credits peaked in 2008 but declined over the next four years because of the expiration of several credits designed to provide temporary economic stimu-lus. Costs will begin to climb again after 2013, CBO projects, and, by 2017, they will be about the same ($238 billion) as in 2008 (see Figure 2). In 2018, when several credits are scaled back or eliminated, costs will fall by more than 10 percent, and, for the remainder of the decade, they will hover around $210 billion—about the same as the cost in 2010, even though only four refundable credits will be in effect after 2017.
Sharp Increase in Costs from 1975 to 2010
The first refundable tax credit—the earned income tax credit—was introduced in 1975 and had a total budget-ary cost in that year of nearly $5 billion. That cost included both the reduction in revenues (the portion of the credit used to reduce tax liability) and the increase in outlays (the portion of the credit that exceeds tax liabili-ties and is paid to the taxpayer). The costs of refundable tax credits reached $109 billion in 2007 and then shot up to $238 billion in 2008, when eight such credits were in effect. By 2010, the total cost had dropped to about $209 billion—still nearly twice the cost in 2007. The surge in the number and cost of refundable credits between 2007 and 2010 occurred largely because of the recession, which led to the enactment of temporary new
credits and the expansion of existing ones.5 Although the
number of credits increased from 2008 to 2010, their costs were greater in 2008 largely because of the one-time economic stimulus payments that were enacted in the Economic Stimulus Act of 2008 (which defined them as refundable tax credits) and were received by most taxpayers in that year (see Figure 3).6
In 1975, over two-thirds of the credits’ costs was from the refundable portion of the credits (the amount by which credits exceed tax liabilities) and thus was counted in the federal budget as an outlay. That share peaked at 80 per-cent in 1996 after the value of the EITC, which is directed toward lower-income workers, was substantially increased in the Omnibus Budget Reconciliation Act of 1993 (referred to in this report as the 1993 reconciliation act). It then fell to about 50 percent in 2008 after enact-ment of the economic stimulus payenact-ments, which, like the EITC, provided assistance to workers but which extended eligibility for that credit to people who had higher income and were more likely to owe taxes before taking that credit.
Declining Costs from 2010 to 2013
Most of the expansions of the credits that were enacted after 2007, along with temporary reductions in the individual income tax rates and other tax cuts, were scheduled to expire by the end of 2010. The Tax Relief, Unemployment Insurance Reauthorization, and Job Creation Act of 2010 (referred to in this report as the 2010 tax act) extended most of those tax provisions (along with the credit expansions enacted in the Eco-nomic Growth and Tax Relief Reconciliation Act of 2001) for two more years; the American Taxpayer Relief Act of 2012 extended those provisions for at least five more years. However the 2010 act allowed other credits, such as the Making Work Pay credit, to expire (see Figure 4 on page 9).
5. Recessions affect the costs of refundable tax credits even in the absence of legislation that expands the scope of the credits. How-ever, those effects are not easy to identify because recessions affect eligibility for credits in two different directions. Declines in income make some people, whose income was previously above the cutoff for a credit, eligible for certain credits. However, other people will no longer qualify for a credit because, for example, their earnings drop to zero (in the case of the earned income tax credit) or they can no longer afford (even with a subsidy) the item that is favored by the tax incentive.
6. Most people received the credit in 2008 on the basis of informa-tion provided on their 2007 tax returns. Taxpayers who did not file 2007 tax returns had a second opportunity to receive the eco-nomic stimulus payment: They could claim the credit on their 2008 tax returns. (The credit was referred to as a “recovery rebate” on the 2008 return.) In this analysis, CBO counted the credits received in 2008 and in 2009 as offsets to 2008 tax liabilities.
Figure 2.
Costs of Refundable Tax Credits and the Key Legislation That Affected Them,
Calendar Years 1975 to 2021
(Billions of 2013 dollars)
Sources: Congressional Budget Office based on data from the Internal Revenue Service (IRS) and estimates from the staff of the Joint Committee on Taxation. Historical data for refundable tax credits that are reported on individual tax returns are available through 2009 from IRS, Individual Income Tax Returns, Publication 1304 (various years), and, for 2010, from “SOI Tax Stats - Individual Income Tax Returns Publication 1304 (Complete Report),” www.irs.gov/uac/SOI-Tax-Stats-Individual-Income-Tax-Returns -Publication-1304-(Complete-Report) (December 18, 2012). Historical data for the refundable tax credit for corporations—the prior-year alternative minimum tax credit—are available through 2009 from IRS, “SOI Tax Stats - Corporation Complete Report,”
www.irs.gov/uac/SOI-Tax-Stats-Corporation-Complete-Report (November 29, 2012).
Notes: In the federal budget, the portion of refundable credits that is used to reduce the amount of taxes owed is counted as a reduction in revenues, and the portion that exceeds tax liabilities (the refundable portion) is treated as an outlay.
The costs of credits that switch from refundable to nonrefundable status (or vice versa) are shown only for the period in which they are refundable. The American Opportunity Tax Credit is refundable from 2009 to 2017 and nonrefundable (as the Hope credit) before and after those years. The prior-year alternative minimum tax credit for individuals was refundable from 2007 to 2012 and nonrefundable before and after. The adoption tax credit was refundable in 2010 and 2011 and nonrefundable before and after. EITC = earned income tax credit; CTC = child tax credit.
By the beginning of 2013, five of the refundable tax credits that were available in 2010 had expired. Hence, according to CBO’s projections, the budgetary costs of refundable tax credits will drop from $209 billion in
2010 to $149 billion in 2013.7 Because most of that
decline in costs will be reflected in the budget as a smaller
reduction in revenues, the share of total costs recorded as outlays will rise from 54 percent to 65 percent. That out-come is due largely to the expiration of the Making Work Pay credit, which was available to higher-income people who owe taxes. The EITC will be the largest remaining refundable tax credit; its budgetary costs will total an esti-mated $68 billion in 2013, of which $60 billion will be payments that exceed tax liabilities and will be recorded in the budget as outlays.
1975 1980 1985 1990 1995 2000 2005 2010 2015 2020 0 50 100 150 200 250 0 50 100 150 200 250 1987–1996 1975
EITC takes effect
1998 CTC takes effect 2001–2003 CTC and EITC increased and expanded 2008–2009 OTemporary economic stimuluspayments and
Making Work Pay credit enacted
ONew credits for housing and education created OCTC and EITC increased and expanded 2014 Premium assistance tax credit takes effect Reduction in Revenues EITC increased and expanded Total 2011 Temporary stimulus payments and
Making Work Pay credit no longer in effect 2018 Expansions from 2009 no longer in effect Outlays
7. CBO’s projections incorporate the effects of the American Taxpayer Relief Act of 2012.
Figure 3.
Costs of Refundable Tax Credits, Calendar Years 2007, 2008, and 2010
(Billions of 2013 dollars)
Source: Congressional Budget Office based on data from Internal Revenue Service (IRS). Historical data for refundable tax credits that are reported on individual tax returns are available through 2009 from IRS, Individual Income Tax Returns, Publication 1304 (various years), and, for 2010, from “SOI Tax Stats - Individual Income Tax Returns Publication 1304 (Complete Report),” www.irs.gov/uac/ SOI-Tax-Stats-Individual-Income-Tax-Returns-Publication-1304-(Complete-Report) (December 18, 2012). Historical data for the refundable tax credit for corporations—the prior-year alternative minimum tax credit—are available through 2009 from IRS, “SOI Tax Stats - Corporation Complete Report,” www.irs.gov/uac/SOI-Tax-Stats-Corporation-Complete-Report (November 29, 2012). Note: In the federal budget, the portion of refundable credits that is used to reduce the amount of taxes owed is counted as a reduction in
revenues, and the portion that exceeds tax liabilities (the refundable portion) is treated as an outlay.
Rising Costs After 2013
That drop in the total cost of refundable credits will be partially reversed when the refundable tax credit for health insurance premiums, enacted in 2010 in the
Affordable Care Act, takes effect in 2014.8 Low- and
moderate-income individuals and families will become eligible for refundable tax credits that reduce the cost of health insurance purchased through the new health
insur-ance exchanges.9 CBO and JCT estimate that the credit
will add $35 billion to the costs of all credits in 2014 (see Table 2).
The total costs of refundable tax credits will continue to climb through 2017, when they will reach a high of $238 billion—about the same as the previous peak in 2008. However, those costs will fall in 2018 when the American Opportunity Tax Credit expires and the child tax credit and the EITC are scaled back.
In 2021, the refundable tax credit for health insurance premiums will be the largest refundable tax credit. CBO and JCT estimate that the credit will cost $110 billion in that year, about three-quarters of which will be attribut-able to an increase in outlays. As a result, CBO estimates,
Other American Opportunity Tax Credit Making Work Pay Credit Child Tax Credit Earned Income Tax Credit Other Economic Stimulus Payments Child Tax Credit Earned Income Tax Credit Other Child Tax Credit Earned Income Tax Credit
0 20 40 60 80 100 120
Outlays Reduction in Revenues
2007
2010 2008
8. The Affordable Care Act refers to the Patient Protection and Affordable Care Act, the amendments made to the law by the Health Care and Education Reconciliation Act, and related legis-lative changes since those laws were enacted. In addition to the credits for health insurance premiums, the Affordable Care Act also established a tax credit for small businesses that took effect in 2010.
9. Health insurance exchanges will be established to link people with insurance plans and to enroll eligible applicants in qualifying health insurance plans. The exchanges will also play a substantial role in administering the refundable tax credits for health insurance premiums.
Figure 4.
Years in Which Tax Credits Are Refundable
Source: Congressional Budget Office.
Notes: Date labels refer to the beginning of the calendar year. Most refundable credits took effect on January 1 and expired on December 31 of the applicable year. For credits that took effect or expired on different dates, see Table A-1.
COBRA = Consolidated Omnibus Budget Reconciliation Act.
a. The original legislation also allowed corporations to claim a refundable research credit under certain circumstances. That provision expired on December 31, 2009.
the costs of refundable tax credits will total $213 billion in 2021—roughly the same amount as in 2010, when the tax code contained seven more refundable tax credits. The proportion of those costs categorized as outlays will rise from 65 percent in 2013 to an estimated 71 percent in 2021. None of the refundable tax credits that will be available in 2021 are scheduled to expire.
The Evolution of
Refundable Tax Credits
The nature of refundable tax credits has evolved during the past decade. Initially, only workers who resided with children were eligible for the EITC, and the amount of the credit was tied to earnings. Since 1975, lawmakers have increased the amount of the EITC and extended eligibility to workers farther up the income scale and to those who do not live with children. In addition, more credits have been created, most of which are linked to expenditures on specific goods or services rather than
to earnings, and one of the newer credits is available to certain types of businesses rather than to individuals or families (see the appendix).
Earnings-Based Credits
The enactment of the earned income tax credit in 1975 signaled a change in federal tax policy: People could receive benefits through the tax system even if those benefits exceeded the amount of taxes they owed. The concept of a refundable tax credit, however, was not new. The merits and disadvantages of a negative income tax, which would have provided low-income families with a grant (or guaranteed payment) through the tax system even if they did not owe any income taxes, were debated during the 1960s. The amount of such a grant would be smaller for people with higher income. At a certain income level, the grant would be eliminated, and a family would be required to pay the full tax. Although such a program would have provided support for low-income families, some lawmakers were concerned that the
1975 1980 1985 1990 1995 2000 2005 2010 2015 2020
Premium Assistance Tax Credit
Small Business Health Care Tax Credit
Adoption Tax Credit
Making Work Pay Credit American Opportunity Tax Credit First-Time Homebuyer Credit COBRA Premium Assistance Credit Economic Stimulus Payments Prior-Year Alternative Minimum Tax Credit—Corporationsa Prior-Year Alternative Minimum Tax Credit—Individuals
Health Coverage Tax Credit Child Tax Credit
Table 2.
Costs of Refundable Tax Credits in Calendar Years 2013, 2014, and 2021
(Billions of 2013 dollars)
Source: Congressional Budget Office based on estimates from the staff of the Joint Committee on Taxation. Note: * = between zero and $500 million.
promise of a guaranteed payment would discourage some
people from working.10
The EITC established a different model for targeting assistance toward low-income families through the tax system. Unlike the negative income tax, the EITC was available only to people who were employed at some point during the year. Moreover, the credit—which rose by 10 cents for each dollar of earnings—effectively com-pensated workers for most of the additional payroll taxes
they and their employers would pay on added earnings.11
In that way, the credit was designed to offset the work disincentives created by the payroll tax.
But another feature of the EITC had an opposing effect on people’s decisions to work. When it was established, the amount of the credit began to fall once it reached a maximum of $400 a year; the decline in the amount of the credit as income rose, after a certain point, boosted the marginal tax rate on added earnings. In addition, the credit was limited to workers who lived with children
(who met certain age, relationship, and residency tests); that limit was imposed because of concerns that such people faced larger hurdles to work—such as the incen-tives to work less embedded in welfare programs—than
did other low-income people.12
Since 1975, the credit rates for workers with children have increased, keeping pace, at times, with the rise in payroll tax rates during the 1980s. Provisions in the Omnibus Budget Reconciliation Act of 1990 expanded the EITC by increasing the credit rate above the rate for payroll taxes and, for the first time, setting the credit at a higher rate for workers with two or more children. The 1993 reconciliation act further increased and expanded the credit, especially by boosting the amount received by larger families. With those changes, the goals of the EITC included assisting families with the costs of raising chil-dren and reducing poverty among full-time workers. Concern about the impact of higher gasoline taxes on low-income workers led to the addition of a small credit under the 1993 reconciliation act for workers who did not live with children.
The EITC remained the only refundable credit in the federal tax code until the child tax credit was enacted in 1997 in the Taxpayer Relief Act, allowing eligible families to claim a tax credit of up to $400 (rising to $500 in Credit
Earned Income Tax Credit 68 68 61
Child Tax Credit 57 57 40
Health Coverage Tax Credit * 0 0
Prior-Year Alternative Minimum Tax Credit—Corporations * 0 0
American Opportunity Tax Credit 21 21 0
Small Business Health Care Tax Credit 2 3 2
Premium Assistance Tax Credit ___0 ___35 ____110
Total 149 184 213
2013 2014 2021
10. See Dennis J. Ventry Jr., “The Collision of Tax and Welfare Politics: The Political History of the Earned Income Tax Credit,” in Bruce D. Meyer and Douglas Holtz-Eakin, eds., Making Work Pay: The Earned Income Tax Credit and Its Impact on America’s Families (Russell Sage Foundation, 2002), pp. 15–66,
www.russellsage.org/publications/making-work-pay.
11. At that time, employees and employers each paid 5.85 percent of earnings in Social Security and Medicare taxes, for a combined rate of nearly 12 percent. Economists generally agree that the employer’s share of the payroll tax is passed on to workers in the form of lower wages.
12. See House Committee on Ways and Means, Tax Reduction Act of 1975, Report 94-19 (February 25, 1975); and Senate Committee on Finance, Tax Reduction Act of 1975, Report 94-36 (March 12, 1975).
1999) for each dependent under the age of 17.13 The
credit was reduced—and eventually phased out— once income exceeded $75,000 for single people and $110,000 for married couples filing jointly. Unlike the EITC, the child tax credit was not fully refundable. Specifically, lawmakers reinforced the link between refundable tax credits and payroll taxes by limiting the refundable amount (referred to in the tax code as the additional child tax credit) to the employee’s share of Social Security and Medicare payroll taxes that had not been offset by the EITC. Only taxpayers with three or more children qualified for the additional amount. A series of tax acts, beginning with the Economic Growth and Tax Relief Reconciliation Act of 2001 (EGTRRA), expanded the child tax credit and the EITC. By 2004, the child tax credit had increased to $1,000 for each qualify-ing child, and all filers—includqualify-ing those with one or two children—were allowed to receive a payment from the government for the portion of the credit that was not used to offset income taxes. The amount of that payment was 15 percent of earned income in excess of a threshold ($10,750), up to the maximum credit of $1,000 per child. Some married couples also benefited from an increase in the EITC.
The American Recovery and Reinvestment Act of 2009 (ARRA) further expanded the two earnings-based credits. ARRA reduced the earned income threshold for the child tax credit to $3,000, thus increasing the number of
eligi-ble workers.14 Also in 2009, the EITC was increased
again for some married couples, and workers with three or more children were allowed a larger credit than those with smaller families. In 2013, the maximum EITC
ranges from $487 for a worker who either has no children or who does not live with his or her children to $6,044 for a worker who lives with three or more children; families with income of up to nearly $52,000 are eligible for at least a portion of the credit.
Like other provisions originally enacted in EGTRRA and ARRA, the expansions and increases of the child tax credit and the EITC were initially scheduled to expire on December 31, 2010, but the 2010 tax act extended them for two more years. Under the American Taxpayer Relief Act of 2012, the changes to the credits that were enacted in EGTRRA became permanent features of the tax code. However, the 2012 act extended the ARRA provisions only through the end of 2017.
Intended to bolster the economy during the recent reces-sion, the Economic Stimulus Act of 2008 and ARRA in 2009 created temporary refundable tax credits that were linked to earnings: respectively, economic stimulus payments in 2008 (which were defined by law to be refundable tax credits) and the Making Work Pay credit (in effect in 2009 and 2010). The maximum stimulus payment for single filers was set at $300 in 2008; single filers could receive a Making Work Pay credit of up to
$400 in the following two years.15 (The maximum
amount of the credits for married couples filing jointly was twice that of single filers.) Under both acts, the new credits gradually phased out as income rose, beginning at $75,000 for single filers and $150,000 for joint filers. Those credits were not extended beyond their scheduled expiration (at the end of 2008 for the economic stimulus payments and at the end of 2010 for the Making Work Pay credit), leaving only two earnings-based refundable credits in effect in 2013—the EITC and the child tax credit.
13. The child tax credit differed from the EITC in that the child initially did not have to live with the taxpayer to qualify him or her for the child tax credit. The American Jobs Creation Act of 2004 consolidated the rules for claiming children for the two tax credits by establishing similar residency and relationship tests for child-related tax benefits. The definitions, however, are still not uniform. The parent who does not live with his or her young child, for example, can receive the child tax credit if the custodial parent waives his or her right to do so. However, only the custodial parent can claim that child to receive the EITC. 14. The threshold was originally adjusted for changes in the cost of
living each year. When such an adjustment is made, the number of people eligible for the refundable portion of the credit drops if earnings grow more slowly than consumer prices. ARRA elimi-nated the cost-of-living adjustment, which further contributed to an increase in the number of eligible workers.
15. The 2008 economic stimulus payments differed from the Making Work Pay credit in several other ways. First, the economic stimu-lus legislation provided a larger nonrefundable credit to taxpayers (including those who did not have any earnings) who had a posi-tive income tax liability before the credit: In those instances, the maximum amount of the credit was $600 if single and $1,200 if married and filing jointly. Second, the 2008 payments were $300 higher for each qualifying child under the age of 17. Another dif-ference—and a departure from previous earnings-based credits— was the extension of the 2008 economic stimulus payments to people who were not currently in the workforce but who received Social Security or veterans’ benefits. A similar subsidy was provided by ARRA, but those payments were generally made by agencies other than the IRS.
Expenditure-Based Tax Credits
As the number of refundable tax credits has increased, their nature has changed, especially since 2008. Refund-able tax credits have become more restrictive in some ways and more expansive in others. Unlike the earlier credits, which provided cash assistance without any restrictions on how those funds were used, many of the newer refundable tax credits are available to low- and moderate-income people who purchase a particular type of good or service (such as health insurance), regardless of whether they work.
The first major step toward expenditure-based credits was a supplement to the EITC, enacted in 1990, that covered a portion of the costs of health insurance for
children whose parents worked.16 The size of that
supple-ment, however, was—like the basic EITC—largely determined by the worker’s earnings and adjusted gross income but was capped at the lesser of the cost of the insurance or $428. (In this report, the costs of the supple-ment are included in the total costs of the EITC and other earnings-based credits.)
Although that supplemental credit was repealed in 1993, four other refundable tax credits have since been enacted to subsidize the costs of health insurance:
The health coverage tax credit, which took effect in
2002, for households who are eligible for trade adjust-ment assistance (the federal program that provides income support, training, and employment services to workers who have lost their job because of trade with foreign countries) or who have a pension plan that has been taken over by the Pension Benefit Guaranty Corporation;
The COBRA (Consolidated Omnibus Budget
Reconciliation Act) premium assistance credit, which
took effect in 2008, for workers who lost their job between September 2008 and May 2010;
The small business health care tax credit, which took
effect in 2010 and which covers a portion of small businesses’ payments for their employees’ health insurance; and
The premium assistance tax credit, which will take
effect in 2014 and will subsidize the purchase of health insurance for some people through the newly established insurance exchanges.
In addition, several of the newer credits are related to other expenses incurred by families, such as the costs of buying a home (the first-time homebuyer credit), college tuition (the American Opportunity Tax Credit), and adoption fees.
In 2010, 8 of the 11 refundable credits were linked to expenditures, but those 8 credits represented only about 11 percent of the outlays attributable to refundable cred-its. Over the next decade, however, the cost of credits based on expenditures will grow much faster than the cost of those based on earnings, CBO estimates, and, by 2021, they will account for 55 percent of outlays for refundable tax credits (see Figure 5).
Nearly all of that growth will be due to the newly enacted credit for health insurance purchased through exchanges, beginning in 2014. Most people who purchase health insurance through an exchange will receive a refundable tax credit for their premiums as a result of the Affordable
Care Act.17 To qualify, individuals and families must have
income between 100 percent and 400 percent of the fed-eral poverty guideline. Genfed-erally, people who are eligible for employment-based health insurance, Medicare, or Medicaid will not be able to claim the credit. The credit will equal the difference between a reference premium and a specified percentage of income, initially ranging
16. Before 1990, the tax code contained a very small expenditure-based tax credit that was refundable for just one year. The Energy Tax Act of 1978 allowed businesses, beginning in 1979, to claim a refundable tax credit for investments in solar or wind property (equipment that uses solar or wind energy to heat or cool, to pro-vide hot water, or to generate electricity). Few businesses claimed the refundable portion of the credit, however, and the cost of the refundable portion was less than $50 million in 1979. The credit was made nonrefundable in 1980 and is not counted among the refundable credits in this report.
17. In addition, individuals and families with income between 100 percent and 250 percent of the federal poverty guideline who purchase insurance through an exchange will be eligible for cost-sharing assistance to reduce their out-of-pocket costs. Unlike premium assistance credits, those subsidies will not be provided through the tax system.
Figure 5.
Outlays for Earnings-Based and
Expenditure-Based Refundable Tax
Credits, Calendar Years 1975 to 2021
(Billions of 2013 dollars)
Sources: Congressional Budget Office based on data from the Internal Revenue Service (IRS) and estimates from the staff of the Joint Committee on Taxation. Historical data for refundable tax credits that are reported on individual tax returns are available through 2009 from IRS, Individual Income Tax Returns, Publication 1304 (various years), and, for 2010, from “SOI Tax Stats - Individual Income Tax Returns Publication 1304 (Complete Report),” www.irs.gov/uac/SOI-Tax-Stats-Individual -Income-Tax-Returns-Publication-1304-(Complete -Report) (December 18, 2012). Historical data for the refundable tax credit for corporations—the prior-year alternative minimum tax credit—are available through 2009 from IRS, “SOI Tax Stats - Corporation Complete Report,” www.irs.gov/uac/SOI-Tax-Stats-Corporation -Complete-Report (November 29, 2012).
Notes: In the federal budget, the portion of refundable credits that exceeds tax liabilities is treated as an outlay. The portion of those credits that reduces the amount of taxes owed is counted as a reduction in revenues. This figure shows only the outlay amounts.
The costs of credits that switch from refundable to nonrefundable status (or vice versa) are shown only for the period in which they are refundable. The American Opportunity Tax Credit is refundable from 2009 to 2017 and nonrefundable (as the Hope credit) before and after those years. The adoption tax credit was refundable in 2010 and 2011 and nonrefundable before and after.
from 2.0 percent to 9.5 percent.18 Only two other
expenditure-based refundable tax credits will remain after 2013—the small business health care tax credit and the American Opportunity Tax Credit. The latter credit, however, has been extended only through 2017.
Credits Related to the Alternative Minimum Tax
Some of the more recent credits have extended eligibility
in new directions.19 Two refundable credits were extended
to individuals and businesses that paid the alternative minimum tax (AMT) in earlier years. Under the AMT, federal tax liability is computed differently than it is under the regular tax because the AMT allows a more limited set of deductions and tax credits; taxpayers pay the higher of their regular tax or the AMT. One example of the difference between the two taxes is that taxpayers can defer income taxes on some forms of income solely under the regular tax. However, AMT liabilities that result from the deferral provisions generate a nonrefund-able tax credit (known as the prior-year alternative minimum tax credit) that taxpayers can apply to the regular income tax they owe in a future year in which they are not subject to the AMT. The Tax Relief and Health Care Act of 2006 allowed individuals to claim a portion of their unused prior-year AMT credits as a refundable credit from 2007 through 2012. A similar refundable credit was extended to corporations by the Housing and Economic Recovery Act of 2008. That credit will expire at the end of 2013.
Effects of Refundable Tax Credits
Refundable tax credits, like other tax preferences, affect individuals and the economy in several ways. Economists generally evaluate the effects of taxes and tax preferences according to three criteria:
1975 1984 1993 2002 2011 2020 0 20 40 60 80 100 120 Earnings-Based Expenditure-Based
18. The exchanges will group health plans into four tiers labeled “bronze,” “silver,” “gold,” and “platinum.” Each tier will cover a specified set of benefits, paying (on average) 60 percent, 70 per-cent, 80 perper-cent, or 90 perper-cent, respectively, of a beneficiary’s claims. The reference premium is the cost of the silver plan with the second-lowest cost in the locality. For more information, see Congressional Budget Office, Additional Information About CBO’s Baseline Projections of Federal Subsidies for Health Insurance Pro-vided Through Exchanges(May 2011), www.cbo.gov/publication/ 41464.
19. Another development since 2008 was the creation of “bond cred-its.” The prototype (and, with costs of $3 billion a year, the largest by far) was the Build America Bond program created by ARRA. Under that program, state and local governments receive direct payments from the federal government to reimburse them for the amounts they pay to holders of certain types of bonds. Although the credits are defined in the tax code as refundable, they are iden-tical to other federal grants to state governments. For that reason, bond credits are not discussed in this report.
Economic efficiency—how taxes affect the allocation of resources in the economy;
Equity—how tax burdens are distributed among
households that have varying demographic and economic characteristics; and
Simplicity of the tax system—what the costs are of
complying with and administering taxes.
Effects on Economic Efficiency
Refundable tax credits influence people’s decisions about whether to work, to purchase health insurance, to enroll in college, or even to adopt a child. In some cases, the credits reduce economic efficiency—the extent to which resources are allocated in a manner that maximizes their value—by shifting resources away from more productive activities toward less productive ones or by discouraging people from seeking work; in other instances, they boost efficiency by offsetting the work disincentives embedded in other tax provisions or in spending programs.
By reducing the after-tax costs of particular goods and services, expenditure-based credits accomplish certain goals of lawmakers, but such credits can also contribute to an inefficient allocation of economic resources (by encouraging more consumption of goods receiving pref-erential treatment or by subsidizing activities that would have taken place without the tax incentives). The tempo-rary first-time homebuyer credit, for example, probably encouraged some people to buy a more expensive house than they would have otherwise. In some instances, people would have engaged in the tax-favored activity even without a credit. Therefore, allowing taxpayers to claim a credit results in a large loss of federal revenue rela-tive to the increase in the subsidized activity. Such effects are not unique to refundable tax credits. Other types of tax preferences, such as the itemized deduction for mort-gage interest, also encourage taxpayers to acquire more of those preferred items in some instances than they would have without the preferences.
Credits that are linked to earnings include some features that improve the allocation of resources and some that have the opposite effect. The EITC, for example, was designed to offset work disincentives caused by payroll taxes or by the income limits in public assistance programs delivered by government agencies other than
the IRS. The credit encourages work in two ways: By raising the take-home pay of all recipients, the credit encourages people to enter the workforce, and by initially increasing as earnings rise, the credit boosts workers’
incentives to earn more.20 But to ensure that the credit
targets people with low and moderate income, it begins to phase out as income rises above a certain threshold. For people in the phaseout range, that reduction in the amount of the credit generally provides an incentive to work less (see Figure 6).21
Researchers have found that the EITC, on net, effectively encourages work, especially among single mothers who previously were neither employed nor actively looking for a job. One study found that more than 60 percent of the increase of 9 percentage points in the employment of single mothers between 1984 and 1996 was due to
expansions of the EITC over that period.22 Another study
20. That second feature of the credit—the increase in its value as earnings initially rise—also has the potential to reduce employees’ incentive to work: Employees may respond to the increase in their after-tax income by working less (a response that economists refer to as the income effect). Researchers, however, generally find that the substitution effect—the incentive to work harder as after-tax wages rise—has a greater impact than the income effect. See Robert McClelland and Shannon Mok, A Review of Recent Research on Labor Supply Elasticities, Congressional Budget Office Working Paper 2012-12 (October 2012), www.cbo.gov/ publication/43675.
21. Other earnings-based credits have some or all of the same features as the EITC and thus also affect marginal tax rates. The child tax credit, for example, increases as earnings rise, up to the maximum of $1,000 per child. Like the EITC, the child tax credit reduces marginal tax rates in its phase-in range. Also like the EITC, at higher income levels the child tax credit is gradually reduced, causing marginal tax rates to increase as the credit is phased out. The two credits, however, differ in the beginning points of the phase-in and phaseout ranges. Whereas the EITC begins to phase in with the first dollar of earnings, taxpayers do not receive any child tax credit until they have earned at least $3,000. Moreover, the EITC begins to phase out when income reaches $37,870 for a single parent with one child, but such a parent would be eligible to receive the maximum child tax credit until his or her income was more than $75,000. See Congressional Budget Office, Effec-tive Marginal Tax Rates for Low- and Moderate-Income Workers
(November 2012), www.cbo.gov/publication/43709.
22. See Bruce D. Meyer and Dan T. Rosenbaum, “Welfare, the Earned Income Tax Credit, and the Labor Supply of Single Mothers,” Quarterly Journal of Economics, vol. 116, no. 3 (2001), pp. 1063–1114, http://qje.oxfordjournals.org/content/116/3/ 1063.abstract.
Figure 6.
The Earned Income Tax Credit for a
Single Parent with One Child, 2013
(Dollars)
Source: Congressional Budget Office.
concluded that the credit’s expansions during the 1990s might be the policies most responsible for the increase in employment and earnings among single mothers—even more than the substantial changes to public assistance programs at the federal and state levels that occurred
during that decade.23
Tax preferences, including deductions and refundable credits, could boost efficiency under other circumstances too. Certain activities, such as the work of charitable organizations, have widespread public benefits. However, people do not always place the appropriate value on those “external” benefits to society, and that can lead—under certain conditions—to a misallocation of resources that can be remedied, at least in part, by the availability of tax preferences. Some analysts have argued that a uniform refundable credit (one that has a flat amount, regardless of income) is preferable to other tax preferences (such as the itemized deduction for charitable contributions) if the purpose of the subsidy is to change behavior. That argument is strongest in cases in which low-income
people are as likely to respond to the incentives as are
those with higher income.24
Effects on Equity
Refundable tax credits, like other tax preferences, affect the distribution of tax burdens among households with different income. In addition, credits targeted toward specific populations alter the relative tax burden of households who have the same before-tax income but who differ in other ways (such as the number of children in the household).
Refundable tax credits differ in the range of income over which eligibility extends. For example, people qualify for the EITC as soon as they receive a paycheck, but they become ineligible when their income exceeds a threshold that, in 2013, is as high as $51,567 (for a couple residing with three children). To claim the refundable portion of the child tax credit, parents must have at least $3,000 of earnings, but eligibility for that credit extends much higher up the income scale than does eligibility for the EITC. Married couples who have three children remain eligible for the child tax credit until their income reaches $170,000—over three times the cutoff for the EITC. Because of those different income tests, the distribution of credits among households varies. In 2012, households in the lowest income quintile received a greater share of the total EITC (51 percent) than of the child tax credit
(22 percent), CBO estimates.25 Conversely, households in
the top three income quintiles received a larger share of the child tax credit—48 percent of that credit compared with 20 percent of the EITC.
Largely as a result of the recession and the related temporary refundable tax credits (the economic stimulus payments and the Making Work Pay credit), the average individual income tax rate, according to CBO estimates, has been negative in recent years among households in the bottom two income quintiles (that is, the bottom 40 percent of the income distribution). People in those
23. See Jeffrey Grogger, “The Effects of Time Limits, the EITC, and Other Policy Changes on Welfare Use, Work, and Income Among Female-Headed Families,” Review of Economics and Statistics, vol. 85, no. 2 (May 2003), pp. 394–408.
0 10,000 20,000 30,000 40,000 0 500 1,000 1,500 2,000 2,500 3,000 3,500 Parent's Earnings Credit rises as earnings increase Credit amount
does not change Credit falls as earnings increase Credit Amount
24. See Lily L. Batchelder, Fred T. Goldberg Jr., and Peter R. Orszag, “Efficiency and Tax Incentives: The Case for Refundable Tax Credits,” Stanford Law Review, vol. 59, no. 23 (2006), pp. 23–76.
25. Quintiles, or fifths, are created by ranking households by their before-tax income. Quintiles contain equal numbers of people. A household consists of the people who share a housing unit, regardless of their relationship.