TABLE OF CONTENTS
FOREWORD BY THE EXECUTIVE AUTHORITY... 4
STATEMENT BY THE HEAD OF DEPARTMENT ... 9
OFFICIAL SIGN-OFF: KZN DEPARTMENT OF HEALTH 2014/15 - 2016/17 ANNUAL PERFORMANCE PLAN ... 11
1. STRATEGIC OVERVIEW ... 14
1.1 VISION, MISSION AND VALUES ... 14
1.2 KWAZULU-NATAL STRATEGIC GOALS 2014 - 2019 ... 15
1.3 SITUATIONAL ANALYSIS ... 17
1.3.1 Demographic Profile ... 17
1.3.2 Socio-Economic Profile ... 19
1.3.3 Epidemiological Profile/ Burden of Disease ... 20
1.4 organisational environment ... 24
1.5 PROVINCIAL SERVICE DELIVERY ENVIRONMENT ... 30
1.6 LEGISLATIVE MANDATES AND NEW POLICY INITIATIVES ... 33
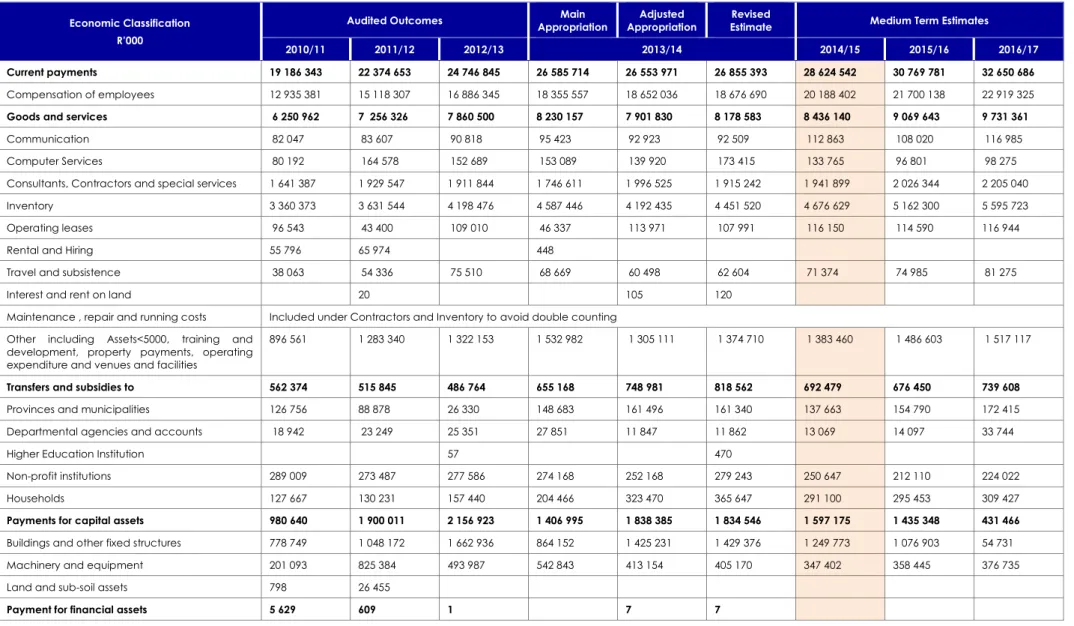
1.7 OVERVIEW OF THE 2013/14 BUDGET AND MTEF ESTIMATES ... 34
1.7.1 Expenditure Estimates ... 36
1.7.2 Relating Expenditure Trends to Specific Goals ... 38
1.8 Strategic Planning Process ... 40
2. PROGRAMME 1: ADMINISTRATION ... 43
3. PROGRAMME 2: DISTRICT HEALTH SERVICES ... 55
Primary Health Care... 56
HIV, AIDS, STI & TB Control (HAST)... 70
Maternal, Neonatal, Child & Women’s Health (MNCWH) and Nutrition ... 82
Disease Prevention and Control (DPC) ... 98
District Hospitals ... 105
4. PROGRAMME 3: EMERGENCY MEDICAL SERVICES ... 118
5. PROGRAMME 4: REGIONAL AND SPECIALISED HOSPITALS ... 134
Regional Hospitals ... 135
Specialised TB Hospitals ... 142
Specialised Psychiatric Hospitals ... 150
Oral and Dental Training Centre ... 155
Addington Children’s Hospital ... 161
Step-Down, Rehabilitation and Chronic Hospitals ... 155
6. PROGRAMME 5: CENTRAL AND TERTIARY HOSPITALS ... 164
Central Hospital – Inkosi Albert Luthuli Hospital ... 167
LIST OF TABLES
Table 1: (1a) Strategic Goals ... 15
Table 2: KZN Total Population per District ... 18
Table 3: KZN Uninsured Population per District ... 19
Table 4: KZN Socio-Economic Profile... 19
Table 5: Maternal deaths per level of care ... 20
Table 6: TB Notification and MDR-TB (ETR.net) ... 22
Table 7: Cuban Training Programme ... 28
Table 8: (A2) Health Personnel - 2013/14 ... 29
Table 9: Public Health Facilities in KZN ... 30
Table 10: National and Provincial Priorities ... 31
Table 11: (A8) Summary of Payments and Estimates ... 36
Table 12: (A9) Summary of Provincial Expenditure Estimates by Economic Classification ... 37
Table 13: (A10) Trends in Provincial Public Health Expenditure (R’000) ... 38
Table 14: Conditional Grants Expenditure Trends (R’000) ... 39
Table 15: (ADMIN2) Customised Performance Indicators - Administration ... 46
Table 16: (ADMIN1) Provincial Strategic Objectives and Targets - Administration ... 47
Table 17: (ADMIN3) 2014/15 Targets - Administration ... 51
Table 18: (ADMIN4 a) Summary of Payments and Estimates - Programme 1 ... 52
Table 19: (ADMIN4 b) Summary Payments & Estimates by Economic Classification - Programme 1 ... 52
Table 20: Districts and Regions ... 56
Table 21: (DHS1) District Health Service – 2013/14 (DHIS) ... 58
Table 22: (DHS2) Customised Situation Analysis Indicators – PHC 2012/13 ... 60
Table 23: (DHS4) Customised Performance Indicators - PHC ... 63
Table 24: (DHS3-A) Provincial Strategic Objectives and Targets - PHC ... 67
Table 25: (DHS5) 2014/15 Targets - PHC ... 69
Table 26: MDR Injection Teams vs. MDR cases... 72
Table 27: (HIV1) Customised Situation Analysis Indicators – HAST 2012/13 ... 74
Table 28: (HIV3) Customised Performance Indicators - HAST ... 76
Table 29: (HIV2) Provincial Strategic Objectives and Targets - HAST ... 78
Table 30: (HIV4) 2014/15 Targets - HAST ... 81
Table 31: Deliveries in MOU’s 2010/11 – 2012/13... 82
Table 32: (MCWH1) Customised Situation Analysis Indicators - MNCWH and Nutrition 2012/13 ... 85
Table 33: (MCWH3) Customised Performance Indicators - MNCWH and Nutrition ... 89
Table 34: (MCWH2) Provincial Strategic Objectives and Targets - MNCWH and Nutrition ... 94
Table 35: (MCWH4) 2014/15 Targets – MNCWH and Nutrition ... 96
Table 36: (DCP1) Customised Situation Analysis Indicators - DPC 2012/13 ... 100
Table 37: (DCP3) Customised Performance Indicators - DPC ... 101
Table 38: (DCP2) Provincial Strategic Objectives and Targets - DPC ... 103
Table 39: (DPC4) 2014/15 Targets - DPC ... 104
Table 40: District Hospital BUR and ALOS per clinic al domain ... 105
Table 41: (DHS6) Customised Situation Analysis Indicators - District Hospitals 2012/13 ... 108
Table 43: (DHS7-A) Provincial Strategic Objectives and Targets - District Hospitals ... 114
Table 44: (DHS9) 2014/15 Targets – District Hospitals ... 115
Table 45: (DHS11-A) Summary of Payments and Estimates - Programme 2 ... 116
Table 46: (DHS11-B) Summary Payments & Estimates by Economic Classification - Programme 2 ... 116
Table 47: (EMS1) Situation Analysis Indicators - EMS and PPT 2012/13 ... 124
Table 48: (EMS3) Customised Performance Indicators - EMS and PPT... 125
Table 49: (EMS2) Provincial Strategic Objectives and Targets – EMS and PPT ... 127
Table 50: (EMS4) 2014/15 Targets – EMS and PPT ... 129
Table 51: (EMS5-A) Expenditure Estimates - Programme 3 ... 130
Table 52: (EMS5-B) Summary Expenditure Estimates by Economic Classification - Programme 3 ... 130
Table 53: (PHS2) Customised Performance Indicators - Regional Hospitals ... 137
Table 54: (PHS1-A) Provincial Strategic Objectives and Targets - Regional Hospitals ... 140
Table 55: (PHS4-A) 2014/15 Targets – Regional Hospitals ... 141
Table 56: MDR-TB Decentralized and Satellite Sites ... 143
Table 57: (PHS2-B) Customised Performance Indicators - Specialised TB Hospitals ... 145
Table 58: (PHS1-D) Provincial Strategic Objectives and Targets - Specialised TB Hospitals ... 148
Table 59: (PHS4-B) 2014/15 Targets – Specialised TB Hospitals... 149
Table 60: Specialised Psychiatric Services beds ... 150
Table 61: (PHS2-C) Customised Performance Indicators - Specialised Psychiatric Hospitals ... 151
Table 62: (PHS1-F) Provincial Strategic Objectives and Targets - Specialised Psychiatric Hospitals ... 153
Table 63: (PHS4-C) 2014/15 Targets – Specialised Psychiatric Hospitals ... 154
Table 64: (PHS2-D) Customised Performance Indicators - Chronic/Sub-Acute Hospitals ... 156
Table 65: (PHS1-H) Provincial Strategic Objectives & Annual Targets - Chronic/Sub-Acute Hospitals ... 159
Table 66: (PHS4-D) 2014/15 Targets – Chronic/Sub-Acute Hospitals ... 160
Table 67: (PHS4-A) Summary of Payments and Estimates - Programme 4 ... 162
Table 68: (PHS4-B) Summary Payments & Expenditure by Economic Classification - Programme 4 ... 162
Table 69: (CHS2) Customised Performance Indicators - Central Hospital ... 167
Table 70: (CHS1-B) Provincial Strategic Objectives and Targets - Central Hospital ... 170
Table 71: (CHS3) 2014/15 Targets – Central Hospital ... 171
Table 72: (THS2) Customised Performance Indicators - Tertiary Hospitals ... 172
Table 73: (THS1-B) Provincial Strategic Objectives and Targets - Tertiary Hospitals ... 175
Table 74: (THS3) 2014/15 Targets – Tertiary Hospitals ... 176
Table 75: (CH7-A) Summary of Payments and Estimates - Programme 5 ... 177
Table 76: (CH7-B) Summary Payments & Estimates by Economic Classification - Programme 5 ... 177
Table 77: Production of 4-year students and students in bridging programme 2009-2011 ... 181
Table 79: (HST2) Customised Performance Indicators - Health Sciences and Training ... 184
Table 88: Institutional Maintenance Categories ... 203
Table 89 : Historical Performance of Maintenance Programme ... 203
Table 90: Historical Performance of Maintenance Programme per District ... 204
Table 91: Quarter 3 Job creation and Demographics - overall performance against Annual Plan ... 205
Table 92: Quarter 3 Job creation and Demographics ... 205
Table 93: Progress Report on Maintenance of Buildings, Garden and Grounds ... 206
Table 94: Expenditure ... 206
Table 95: (HFM2) Customised Performance Indicators - Health Facilities Management ... 209
Table 96: (HFM 1) Provincial Strategic Objectives and Targets – Health Facilities Management ... 210
Table 97: (HFM3) Quarterly Targets for Health Facilities Management 2014/15 ... 211
Table 98: (HFM4-A) Expenditure Estimates: Health Care Support Services - Programme 8 ... 212
Table 99: (HFM4-B) Summary Expenditure Estimates by Economic Classification - Programme 8 ... 213
Table 100: Health Infrastructure Grant... 218
Table 101: Nursing Colleges and Schools Grant ... 218
Table 102: Hospital Revitalisation Grant ... 219
Table 103: Equitable Share ... 220
Table 104: Conditional Grants 2014/15 ... 225
Table 105: Public Entities ... 226
Table 106: Public Private Partnership ... 227
LIST OF GRAPHS
Graph 1: HIV Prevalence (ANC Women) and Patients on ART ... 22Graph 2: PHC utilisation versus workload (2012/13 DHER Report) ... 26
Graph 3: Resource equity – 2012/13 (2012/13 DHER Report) ... 27
Graph 4: Clinic to 10 000 Population versus Utilisation Rate ... 56
Graph 5: MMC targets vs. current performance... 70
Graph 6: Deaths in children under 5 years ... 82
Graph 7: Response times versus Programme 3 - Current expenditure ... 121
Graph 8: Expenditure for Sub-Programme 3.2 ... 122
Graph 9: Response times versus rostered ambulances ... 122
Graph 10: Health Infrastructure Expenditure Trends ... 214
LIST OF FIGURES
Figure 1: KZN Population Pyramid 2001, 2011, and 2012 ... 18Figure 2: Macro Organisational Structure ... 24
FOREWORD BY THE EXECUTIVE AUTHORITY
As we celebrate our vibrant democracy and approach the end of the current term of office, we note with pride the great strides we have made in redressing historical imbalances in health service delivery in the Province.
Progress is evident in the various progressive shifts from previously fragmented institution–based services to more comprehensive and integrated primary health care and community-based services, augmenting the Constitutional right of all citizens to have access to health care closer to where they live. That said, we acknowledge the work that still needs to be done to ensure universal health access for citizens in our province.
Scientific evidence attests to the fact that health investments are beginning to show a positive impact on the quadruple burden of disease:
Significant reduction in mother to child transmission of HIV (from 6.8% in 2010/11 to 2.1% in 2013/14);
Year on year decrease in the number of maternal deaths in facilities (from 353 in 2010/11 to 317 in 2012/13);
Significant reduction of the TB incidence (from 1 149 per 100 000 population to 844 per 100 000 population in 2013/14); and
Increase in life expectancy from 45.7 to 53.4 years for males and 51 to 58.7 years for females. The 2014/15 Annual Performance Plan was crafted following a high level assessment and analysis of health system and service delivery successes, constraints and demands. The focus remains on high impact strategies to improve health system effectiveness and reverse the quadruple burden of disease. The Department will build on past successes and actively explore innovative solutions within current financial constraints.
I remain committed to provide the necessary leadership and support to ensure that we continue to strive for excellence in service delivery.
I hereby endorse the 2014/15 Annual Performance Plan as guiding framework within which the Department will execute its mandate in serving the people of KwaZulu-Natal.
……… Dr SM Dhlomo
Member of the Executive Council (MEC) KwaZulu-Natal Department of Health
STATEMENT BY THE HEAD OF DEPARTMENT
I am pleased to present the Department’s Annual Performance Plan for the financial year 2014/15, including the MTEF cycle up to 2016/17. During the last four years the Department made significant progress towards establishing an enabling environment to spearhead implementation of strategies targeting core Province-specific priorities as well as national priorities identified in the National Health System 10 Point Plan and Negotiated Service Delivery Agreement for Health.
The high burden of disease remains a concern, although carefully considered investments in priority programmes and services paid off as eloquently proved by empirical evidence. The reduction in mother to child transmission of HIV, reduced TB incidence, and improved child survival is encouraging and serve as motivation to do better.
As we move forward in our transformation agenda, the focus will be on unfinished business during the 2014/15 financial year. The Department will focus on:
Health system strengthening including efficient leadership and management.
Programmes to improve TB outcomes.
Programmes to reduce HIV infection and effective management of patients living with HIV and AIDS.
Implementation of the Strategy to reduce Non-Communicable Diseases.
Expansion of PHC re-engineering, supported by innovations tested in the National Health Insurance pilot districts.
Strengthening Emergency Medical Services and Forensic Pathology Services.
Human resources for health including innovative training options in response to demand for health professionals.
Strengthening information and performance management.
Strengthening financial management.
Health facility infrastructure.
Inherent in all the above will be the principles of accessibility, equity, quality, community participation, appropriate technology, and inter-governmental and inter-sectoral consultation and cooperation. Multi-sector collaboration, including implementation of the Provincial Growth and Development Plan with oversight from the Office of the Premier, will ensure that the core business of the Department is aligned with the National Development Plan 2030 and the 2014-2019 Medium Term Strategic Framework.
The Department plan to actively explore innovative options to service delivery especially in light of the fiscal challenges. Partnerships with the scientific community will be strengthened to ensure evidence-based decision-making and planning.
OFFICIAL SIGN-OFF: KZN DEPARTMENT OF HEALTH 2014/15 - 2016/17
ANNUAL PERFORMANCE PLAN
It is hereby certified that the 2014/15 – 2016/17 Annual Performance Plan for the KwaZulu-Natal Department of Health:
1. Was developed by the Provincial Department of Health in KwaZulu-Natal with leadership from the MEC for Health and the Head of Department.
2. Complies with the National Customised Framework, the National Health System 10 Point Plan, reviewed Negotiated Service Delivery Agreement for Health, the 2014-2019 Strategic Plan of the KwaZulu-Natal Department of Health, the Medium Term Strategic Framework 2014-2019, National Development Plan 2030, Provincial Growth and Development Plan 2030 and other long term plans. 3. The Plan reflects the performance targets which the Department will endeavor to achieve given
the resources and budget for the 2014/15 – 2016/17 MTEF.
Mrs E Snyman Mr J Govender
Manager: Strategic Planning General Manager: Planning, Monitoring & Evaluation Date: 14 March 2014 Date: 14 March 2014
Mr S Mkhize
Acting Chief Financial Officer Date: 18 March 2014
Accounting Officer: KwaZulu-Natal Health Date: 20 March 2014
PART A
1.
STRATEGIC OVERVIEW
1.1
VISION, MISSION AND VALUES
VISION
Optimal health status for all persons in KwaZulu-Natal
MISSION
To develop a sustainable, coordinated, integrated and
comprehensive health system at all levels, based on the
Primary Health Care approach through the District
Health System
VALUES
Trust built on truth, integrity and reconciliation
Open communication, transparency and consultation
Commitment to performance
Courage to learn, change and innovate
1.2
STRATEGIC GOALS
To comply with directives from the Department Performance Monitoring and Evaluation and the National Department of Health, the national customised priorities (National Sub-Outputs - NSOs) have been added to the Provincial Strategic Goals for the current 2010-2014 planning cycle (Table 1). National priorities have been aligned with the National Development Plan 2030 and draft Medium Term Strategic Framework 2014-2019 and included in the Provincial Annual Performance Plan for 2014/15. Departmental priorities have been aligned with the vision and core priorities of the Provincial Growth and Development Plan 2030.
Table 1: (1a) Strategic Goals
Goal Statement Rationale Expected Outcomes
STRATEGIC GOAL 1: OVERHAUL PROVINCIAL HEALTH SERVICES
2014/15 National Sub-Outputs (NSOs)
National Sub-Output 6: Re-engineering of PHC National Sub-Output 7: Universal health coverage National Sub-Output 8: Human Resources for Health Transform the Provincial health
care system through
implementation of the Service Transformation Plan (STP) 10 core components to improve equity, access and availability, efficiency, quality and effective management that will enhance service delivery and improve the health outcomes of all citizens in the Province.
An efficient and well-functioning health care system with the potential to respond to the burden of disease and health needs in the Province.
Transformation in line with STP imperatives and the National Health System 10-Point Plan.
Improved access, equity, efficiency, effectiveness and utilisation of health services.
Improved Human Resource Management Services including reconfiguration of organisational structures, appropriate placement of staff (appropriate skills mix and competencies), appropriate norms and standards to respond to burden of disease and package of services, strengthened performance management and decreased vacancy rates.
Improved Financial & Supply Chain Management efficiency and
accountability to curb over-expenditure, improve return on investment and value for money, and budget aligned with service delivery priorities and needs.
Appropriate response to the burden of disease and consequent health needs.
Improved governance including regulatory framework, policies and delegations to facilitate implementation of the Strategic Plan.
Decentralised delegations, controls and accountability.
Goal Statement Rationale Expected Outcomes the National Health Insurance
Building Blocks in the three pilot districts
NSO 8: Implementation of the Human Resources for Health Strategy and Plan; Decentralised training model with PHC focus for Health Sciences in collaboration with the University of KZN; Increase production and equitable distribution of appropriate human resources; and Improve facility management.
teams (1 team per Region) by 2014/15
159 School Health Teams by 2014/15
95 Ward-Based Outreach Teams
established by 2014/15
STRATEGIC GOAL 2: IMPROVE THE EFFICIENCY AND QUALITY OF HEALTH SERVICES
2014/15 National Customised Sub-Outputs (NSOs) National Sub-Output 2: Health Facility Planning
National Sub-Output 3: Improved financial management in the health sector
National Sub-Output 4: Efficient health management information system for improved decision making National Sub-Output 5: Improved quality of care
Achieving the best possible health outcomes through effective utilisation of resources within the funding envelope.
Improved compliance with legislative/ policy requirements and National Core Standards for Quality in order to improve clinical and health outcomes.
Accreditation (certification) of health facilities in line with National Core Standards for Quality.
Improved management capacity.
Improved health outcomes and increased life expectancy.
Improved performance towards achieving the Millennium Development Goal (MDG) targets.
Patient satisfaction with public health services.
NSO 2: Improving health facility planning
NSO 3: Improving financial management and control
NSO 4: Improving health information systems, quality and management of data for improved decision-making
NSO 5: Improve quality of care through implementation of National Core Standards
Improved health facility planning
100% of facilities conditionally compliant (50% - 75%) to the National Core Standards by 2019
Unqualified audit opinion by 2019
STRATEGIC GOAL 3: REDUCE MORBIDITY AND MORTALITY DUE TO COMMUNICABLE DISEASES AND NON-COMMUNICABLE CONDITIONS AND ILLNESSES.
2014/15 National Customised Sub-Outputs (NSOs)
National Sub-Output 1: Prevent and reduce the disease burden and promote health Implement integrated high impact
strategies to improve prevention, detection, referral, management, follow-up and support of
communicable diseases and non-communicable illnesses and conditions at all levels of care.
Reduction of preventable and modifiable causes of morbidity and mortality at community and facility level contributing to a reduction in morbidity and mortality.
Decrease in morbidity and mortality – with specific reference to preventable causes.
Improved performance towards achievement of MDG and NSDA targets i.e. HIV and AIDS; TB; Maternal & Child Health; Malaria; and Change in trends of non-communicable disease patterns. NSO 1: Implementing integrated
high impact strategies to:
Improve TB outcomes
Reduce HIV incidence and
manage prevalence
Increase overall life expectancy of males to 58.4 years and females to 62.7 years by 2019
Reduce HIV Incidence to 1% by 2019
Goal Statement Rationale Expected Outcomes Eradicate malaria
Reduce maternal, infant and child morbidity and mortality
Reduce non-communicable
(NCD) diseases and manage NCD prevalence
Contribute towards reducing intentional and unintentional injuries and violence
Reduce mother to child transmission rate to <0.5% by 2019
Reduce (facility) maternal mortality ratio by 20% to 128.3 per 100 000 live births by 2019 (NCCEMD).
Reduce infant mortality by 20% to 33.6 per 1000 live births by 2019 (ASSA2008)
Reduce child mortality by 20% to 47.8 per 1000 live births by 2019 (ASSA2008)
Reduce hypertension incidence from
23.6/1000 to 21.6/1000 by 2016/17
Reduce diabetes mellitus incidence from 2.2/1000 to 1.9/1000 by 2016/17
1.3
SITUATIONAL ANALYSIS
1.3.1
Demographic Profile
KwaZulu-Natal, the second most populous province in South Africa, occupies 7.6% (92,100 sq. km) of the total land surface of South Africa with a population density of 107.52 people per sq. km ranging between 7 people per km2 in
Kwa Sani Municipality (Sisonke) and 1 502 people per km2 in eThekwini Metro (Census
2011).
The Province comprises 1 Metropol, 10 Districts, 50 Municipalities and 828 Wards. The Sisonke District has been renamed as Harry Gwala – awaiting Gazetting before changing in APP. The Province shares borders with the Eastern Cape in the South, Free State and Lesotho in the West, Mpumalanga in the North West, and Swaziland and Mozambique in the North. Patients from Mpumalanga, Mozambique and Swaziland utilise health services in the northern districts of Umkhanyakude and Zululand, while patients from the Eastern Cape utilise health services in the southern districts of Ugu and Sisonke. It is not possible to determine the extent
Swaziland: Golela International Border Post within Zululand District.
Mozambique: Manguzi International Border Post within Umkhanyakude District
According to mid-year population estimates (Stats SA 2013), the KZN population increased from 10 267 300 in 2011 (Census 2011) to 10 457 907 in 2013. The DHIS population, used for service delivery information, is 10 785 397 for 2013/14 (Table 2).
Females comprise 52.4% of the KZN population and males 47.6%; 32.6% of the total population is under the age of 15 years; 59.8% between 15 and 65 years; and 7.5% over the age of 65 years (Figure 1).
More than one third of the population resides in eThekwini which points to unique service delivery challenges as compared to other districts (Table 2).
Figure 1: KZN Population Pyramid 2001, 2011, and 2012
Source: Statistics South Africa
Table 2: KZN Total Population per District
District 2011 (Census) 2012/13 DHIS (1.8%) 2013/14 DHIS (3.1%) 2014/15 Year 1 (1.05%) 2015/16 Year 2 (1.03%) 2016/17 Year 3 (1.0%) Ugu 722 484 735 778 771 421 796 126 804 326 812 369 Umgungundlovu 1 017 763 1 036 489 1 077 834 1 089 151 1 100 369 1 111 373 Uthukela 668 848 681 154 705 018 712 421 719 759 726 957 Umzinyathi 510 838 520 237 520 604 526 070 531 489 536 804 Amajuba 499 839 509 036 519 890 525 349 530 760 536 068 Zululand 803 575 818 360 867 932 877 045 886 079 894 940 Umkhanyakude 625 846 637 362 673 236 680 305 687 312 694 185 Uthungulu 907 519 924 217 986 080 996 434 1 006 697 1 016 763 Ilembe 606 809 617 975 635 026 641 694 648 303 654 786 Harry Gwala 461 419 469 909 516 693 522 118 527 496 532 770 eThekwini 3 442 361 3 505 700 3 511 761 3 548 634 3 585 185 3 621 037 KwaZulu-Natal 10 267 300 10 457 907 10 785 397 10 898 644 11 010 900 11 121 009
2012/13 and 2013/14 populations: Data from DHIS (based on Stats SA Mid-Year Estimates). Rural Development Nodes (including Umzimkhulu Municipality in Sisonke) highlighted in light blue.
0-4 5-9 10-14 15-19 20-24 25-29 30-34 35-39 40-44 45-49 50-54 55-59 60-64 65-69 70-74 75-79 80+
Estimated population growth indicated in brackets. Projected population will serve as baseline although it will be reviewed/ adjusted annually based on mid-year population estimates published by Stats SA.
2012 and 2013 population: Used population from the District Health Information System (populated by the National Department of Health) as per Statistics SA mid-year projections in order to align with historic service delivery reporting.
Table 3: KZN Uninsured Population per District
Districts Population Uninsured 2011/12 2012/13 2013/14 2014/15 Year 1 2015/16 Year 2 2016/17 Year 3 Ugu 90.8% 656 015 668 086 700 450 722 882 730 328 737 631 Umgungundlovu 80.3% 817 264 832 301 865 501 874 588 883 396 892 433 Uthukela 93.7% 626 711 638 241 660 602 667 738 674 395 681 159 Umzinyathi 91.2% 465 976 474 456 474 790 479 776 484 718 489 565 Amajuba 88.2% 440 858 448 969 458 542 463 358 468 130 472 812 Zululand 91.8% 737 681 751 254 796 761 805 127 813 421 821 555 Umkhanyakude 95.1% 595 180 606 131 640 247 646 970 653 634 660 170 Uthungulu 84.2% 765 947 778 191 830 279 838 997 847 639 856 114 Ilembe 90.8% 550 983 561 121 576 604 852 658 588 659 594 546 Harry Gwala 92.1% 424 967 432 786 475 874 480 871 485 824 490 681 eThekwini 74.2% 2 554 231 2 601 229 2 605 727 2 633 086 2 660 207 2 686 809 KwaZulu-Natal 87.7% 9 004 422 9 170 707 9 458 793 9 558 111 9 656 559 9 753 125
Uninsured population per district (%): District Health Barometer 2012/13 (4).
Rural Development Nodes (including Umzimkhulu Municipality in Sisonke) highlighted in light blue. Uninsured population calculated on total projected population in Table 2.
Although universal access (national/ provincial vision) includes both insured and uninsured people, the immediate challenge remains to improve access to the significant proportion of uninsured people in the province.
1.3.2
Socio-Economic Profile
According to Census 2011, the average household income in the province increased from R 38 905 in 2001 (ranging between R 18 952 in Sisonke and R 56 220 in eThekwini) to R 83 050
support and 172 780 (20%) indigent electricity support (MDG Country Report, 2013).
2001 2013 Average household income R 38 905 R 83 050 Unemployment rate 49% 33% Informal housing (households) 226 174 211 546
Access to basic services (household)
Households using
electricity for cooking 1 008 491 (47.6%) 1 743 283 (68.6%) Households with no
access to piped water 582 600 (27.5%) 357 398 (14.1%) Blue Drop Score (Water) 65%
(2010) 92.9% (2012) Households with no
sanitation 339 497 (16%) 159 070 (6.3%) Households with no refuse
removal 219 673 (10.4%) 151 203 (6%) Social determinants Female-headed households 46.5% 46.6% 2001 2013 Child-headed households 0.8% 0.9% Education
Population 5-24 years not
attending school 1 271 135 1 060 805 Source: Statistics SA
Children are still disproportionately affected by poverty in the province with nearly three-quarters (73.5%) of children living in poor households compared with 64.5% nationally. The percentage of children in households where no adults were employed increased from 38.2% (2001) to 40.6% (2012) as compared with 32.4% nationally (8).
The percentage of children living in households that reported hunger decreased from 37.3% (2001) to 16.9% (2012), while 34.3% of children live in households that experience inadequate or severely inadequate access to food compared to 30.6% nationally (8).
1.3.3
Epidemiological Profile/ Burden of Disease
According to the KZN Hospital Survey 2011, 39% of patients admitted in public hospitals are admitted for infectious diseases; 37.4% for non-communicable conditions; and 23.6% for injuries. Nearly one third of female admissions (24.3%) are for normal vaginal delivery.
Admissions with HIV as primary condition are rare, with most patients admitted with infections such as TB and pneumonia (22%) as primary cause and HIV as underlying cause.
The burden of HIV is shared at District and Regional Hospitals with 57.5% of HIV positive patients admitted in District Hospitals (25% of total admissions) and 42.5% in Regional Hospitals (20% of total admissions) (p<.001).
Infectious diseases (59.3%) are the leading Immediate cause of death; while the underlying causes of death included HIV infection (44%) and hypertension and diabetes 11.1% TB remains the leading cause of death in KZN (15.9%) followed by intestinal infectious diseases (5.7%) and influenza and pneumonia 5.6% (KZN Hospital Survey, 2011).
Maternal, Neonatal, Child and Women’s Health
The provincial institutional maternal mortality ratio(iMMR) decreased from 194.2 per 100 000 live births to 160.3 per 100 000 live births between 2010 and 2012.
Underlying causes of death were non-pregnancy related infections (43.1%); obstetric haemorrhage (12.4%); medical/ surgical disorders (12.4%); hypertension (9.7%); and miscarriage (5.8%) – (2010-2012 Confidential Enquiry into Maternal Deaths in SA - NCCEMD). Table 5 compares the provincial iMMR per level of care in public health hospitals (DHIS).
Table 5: Maternal deaths per level of care
Level 2010/11 2011/12 2012/13
Number of maternal deaths per level of care (facility)
District 112 101 86
Level 2010/11 2011/12 2012/13
Tertiary 3 3 18
Central 6 10 12
KZN 301 331 312
Number of live births per level of care
District 86 365 84 665 86 568 Regional 76 421 80 822 75 955 Tertiary 1 378 1 549 1 328
Central 379 457 496
KZN 164 543 167 493 164 347 Facility maternal mortality ratio per 100 000 live births
District 129.7 119.3 99.3 Regional 235.5 268.5 258 Tertiary 217.7 193.7 1 355.4 Central 1 583.1 2 188.2 2 419.4 KZN 182.9 197.6 189.8 Source: DHIS
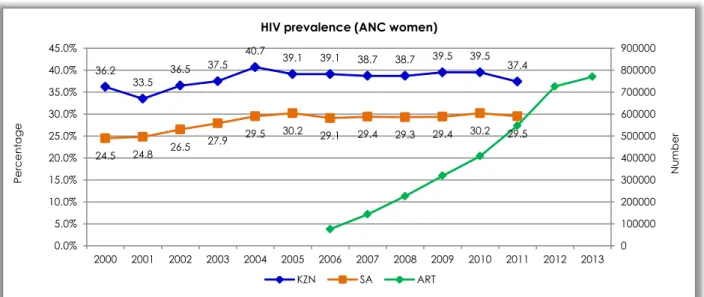
According to antenatal care surveillance data, the HIV prevalence amongst pregnant women showed a consistent decrease between 2009 and 2011:
All pregnant women: Decreased from 39.5% to 37.4%;
15-19 year old pregnant women: Decreased from 22% to 16.8%; and
20-24 year old pregnant women: Decreased from 37.2% to 33.3%.
Almost 5% of babies born in the province have a birth weight below 2 000 grams, and more than 3 000 babies do not survive the neonatal period. It is estimated that 65% of neonatal deaths occur in district hospitals with a current neonatal mortality rate of 10.8/1000 (2013/14 DHIS). Early facility neonatal mortality ranges between 3.6/1000 in the Amajuba District and 19.1/1000 in the Umgungundlovu District (DHIS).
According to data from the Child Health Problem Identification Programme, the infant and under-5 mortality rates in the province were 32.9/1000 and 44.6/1000 in 2010 which equates to 1 in 22 children born in KZN dying before their fifth birthday. Over a third of these deaths (38.7%) occurred outside health facilities, and amongst those deaths occurring in the public health sector 56.5% of infant deaths occurred in District Hospitals (Dr N McKerrow).
Regardless of the level of care, 2.6% of children presenting to the public sector were dead on arrival at the facility; 31.5% of deaths occur within the first 24 hours of admission; and a further 25.7% between the first and third day of admission i.e. 57.2% of childhood deaths occur within 72 hours of admission to a hospital.
According to the 2011 Hospital Survey, the most common reasons for admission in children under 5 years were gastroenteritis (21%), pneumonia (20%) and neonatal conditions (14%) including sepsis, jaundice, preterm delivery/low birth weight, respiratory distress syndrome and congenital pneumonia.
According to the 2009 Saving Childrens Report, 60% of children who died in public health hospitals were malnourished and 50% had clinical evidence of AIDS (9).
According to SANHAINES-1, 15.8% of children are stunted and 5.3% wasted. The underweight for age under 5 years decreased from 19.4/1000 (2010/11) to 13.8/1000 in 2013/14 (DHIS).
HIV, AIDS and STIs
According to ASSA2008 projections, the HIV incidence is 1.01% (total general population); 3.48% (women 15-19 years); and 2.42% (youth 15-24 years). The estimated prevalence rate in the general population is 15.2%, compared to the 37.4% prevalence in antenatal women in
AIDS sick patients (untreated HIV stage 4 plus one quarter of those on ART experiencing HIV stages 5 and 6) increased from 143 241 (2009) to 168 173 in 2013.
The number of patients treated for sexually transmitted infections (new cases) increased from 455 627 (2010/11) to 471 781 in 2012/13 (DHIS).
According to Stats SA, HIV related deaths in the province decreased from 67 429 to 54 337
between 2008 and 2010, which can be attributed to successes in the management of the HIV, AIDS and related infections.
The province reported the highest HIV prevalence among pregnant women for the past 13 years (Graph 1), reaching 37.4% (35.8-39.0) in 2011 compared to 29.5% (28.7-30.2) nationally (National ANC Surveillance).
Graph 1: HIV Prevalence (ANC Women) and Patients on ART
Source: National HIV Surveillance under ANC Women 2011 and DHIS
Tuberculosis
Approximately 80% of global TB cases are reported in South Africa. KwaZulu-Natal has the highest HIV and TB disease burden in SA with an estimated HIV-TB co-infection rate of 70%. The provincial TB incidence decreased from 1 090 new cases per 100 000 population in 2011 to 889 new cases per 100 000 population in 2012 (31% of all TB cases nationally).
Drug-resistant TB is increasing (Table 6) with a current incidence of 26.8 cases per 100 000 population making it the highest incidence in the world.
The mortality rates among MDR-TB/HIV co-infected patients are exceedingly high (71% one year mortality) with approximately 15% of
MDR-TB/HIV co-infected patients receiving ART at the time of their diagnosis.
Table 6: TB Notification and MDR-TB (ETR.net) District TB Notification MDR-TB cases
put on treatment 2011 2012 2012 2013 (Q3) Ugu 1 410 1 221 167 268 Umgungundlovu 1 100 884 211 284 Uthukela 782 686 - 28 Umzinyathi 1 000 810 61 63 Amajuba 730 654 - - Zululand 1 192 940 321 264 36.2 33.5 36.5 37.5 40.7 39.1 39.1 38.7 38.7 39.5 39.5 37.4 24.5 24.8 26.5 27.9 29.5 30.2 29.1 29.4 29.3 29.4 30.2 29.5 0 100000 200000 300000 400000 500000 600000 700000 800000 900000 0.0% 5.0% 10.0% 15.0% 20.0% 25.0% 30.0% 35.0% 40.0% 45.0% 2000 2001 2002 2003 2004 2005 2006 2007 2008 2009 2010 2011 2012 2013 Nu m b e r Pe rc e nt a ge
HIV prevalence (ANC women)
District TB Notification MDR-TB cases put on treatment 2011 2012 2012 2013 (Q3) Umkhanyakude 1 145 907 220 231 Uthungulu 1 141 652 386 314 Ilembe 1 110 877 - 97 Harry Gwala 1 172 1 043 160 135 eThekwini 1 212 1 103 1 069 1 348 KZN 1 090 889 2 553 2 898 Non-Communicable Diseases
According to the World Health Organisation (WHO), non-communicable diseases constituted 63% of all deaths in 2008 including cardiovascular disease (48%), cancers (21%), chronic respiratory diseases (12%) and diabetes (3%). It is further estimated that deaths due to non-communicable diseases will increase by 17-24% in the African Region over the next 10 years.
According to the 2012 General Household Survey, 19.8% of the total South African population and 20% of the population in KZN suffer from chronic diseases.
According to the 2011 KZN Hospital Survey, hypertension, cancer, diabetes (type 2 most common) and concurrent diabetes and hypertension are the most common non-communicable diseases admitted in KZN public health hospitals. The most common cancers admitted in hospitals are cancer of the cervix, breast cancer and cancer of the oesophagus. Most cancers occurred after the age of 30. Diabetes incidence decreased from 3 per 1000 population (2010/11) to 1.3 per 1000 population in 2013/14. The hypertension incidence decreased from 29.8 per 1000 population (2010/11) to 23.6 per 1000 population in 2013/14
Mental Health
The burden of mental disorders is considerable with approximately 14.3% of adults (15 years and older) and 17% of children/adolescents (under 15 years) estimated to have a mental disorder. In KZN, an estimated 955 814 adults (13.6%) and 420 651 children and adolescents (11.5%) have a mental disorder.
The co-morbidity between mental disorders, substance use disorders and physical conditions such as HIV and AIDS, heart disease, diabetes, trauma, etc. is significant with an estimated 43.7% of HIV infected individuals and 15-20% of perinatal mothers having a mental disorder. Chronic mental disorders such as schizophrenia, bipolar disorder and major depressive disorder are independently associated with increased risk for metabolic syndrome, diabetes, heart disease and obesity.
HIV and AIDS are associated with a significantly increased burden of neuropsychiatric disease and disability including depression, anxiety, psychosis and dementia. Mortality due to AIDS has a significant impact on especially children whom are orphaned and therefore placing them at increased risk for mental disorders. There are an estimated 657 880 people living with HIV and AIDS in KZN with a mental disorder.
One-year prevalence rates of mental disorders in people living with HIV in SA are estimated as 31% anxiety disorders; 25% depression; 15% alcohol abuse and dependence; and 24% HIV-associated neurocognitive disorder. This has major implications for programmes aimed at the prevention of HIV as well as those focused on improving adherence to treatment.
Intentional and Unintentional Injuries According to the 2011 Hospital Survey, the majority of admissions for injury include assault
for trauma and around 160 000 visits per year in public hospitals in KZN.
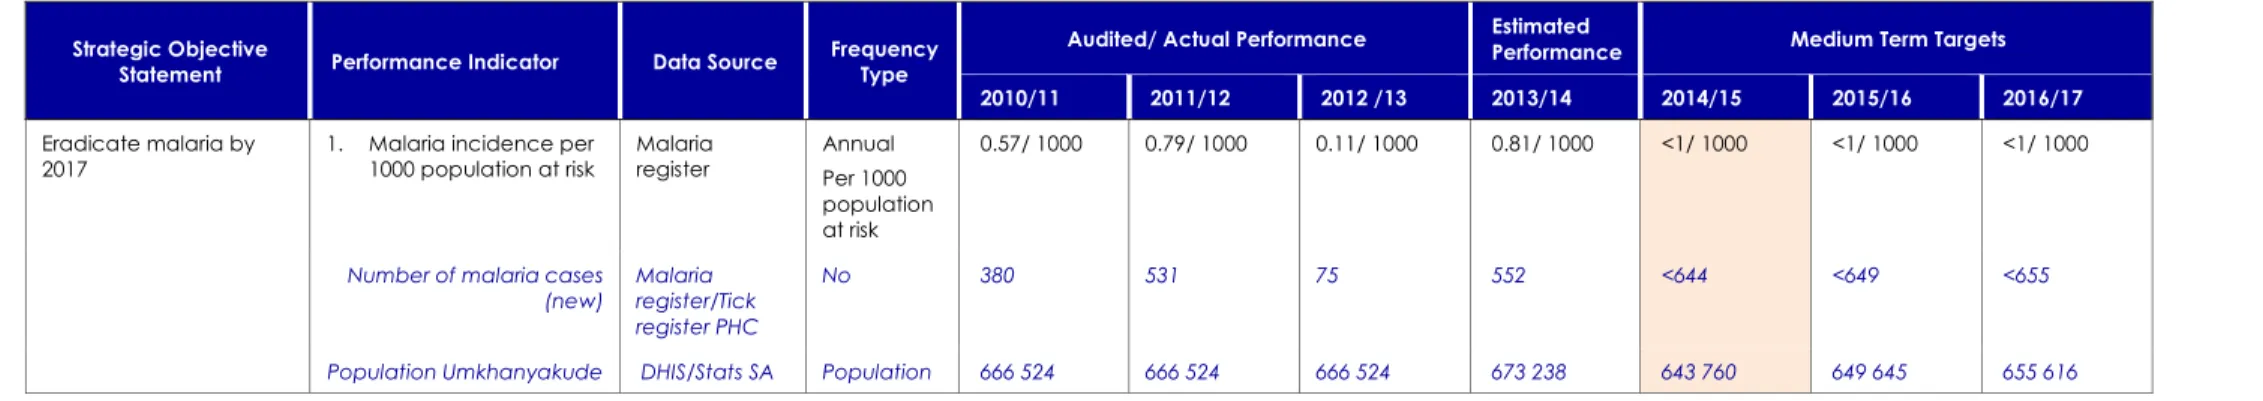
Malaria
Three districts (Umkhanyakude, Zululand and Uthungulu) are endemic to malaria, with approximately 2.5 million people (or ±22.7% of
the total population in the province) at risk of contracting the disease.
Between 2000 and 2010, new malaria cases decreased from 41 786 to 380 and deaths decreased from 340 to 5.
1.4
ORGANISATIONAL ENVIRONMENT
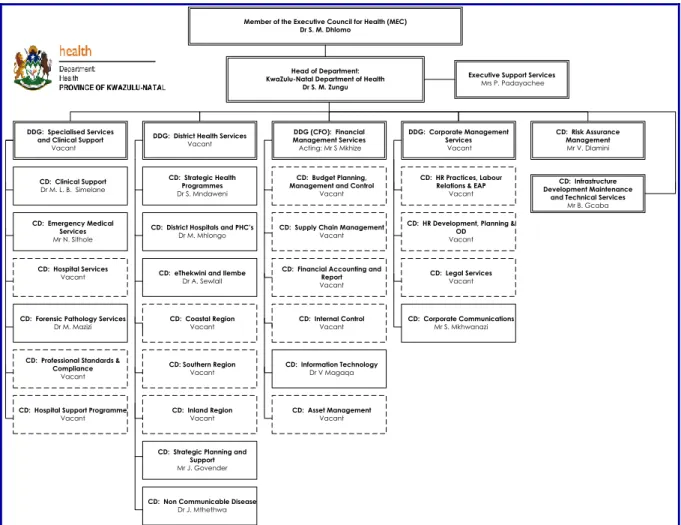
The reviewed macro organisational structure has been approved by the Department of Public Service and Administration (Figure 1). Implementation of the structure, dependent on a limited funding envelope, is expected to improve leadership, oversight and give impetus
to improved service delivery and system strengthening.
The high vacancy rate (Figure 2) is considered one of the high risks and as a result of the high turnover rate and limited funding envelope for filling of “new” posts.
Figure 2: Macro Organisational Structure
Member of the Executive Council for Health (MEC) Dr S. M. Dhlomo
Head of Department: KwaZulu-Natal Department of Health
Dr S. M. Zungu
Executive Support Services
Mrs P. Padayachee
DDG (CFO): Financial Management Services
Acting: Mr S Mkhize
DDG: District Health Services
Vacant
DDG: Specialised Services and Clinical Support
Vacant DDG: Corporate Management Services Vacant CD: Risk Assurance Management Mr V. Dlamini CD: Infrastructure Development Maintenance
and Technical Services
Mr B. Gcaba
CD: HR Practices, Labour Relations & EAP
Vacant
CD: HR Development, Planning & OD Vacant CD: Legal Services Vacant CD: Corporate Communications Mr S. Mkhwanazi CD: Budget Planning, Management and Control
Vacant
CD: Supply Chain Management
Vacant
CD: Financial Accounting and Report Vacant CD: Internal Control Vacant CD: Information Technology Dr V Magaqa CD: Asset Management Vacant CD: Clinical Support Dr M. L. B. Simelane CD: Emergency Medical Services Mr N. Sithole CD: Hospital Services Vacant
CD: Forensic Pathology Services
Dr M. Mazizi
CD: Professional Standards & Compliance
Vacant
CD: Hospital Support Programme
Vacant
CD: Strategic Health Programmes
Dr S. Mndaweni
CD: District Hospitals and PHC’s
Dr M. Mhlongo
CD: eThekwini and Ilembe
Dr A. Sewlall CD: Coastal Region Vacant CD: Southern Region Vacant CD: Inland Region Vacant
CD: Strategic Planning and Support
Mr J. Govender
CD: Non Communicable Disease
Dr J. Mthethwa
New organisational arrangements for the geographical management areas make provision for four Health Regions, each managed by a General Manager (level 14) reporting to the Deputy Director General: District Health Services. Three of these Regional General Manager posts are vacant (Figure 3).
The eThekwini Metro structure makes provision for 1 District Manager (level 14 – post vacant) and two Deputy District Manager posts (level 13) that are filled.
Figure 3: KwaZulu-Natal Health Regions
Head of Department Dr SM Zungu
DDG: District Health Services Vacant GM: Region 2 Vacant GM: Region 3 Vacant GM: Region 1 Dr A Sewlal GM: Region 4 Vacant GM: District Hospitals and PHC Dr M Mhlongo
Primary Health Care
D: Ms J Dalton Ilembe District DM: Vacant eThekwini Metro DM: Vacant Umgungundlovu District DM: Mrs M Zuma-Mkhonza Ugu District DM: Mr V Chetty
Harry Gwala District
DM: Mrs G Radebe Umzinyathi District DM: Mr J Mndebele Amajuba District DM: Mrs M Tshabalala Uthukela District DM: Mrs T Zulu Zululand District DM: Mrs D Memela Umkhanyakude District DM: Mrs M Themba Uthungulu District DM: Vacant eThekwini Metro DM: Mrs P Dladla eThekwini Metro DM: Mr S Yose
Source: Persal and OES
Imbalances in service structures and staff mix Generic structures, developed for PHC clinics (including CHCs) and hospitals, are not fully aligned with the service delivery platform and
planning and high impact strategies to address inequities and demand. This is considered a high risk taking into consideration the limited funding envelope.
Phase 1
Determine current distribution of human resources and average workload per staff category and level of care (Persal, WISN and service delivery data will be used).
High level analyses of human resources versus service delivery platform (standard package of services per level of care) per facility.
Summarise the burden of disease at municipal level to inform staffing norms/ standards in specific geographic areas.
Phase 2
Multi-disciplinary task team develop appropriate evidence-based human resource norms and standards using burden of disease data, current health care utilisation patterns, and health worker capacity. National norms and standards will be used as departure point.
Phase 3
Costing of the proposed Human Resource Plan (2014-2019) - using scenario planning.
Model the additional number of staff (health care and allied health care professionals) required between 2014-2019 (using proposed norms and standards) including requirements for production of professionals by training institutions inside and outside KZN.
New innovations to strengthen human resources for health will be incorporated in the model. Graphs 2 and 3 indicate resource inequities at PHC level (2012/13 DHER). This is also the case in point at facility level. This will be addressed through review of generic structures (all facilities) based on research results mentioned above.
Graph 2: PHC utilisation versus workload (2012/13 DHER Report)
1.9 1 1.8 2.1 1.5 1.6 1.6 1.7 2 1.3 1.7 1.5 2.4 3.2 3.1 2.5 3 2.7 3.3 2.8 2.3 2.9 2.3 2.9 0 5 10 15 20 25 30 35 40 45 50 0 0.5 1 1.5 2 2.5 3 3.5 W or kl oa d R a te PH C U til isa tion R a te
Graph 3: Resource equity – 2012/13 (2012/13 DHER Report)
Deployment of staff
The 2014-2019 Human Resource Plan will make provision for restructuring of the workforce with appropriate policies to formalise management of restructuring.
Staff recruitment and retention
The main challenges remain evidence-based restructuring of the current service delivery platform, aligning the service delivery and training platforms, and insufficient funding to implement appropriate organisational structures. Recruitment of appropriately qualified staff, in especially rural areas, remains a critical challenge which impact on sustainability of services. Despite introduction of Occupational Specific Dispensation, Medical Specialist still shows a high vacancy rate within the province. To address the shortfall of medical officers, the Department sent an additional 343 students to Cuba for training and increased bursaries for
on the programme as they have not been able to secure posts as Medical Officers or Specialists. Retention of Registrars remains a challenge due to funding constraints.
The workforce is relatively young with 29.5% between the ages of 25 to 34 years. Staff over the age of 60 years (4.5%) include retired clinical professionals recruited and employed in a sessional or temporary capacity to supplement the workforce. This emphasise the need for succession planning, training and mentoring. The high turn-over rate (13.6%) is due to 9 191 service termination transactions processed in July 2013 (7 745 or 84% CCGs). CCGs were re-appointed as abnormal appointments.
In August 2012 the Department abolished 9 444 unfunded posts and in November 2012 another 6 072 as per Cabinet resolution. This resulted in a dramatic decrease in vacancy rates (funded posts) compared to previous years.
For purpose of planning, growth in staff numbers
Ama eThek iLembe GwalaH Ugu Umgun Umkhan Umzin Uthukela Uthun Zulu
% Share of PN's 5.2% 27.1% 6.5% 5.4% 9.4% 11.2% 6.8% 4.6% 6.7% 7.3% 9.6% % Share of Population 5% 32% 6% 5% 7% 10% 6% 5% 7% 9% 8% % Share of Expenditure 3.9% 29.3% 6.5% 5.3% 9.1% 10.5% 6.3% 5.0% 6.3% 8.5% 9.2% 0.0% 5.0% 10.0% 15.0% 20.0% 25.0% 30.0% 35.0%
Absenteeism
The high burden of disease continues to impact on absenteeism in the workplace, while effective management of annual and sick leave remains a challenge with significant implications for service delivery.
A project, aimed at updating leave records (annual and sick leave) commenced in 2013/14. This will be actively monitored in 2014/15.
Training and Development
The alignment of nurse training with medium and long-term plans remains a challenge which affects planning for production and placement of qualified nursing staff. This will be addressed in 2014/15 with the development of an integrated Human Resources Plan.
Project 148: Based on figures obtained from the HPCSA, there are approximately 9 000 people with a qualification in Basic Life Support (BLS), and an additional 3 000 people were trained in BLS by the SANDF for the FIFA Soccer World Cup in 2010. A total of 148 of these qualified people reside in KZN.
The Department developed a remedial training plan to accommodate these personnel (Project 148). Out of 3 intakes (68 trainees), 56 have been successfully trained to date. The 4th intake
(18 trainees) commenced training on 6 February 2013. These students will form the pool of potential candidates for future recruitment.
Cuban Training Programme: Expanded from 44 students in 2009/10 to 484 students in 2012/13 with another 344 students being recruited during the 2012 academic year (Table 7). Rural districts will benefit from increased allocations.
Table 7: Cuban Training Programme
Dis tr ict Pla ce d Stud ents Sc hola rs hi p Ex p a nd ed Pr ogr a mme (201 2) Tota l 2 01 3 Amajuba 8 8 23 31 Dis tr ict Pla ce d Stud ents Sc hola rs hi p Ex p a nd ed Pr ogr a mme (201 2) Tota l 2 01 3 eThekwini 2 4 25 29 Ilembe 2 7 23 30 Umgungundlovu 10 9 31 40 Uthukela 10 8 23 31 Umzinyathi 2 6 29 35 Umkhanyakude 12 7 34 41 Uthungulu 7 3 45 48 Zululand 9 8 64 72 Ugu 9 6 25 31 Harry Gwala 0 3 22 25 Total 71 69 344 484
49 Artisan students commenced training and 103 completed their trade qualification; 1 244 Students completed their ABET studies; and 1 409 unemployed students commenced training in 2012/13 with 640 completing their studies. Mid-Level Workers: An estimated R2.5 million was used for implementation of various programmes relating to Mid-Level Workers. The Department is awaiting approval of the 240 credits policy in order for HETU to support Mid-Level Worker training.
Clinical Associates (3-year programme aimed at filling the gap of doctors in rural hospitals): 69 intakes in 2012/13 - 12 graduates receiving the Bachelor’s Degree in Medical and Clinical Practice.
Pharmacist Assistants: 153 intakes in 2012/13 and 24 employed. Training through the Health Science Academy supported with funding from PEPFAR, HWSETA and Skills Development Fund. Negotiations commenced between Department and UKZN for training in KZN.
Dental Assistants: There is an oversupply of Dental Assistants (produced by DUT) with more than 240 currently unemployed. The Department was unable to finalise the employment of 40 unemployed Dental Assistants in 2012/13.
Project 148 (EMS): 89 intakes (Basic Ambulance Assistants) with 53 students expected to graduate in May 2013.
Physiotherapy Technicians: 29 intakes in 2012/13 with 14 graduating.
Nutrition Advisors (programme facilitated by the Faculty of Agriculture at UKZN since May 2012): 400 intakes in 2012/13 with 397 graduating.
Internships: 400 intakes in 2012/13 and 80 permanent placements in the Department. Speech/ Audiology Technicians: Negotiations with UKZN is at an advance stage and training is expected to commence in 2014.
See Programme 8 for Health Infrastructure.
Table 8: (A2) Health Personnel - 2013/14
Categories of Staff employed Number employed % of total
Number per 100,000 people Number per 100,000 uninsured people Vacancy rate % of total personnel budget Annual cost per staff member Medical Officers 3 127 3.8% 29 34.53 0.7% 5.29 R 479 392 Medical Specialists 619 0.8% 5.74 6.83 0.2% 2.97 R 813 775 Dentists 139 0.2% 1.29 1.53 0% 0.38 R 500 526 Dental Specialists 0 0% 0 0 0% 0 R 00 Professional Nurses 14 471 17.8% 134.22 159.78 1.8% 17.51 R 199 520 Enrolled Nurses 10 266 12.6% 95.22 113.35 0.9% 6.95 R 107 914 Enrolled Nursing Auxiliaries 6 289 7.7% 58.33 69.44 0.8% 3.67 R 86 715 Student Nurses 1 691 2.1% 15.68 18.67 0.5% 0.68 R 235 434 Pharmacists 710 0.9% 6.59 7.84 0.2% 1.58 R 415 059 Physiotherapists 277 0.3% 2.57 3.06 0% 0.32 R 213 819 Occupational Therapists 173 0.2% 1.60 1.91 0% 0.16 R 197 173 Radiographers 585 0.7% 5.43 6.46 0.1% 0.82 R 226 172 Emergency Medical Staff 3 079 3.8% 28.56 34.00 0.1% 2.38 R 117 384 Nutritionists and Dieticians 198 0.2% 1.83 2.09 0% 0.19 R 199 060
Community Care Givers 9 868 12.1% 91.53 108.96 0% 1.06 R 18 198 All Other Personnel 29 891 36.7% 277.24 330.05 4%
Total 81 383 100% 754.83 898.61 9.4%
Community Care Givers: There are currently 21 filled CCG posts and 9 847 abnormal appointments. As a result, there are approximately 81 000 employees, 71 500 filled posts, and 78 000 total posts.
1.1
PROVINCIAL SERVICE DELIVERY ENVIRONMENT
Table 9: Public Health Facilities in KZN (DHIS November 2013)District
PHC Clinics (Provincial and LG) Hospitals (Public + State Aided)
C lin ics C ommun ity H ealt h C entr es Satelli te C lin ics Special C lin ics M obil e Ser vic e H ealt h Po st s TO TA L PH C Dis tr ict Re g iona l Ter tia ry C entr a l Speciali sed T B Speciali sed Ps yc hi a tr ic C hr onic Ugu 56 2 17 75 3 1 1 Umgungundlovu 63 3 1 2 20 89 2 1 1 2 3 Uthukela 44 1 1 21 67 2 1 Umzinyathi 55 1 11 67 4 1 Amajuba 25 10 35 1 2 Zululand 72 1 2 21 96 5 1+2 1 Umkhanyakude 58 16 74 5 Uthungulu 63 1 23 2 89 6 1 1 Ilembe 38 2 1 15 56 3 1 Harry Gwala 37 1 13 5 56 4 1 1 eThekwini 133 8 7 24 66 238 2+2 6+1 - 1 4 1 2 KZN 644 19 12 27 233 7 942 38+2 13+1 2 1 12 6 2
The Department took over the McCords State Aided Hospital (classified as Regional Hospital) on 1 February 2014. Classification will be reviewed based on the new service delivery platform/ package of services.
Lower Umfolozi War Memorial Hospital (Classified as Regional Hospital) is rendering Mother and Child services (catchment including Uthungulu, Zululand and Umkhanyakude districts).
Ngwelezane Hospital (classified Tertiary Hospital) renders level 1, 2 and 3 services. There is no District Hospital in the UMhlatuze Municipality (Richards Bay area).
Newcastle Hospital (classified as Regional Hospital) is rendering Mother and Child services for the Amajuba, part of Umzinyathi and Zululand Districts.
Madadeni Hospital (classified as Regional Hospital) is rendering level 1, 2 and 3 services. There is only one small District Hospital (52 beds) in Amajuba District (Emadlangeni Municipality).
Low efficiencies of the previous SANTA Hospitals and some Specialised Psychiatric Hospitals are a concern that will be addressed as part of the rationalisation of hospital services in the coming MTEF.
Job creation: Since January 2011, the Department created a total of 6 071 jobs excluding positions that were advertised under various professional categories.
A total of 438 positions were advertised for Basic Life Support personnel in 2012/13. This is in addition to 332 positions that were created and filled by unemployed Basic Life Support personnel in 2011/12.
A total of 100 Tradesman’s Aids posts have been filled in June 2012 as part of the District Maintenance Team Project. Local maintenance teams are recruited for maintenance and repairs at health facilities to reduce the backlog of infrastructure minor works, to improve hotel aspects of facilities, and improve quality control in line with the “Make Me Look Like a Hospital” project and National Core Standards.
9 800 CCGs had their contracts renewed from April 2013 contributing to employment in the Department and reduction in the vacancy rate. As part of the Provincial Youth Community Ambassador Programme the Department created career opportunities in Nursing, Nutritional Advisors (10 appointments), Orthotics/ Prosthetics Technicians (30 appointments), and Clinical Associates (8 appointments). Potential candidates have the option to apply for bursaries from the Department.
The PHC headcount increased with 6.1% (1 795 909) between 2011/12 and 2012/13. Children under 5 years constituted 16.3% of the total headcount in 2012/13. The Provincial Department of Health remains the main provider of PHC services (83%), followed by Local Government (15.5%), State Aided providers
(0.9%), Non Profit Organisations (0.2%), and other (0.05%).
Clinics, with attached PHC Teams, show an upward trend in patient activity (14.7% in 2012/13) compared to the average provincial increase of 6.1%. The distinctive decline in the number of patients accessing PHC services at hospital level (cases not referred) and corresponding incline in the number of patients utilising services at clinic level is noteworthy to improved PHC and positive behaviour change in the utilisation of health services (appropriate entry of the health care system).
Forty-seven (47) LG clinics were provincialised during 2012/13. Clinics in the eThekwini Metro and Umhlathuze Municipality has not been provincialised and continued to render services through a Service Level Agreement.
Table 10: National and Provincial Priorities Customised Key Actions 2014/15
(National Department of Health)
Strategies and Interventions for 2014/15 (KwaZulu-Natal Department of Health)
National Sub-Outcome 1: Prevent and reduce the disease burden and promote health
Maternal, Neonatal, Child & Women’s
Health and Nutrition
Prevention of Mother-to-Child-Transmission of HIV (PMTCT).
Basic Antenatal Care (BANC).
Preventative services and growth monitoring.
Cervical cancer prevention and screening.
Maternal, Neonatal, Child & Women’s Health and Nutrition
“Reaching 3 Million Women and Young Girls with Sexual & Reproductive Health Services by 2015” Campaign. Primary target Grade 8 and 9 girls; and Secondary target all women in reproductive age group.
Human Resources for Maternal and Child Health focusing on:
- Clustering of Hospitals for improved Caesarian Section outcomes.
- Piloting revised CCG Scope of Practice for MCWH.
- Clinical Associates within the MCWH context.
- Advanced Midwifes (quality of care).
Harmonisation of EMS services and identified District Hospitals and delivery facilities.
Integrated management of ANC patients inclusive of TB and HIV treatment at point of care.
Management of obstetric cases.
HPV vaccination. Child survival
Community level: CIMCI and Phila Mntwana.
Customised Key Actions 2014/15 (National Department of Health)
Strategies and Interventions for 2014/15 (KwaZulu-Natal Department of Health)
Access to ART.
Interventions to reduce HIV mortality.
Medical Male Circumcision (MMC) as part of the male sexual and reproductive health
programme.
Hlola Manje Zivikele Campaign – testing for HIV at least once a year, screening for TB and contraceptives for unwanted pregnancies.
Anti-Sugar Daddy Campaign - community dialogues targeting men, truck and taxi industry, business sector, traditional leadership and youth.
MMC – Inter-sectoral and Traditional Leadership collaboration.
ART programme. Post-Exposure Prophylaxis. TB TB treatment outcomes. Reduce TB mortality. TB
Community-based management of MDR-TB (Injection Teams).
Roll-out of GeneXpert Technology.
Infection prevention and control in facilities.
TB prevention in children.
Improve efficiencies at ex Santa TB Hospitals. Non-Communicable Diseases
Intersectional collaboration with focus on 6 pillars of healthy lifestyles.
Cataract surgery.
Inter-sectoral response against violence and injury.
Non-Communicable Diseases
Integrated Chronic Disease Management Model.
Human resource strengthening (task shifting, mentoring & development).
Medicine supply, pre-dispensing and distribution at community level.
Adherence to treatment - “Mpilonde”/ support groups.
NCD surveillance systems. Malaria
Early diagnosis and treatment
Research to monitor drug efficacy. Social determinants of health
Integrated ward-based services through Operation Sukuma Sakhe.
Municipal Health Services including access to water, sanitation, and control of wasted and hazardous substances, Food Safety and Control and Vector Control.
Technical support and M&E for Municipal Health Services.
National Sub-Outcome 2: Health Facility Planning
Development and
implementation of long term health plans.
Norms and standards for health facilities infrastructure.
Teams of engineers in the building industry.
Innovation projects e.g. alternative options to replace requirements for new facilities.
Re-directing funding towards maintenance.
Delivery/ procurement models that are non-capital intensive.
Integrated Management Tool (project management).
National Sub-Outcome 3: Improved financial management in the health sector
Audit findings from
Auditor-General of South Africa (AGSA). Audit findings from AGSA. Cost centres.
National Sub-Outcome 4: Efficient health management information system for improved decision making
National integrated patient-based information system in accordance with the Normative Standards Framework.
Data management systems, processes and tools.
Information technology including Telemedicine (eHealth and mHealth).
Performance-based monitoring and evaluation.
Research for health.
Evidence-based planning.
National Sub-Outcome 5: Improved quality of care
Office of Health Standards Compliance.
Compliance with National Core
National Core Standards.
Decentralised training model in collaboration with UKZN.
Customised Key Actions 2014/15 (National Department of Health)
Strategies and Interventions for 2014/15 (KwaZulu-Natal Department of Health) Standards.
Patient satisfaction with public health services.
National Sub-Outcome 6: Implement Re-engineering of PHC
Ward-based outreach teams.
School health services.
District Clinical Specialist Teams.
Community-Based Rehabilitation.
Re-engineering of PHC.
Integration through Provincial Growth and Development Plan.
Alternative models of service delivery.
National Sub-Outcome 7: Universal health coverage
Building blocks of NHI.
National Pricing Commission to regulate health care in the private sector.
NHI in 3 pilot districts.
Linking NHI sites with other districts for accelerated implementation of good practice models.
Research to inform alternative models of service delivery.
National Sub-Outcome 8: Improve Human Resources for Health
Production of Human Resources of Health.
Norms for the provision of Human Resource for Health.
Produce, cost and implement Human Resource for Health Plans.
Appropriately qualified and adequately skilled CEOs are appointed in all hospitals.
Decentralised training model with PHC focus in collaboration with UKZN.
Mid-level Worker and Clinical Associate programme(s).
HR gap analysis and costing of proposed structures in collaboration with HEARD and UKZN.
Alignment of Provincial/District HR Plan(s) with Human Resource for Health Strategy (including Essential Post List).
Human Resource Development and Training with specific emphasis on identified skills gaps.
Recruitment of Hospital CEO’s in accordance with re-classification of hospitals.
Consolidate monitoring and evaluation.
EMS and FPS human resource needs to support turnaround strategies.
Develop, adopt and implement alternate models for service delivery to address human resource shortages in peri-urban and rural areas.
1.2
LEGISLATIVE MANDATES AND NEW POLICY INITIATIVES
1.3
OVERVIEW OF THE 2013/14 BUDGET AND MTEF ESTIMATES
In 2011/12, the Department over-spent by R122.022 million, attributed to ongoing processing of various categories of OSD, filling of critical posts required for restructuring of service delivery, increased payments to the National Health Laboratory Services related to an agreement to increase the monthly payment from R34 million to R43 million (backdated to January 2011), and once-off payment of R50 million towards HIV and AIDS costs, as per a special request from the National Department of Health.
An amount of R81.838 million was included against Provincial roll-overs, being an approved roll-over of R63.953 million from 2009/10, of commitments relating to the Hospital Revitalisation component of the Health Facility Revitalisation Grant, which was under-spent in 2009/10, and a roll-over of R17.885 million from 2010/11 in respect of the Comprehensive HIV and AIDS Grant.
In 2012/13, the Department received provincial cash resources of R252.320 million including: R12 million for an immunisation campaign to
reduce child morbidity and mortality. R6.250 million to improve the Departmental
PABX telecommunication systems. <