2016
Consideration behavior and design decision
making
Minhua Long
Iowa State University
Follow this and additional works at:
https://lib.dr.iastate.edu/etd
Part of the
Advertising and Promotion Management Commons,
Engineering Commons, and the
Marketing Commons
This Dissertation is brought to you for free and open access by the Iowa State University Capstones, Theses and Dissertations at Iowa State University Digital Repository. It has been accepted for inclusion in Graduate Theses and Dissertations by an authorized administrator of Iowa State University Digital Repository. For more information, please [email protected].
Recommended Citation
Long, Minhua, "Consideration behavior and design decision making" (2016).Graduate Theses and Dissertations. 14974.
by
Minhua Long
A dissertation submitted to the graduate faculty in partial fulfillment of the requirements for the degree of
DOCTOR OF PHILOSOPHY
Major: Mechanical Engineering
Program of Study Committee: William R. Morrow, Co-Major Professor Baskar Ganapathysubramanian, Co-Major Professor
Erin F. MacDonald Zhijun Wu Leigh Tesfatsion Glenn R. Luecke
Iowa State University Ames, Iowa
2016
TABLE OF CONTENTS
LIST OF TABLES . . . vi
LIST OF FIGURES . . . vii
NOMENCLATURE . . . ix
ACKNOWLEDGEMENTS . . . xii
ABSTRACT . . . xiv
CHAPTER 1. INTRODUCTION . . . 1
1.1 Design Decision, Consumer Behavior, and Energy Policy . . . 1
1.2 Challenges from Reality: Complex Consumer Behaviors and Considerations . . 2
1.3 Contributions . . . 5
CHAPTER 2. BACKGROUND REVIEW . . . 8
2.1 Classic Discrete Choice Models . . . 8
2.2 Data Resource: Revealed Preference and Stated Preference . . . 11
2.3 Decision-Based Design and the Integration of Consumer Models . . . 12
2.4 Non-compensatory Behavior and Consideration . . . 15
2.5 Consider-Then-Choose Models . . . 16
2.6 Methods of Estimating Consideration Models . . . 19
2.7 Improvement of Predictive Power . . . 20
CHAPTER 3. CONSIDERATION AND DESIGN OPTIMIZATION . . . 22
3.1 Introduction . . . 22
3.3 NLP Methods . . . 24
3.3.1 NLP with Smoothing . . . 26
3.3.2 NLP with Complementary Constraints . . . 26
3.4 GA Methods . . . 28 3.4.1 Penalized GA (P-GA) . . . 28 3.4.2 Constrained GA (C-GA) . . . 30 3.5 Example . . . 31 3.5.1 Choice model . . . 31 3.5.2 Engineering Model . . . 32 3.6 Results . . . 33 3.6.1 Computational Details . . . 33 3.6.2 Feasibility . . . 34 3.6.3 Optimality . . . 34 3.7 Discussion . . . 37
CHAPTER 4. CONSIDERATION AND DESIGN INFORMED BY RE-VEALED PREFERENCE . . . 38
4.1 Introduction . . . 38
4.2 Consider-Then-Choose Models . . . 41
4.3 Case Study: Vehicle Design Under Body Style Screening . . . 45
4.3.1 Synthetic Behavior . . . 45
4.3.2 Market Share Simulation . . . 47
4.4 Choice Models . . . 48
4.4.1 Multinomial Logit Model (MNL) . . . 49
4.4.2 Random Coefficients Logit Model (RCL) . . . 50
4.4.3 Nested Multinomial Logit Model (NML) . . . 51
4.4.4 Consider-Then-Choose Logit Model (CTC) . . . 52
4.4.5 Connecting Nested Logit with Consideration . . . 53
4.5 Design Optimization . . . 54
4.5.2 Formulation and Solution . . . 56
4.5.3 Genetic Algorithm Scheme . . . 57
4.6 Results . . . 58
4.6.1 Predictive Power . . . 58
4.6.2 Decision Bias and Variance . . . 59
4.6.3 Decision Profitability . . . 62
4.6.4 Pricing-On-Offering . . . 63
4.7 Discussion and Limitations . . . 64
4.8 Conclusions . . . 68
CHAPTER 5. CONSIDERATION AND DESIGN INFORMED BY STATED PREFERENCE . . . 71
5.1 Introduction . . . 71
5.2 Background and Literature Review . . . 73
5.2.1 Consideration models versus choice models . . . 73
5.2.2 Consideration modeling methods . . . 75
5.3 Synthetic Experiment . . . 75
5.3.1 Pre-specified behaviors . . . 76
5.3.2 Consideration Models and Adaptive Surveys . . . 79
5.3.3 Choice Models and Discrete Choice Surveys . . . 81
5.3.4 Product Line Design . . . 82
5.3.5 Performance Measures . . . 84 5.4 Results . . . 86 5.4.1 Predictive Power . . . 86 5.4.2 Optimal Portfolios . . . 87 5.4.3 Profitability . . . 89 5.5 Discussions . . . 90 5.6 Conclusions . . . 91
CHAPTER 6. ENHANCING HYBRID VEHICLE ADOPTIONS WITH CONSIDERATION MODELS . . . 95
6.1 Introduction . . . 95
6.2 Maximizing Consideration in the Competing Market . . . 96
6.2.1 Synthetic Market . . . 96
6.2.2 Consideration Models . . . 97
6.2.3 Maximize the Consideration of Hybrid Vehicles . . . 98
6.3 Results . . . 98
6.3.1 Impact of the Optimal Strategy . . . 98
6.3.2 Substitution Pattern . . . 100
6.3.3 Changing the Consideration Rules . . . 101
6.4 Discussions . . . 102
6.5 Conclusions . . . 103
CHAPTER 7. CONCLUSIONS AND FUTURE WORK . . . 106
7.1 Conclusions . . . 106
LIST OF TABLES
Table 2.1 Decision based design practices with discrete choice models . . . 13
Table 2.2 Recent consider-then-choose models constructed from stated preference data . . . 21
Table 4.1 Recent consider-then-choose models constructed from stated preference data, compared to compensatory models estimated in the same study . 44 Table 4.2 Percentage of respondents accepting the given body style, as reported in Dzyabura and Hauser [2011]. . . 46
Table 4.3 Means and Variances of random coefficients (ˆθ’s) in synthetic population utility function, Eqn. (4.7) . . . 46
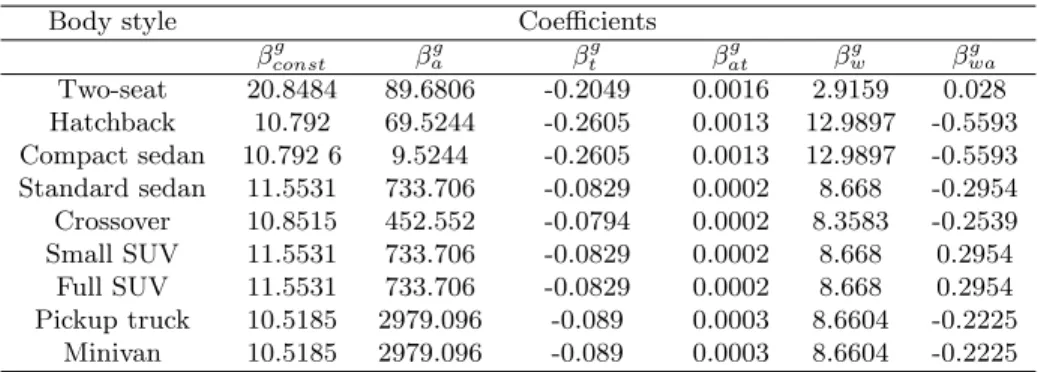
Table 4.4 Coefficients in fuel consumption function for each body style . . . 55
Table 4.5 Coefficients in cost function for each body style . . . 55
Table 4.6 Vehicle curb weight for each body style . . . 56
Table 5.1 Attributes and levels for the new vehicle case study . . . 77
Table 5.2 Part-worths structure of the pre-specified compensatory stage MNL model parameters for the synthetic population . . . 78
Table 5.3 Models and their survey questions and estimation methods . . . 80
Table 6.1 The optimal removed and added vehicle portfolios in the consideration maximization problems with subset-conjunctive screening population . 100 Table 6.2 The optimal removed and added vehicle portfolios in the consideration maximization problems with aspirational screening population . . . 100
LIST OF FIGURES
Figure 1.1 Consideration decisions and compensatory comparisons . . . 4
Figure 2.1 Flowchart of decision based design framework . . . 14
Figure 3.1 Two classes of NLP methods to handle discontinuous non-compensatory choice probabilities . . . 25
Figure 3.2 Empirical CDF of solution profits found relative to the best-known profit in two cases . . . 35
Figure 3.3 Solution times for Eqn. (3.20) of various sizes . . . 36
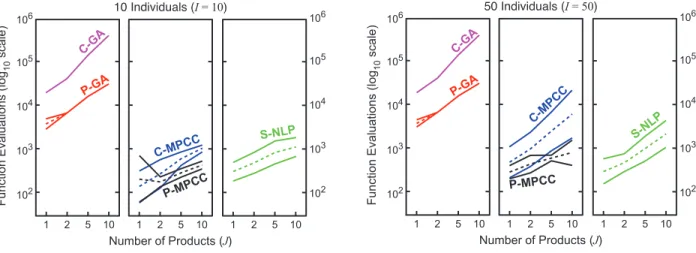
Figure 3.4 Function evaluation counts for Eqn. (3.20) of various sizes . . . 37
Figure 4.1 Kullback-Leibler Divergence (KLD) of predicted choice probability dis-tribution from true behavior . . . 60
Figure 4.2 Design error, measured as in Eqn. (4.31), for all models over all numbers of markets observed . . . 62
Figure 4.3 Percent of ideal profits obtained by designs and prices under true be-havior recovery when choosing designs and prices with estimated models 69
Figure 4.4 Percent of ideal profits obtained by designs chosen using estimated mod-els, but optimizing prices for these designs with knowledge of the true choice behavior . . . 69
Figure 4.5 Expected design error (left) and expected Profit Error (right) versus Kullback-Leibler divergence of choice prediction . . . 70
Figure 5.1 Simulation framework flowchart . . . 76
Figure 5.3 Predictive power measured by relative likelihood in 25 validation sets. The results are grouped by the number of alternatives per question in the validation sets . . . 87
Figure 5.4 The degree of commonality indices of the optimal portfolios and the representative optimal portfolios . . . 92
Figure 5.5 The degree of commonality indices of the optimal portfolios and the representative optimal portfolios . . . 93
Figure 5.6 Percentage of ideal profit versus relative likelihood compared across four estimated models, pre-specified ”true” behavior model and null model 94
Figure 5.7 Percentage of actual profit exceeding model expectation versus market share exceeding model expectation . . . 94
Figure 6.1 The change of consideration of Ford hybrids in subset-conjunctive screen-ing population after addscreen-ing the new design . . . 104
Figure 6.2 The change of consideration of Ford hybrids in aspirational screening population after adding the new design . . . 104
Figure 6.3 The impact of ”remove and add” strategy to the substitution pattern of hybrid vehicles . . . 105
NOMENCLATURE
ui,j Utility of productj for individual i
βi Part-worth coefficient vector for individual i i,j Error term in utility of product j for individual i PjM N L Choice probability of multinomial logit model
PRC
j Choice probability of randon coefficient logit model PjN M L Choice probability of nested logit model
Pj|Bk(j) Choice probability of productj conditional on nest Bk
λk Log-sum coefficient that indicates the correlation of unobservable factor between
prod-ucts within nestk
Cr Consideration set defined by screening rule labelled asr
s Consideration screening rule xj Feature vector of productj
X feature matrix consisted ofxj pj Price of productj
p Price vector consisted ofpj
Pi,jCT C Choice probability of consider-then-choose model
Pj|Cr Choice probability of productj conditional on consideration setCr PCr The probability that consideration set Cr is formed
π(.) Profit furnction in design optimization problem
c(.) Cost function in design optimization
cEj(.) Equality constraints in design optimiation cIj(.) Inequality constraints in design optimization l Lower bounds of design variables
u Upper bounds of design variables b body style indices vector, size ofJf cb(.) body-style specific unit cost function
Le,b body-style specific fuel economy lower bound Ue,b body-style specific fuel economy upper bound La,b body-style specific acceleration lower bound Ua,b body-style specific acceleration upper bound
θ Coefficient vector in consumer models
θe Part-worth coefficient of fuel economy θa Part-worth coefficient of acceleration time θp Part-worth coefficient of price
θb coefficient of body style b θ0 outside good coefficient
α(sr) The probability that an individual in the population has screening rulesr
∆ Binary coded genome consisted of body style feature vectors of a product line in genetic algorithm
I Number of individuals in Monte-Carlo sampling
Jf Number of products in the product line owned by firmf Jm Number of products in choice setm
Nm Number of choice observations in choice setm M Number of choice sets
KLD Kullback-Leibler divergence
nb Number of vehicles that have body style bin a product line
vi Coefficient vector in the aspirational model sampled for synthetic individual i γi Aspiritional limit in aspirational model
δi Binary screening rules in conjunctive+ screeening sampled for individual i A Number of attributes in a product profile
K Number of acceptable attributes that a product should at least have to be considered w Coefficient vector in the estimated aspirational model
yn Consider or reject response in observationn
||.||2 Two-norm
PLCL
j Choice probability of latent class logit model
PjLCL|q Choice probability of procutj conditional on class q αq The probability that an individual belongs class q
RL Relative likelihood
DCI Degree of commonality index
Φk The number of immediate parents that feature levelk has in the DCI metric
ACKNOWLEDGEMENTS
First, I would like to acknowledge the direct contributions to the work presented in this dissertation. The methodology and computation framework presented in Chapters 3, 4, and 5 contain tremendous contributions from Dr.W.Ross Morrow at Ford Research Center who was an assistant professor at Iowa State University. Professor Erin MacDonald at Stanford has greatly contributed to my understanding and designing the simulation experiments leading to Chapters 4, 5 and 6. These chapters also use survey algorithms and results graciously provided by Professor Daria Dzyabura (NYU Stern School), Professor John Hauser (MIT), and Professor Erin MacDonald. Mohammad Aslani offered considerable help during the implementation of engineering models in Chapter 4. The synthetic vehicle market profiles used in the simulation of Chapter 6 are based on the raw data sets previously organized by Josh Mineroff. Michael Erickson has contributed to collect the vehicle information during the usage of the data.
I would like to express my gratitude to my advisor Dr.Morrow for his guidance and help during the graduate program. His great intuition and rigorous attitude in mathematics and computations have brought joy in the research discussions. I cherish the moments walking out of his office after a meeting, where I experienced that a rough idea turned into rigorous math language. My sincere thanks also go to Professor MacDonald who provided valuable advice and support on the consumer modeling research. Her intuition and foresight have directed the simulation research to reflect interesting front edge real world topics. I would like to thank my POS committee for their insightful comments on this research. I am grateful for the generous support from Professor Baskar Ganapathysubramanian towards the end of this program. His profound experience in computation also provided concise and insightful advice related to genetic algorithm during the publication of Chapter 4. I am thankful for Professor Zhijun Wu and Professor Glenn Luecke for their courses that gave me theoretical and practical foundations to carry on my research in this program. I sincerely thank Professor Leigh Tesfatsion for her insight comments and questions on my research projects, which widened my understanding of
consumer modeling from various economic perspectives. The lessons and experiences I learnt from my POS committee will continue to shed light on my research thinking in the future.
Besides my committee, I would like to thank my colleagues and friends who provided support and encouragement along these years. Thank you, Josh, for inspiring me with the energetic discussions and the attitude of saying ”yes” to challenges. Thank you, Mohammad, for fighting with me against the issues on coding and debugging in the Black Engineering basement. I also greatly appreciate the help from Jinjuan She, Le Chen, Ping Du, and Micheal Erickson from Professor MacDonald’s lab, who shared experience on writing and survey designs. I am also thankful for the warm office environment created by Professor Mark Wright and his students in the last year of this program.
I thank my family for their unconditional love and support in my journey: my mother has been believing in who I am and what I choose, and my father has given me courage in front of the unknowns. I also would like to thank my host mother Miriam Patterson who opened her house and arms to me during the tough times.
ABSTRACT
Over the past decade, design engineering has developed a systematic framework to coor-dinate with consumer behavior models. Traditional consumer models applied in the past has mainly focused on the preference of compensatory trade-offs in the choice decisions. Recent marketing research has become interested in developing consumer models that are ”representa-tive” in that they reflect realistic human decision processes. One important example is consider-ation: the process of quickly screening out many available alternatives using non-compensatory rules before trading off the value of different feature combinations. This research investigates the impact of modeling consideration behavior to design engineering, aiming at constructing consideration models that can inform strategic decisions. The study includes several features absent in existing research: quantifying the mis-specifications of the underlying choice process, tailoring survey instruments for particular models, and exploring the models? strategic value on product profitability and design decisions.
First, numerical methods are explored to address the discontinuity in the profit-oriented optimization problem introduced by the consideration models. Methods based on complemen-tarity constraints, smoothing functions, and genetic algorithms are implemented and evaluated with a vehicle design case study. Second, a simulation experiment based on synthetic market data compares consideration models and a variety of conventional compensatory choice models in model estimation and design optimization. The simulation finds that even when estimated compensatory models provide relatively good predictive accuracy, they can lead to sub-optimal design decisions when the population uses considerations; convergence of compensatory models to non-compensatory behavior is likely to require unrealistic amounts of data; and modeling heterogeneity in non-compensatory screening is more valuable than modeling heterogeneity in compensatory trade-offs. The synthetic experiment framework then further extends the comparison to include the survey design process guided by the different assumptions behind consideration models and traditional choice models. A product line design case study reveals
that even though both choice models and consideration models show robustness in profitabil-ity, using consideration models leads to optimal portfolios with higher feature diversity and reducing the risk of overestimating profits. Finally, the research explores how to use consider-ation models to analyze the market penetrconsider-ation of a new designed product in a hybrid vehicle adoption case study.
It is the hope that this research can arouse the attention of designers to the informative power of consideration models, expand the understanding of consumer behavior modeling from the predictive power to the strategic impacts to design decisions, and provide technical supports to the future application of consideration models in design engineering.
CHAPTER 1. INTRODUCTION
1.1 Design Decision, Consumer Behavior, and Energy Policy
Engineering designers are faced with growing challenges of coordinating consumer needs and policy regulations. The design activity in vehicle industry is a typical example. Since 1975, the energy regulation program Corporate Average Fuel Economy (CAFE) standards has served to maintain energy secure by penalizing the manufacturers who fail to meet minimum targets for sales-weighted average fuel economy. In addition, since becoming federal requirements in the late 1960s, the emission standards managed by Environmental Protection Agency (EPA) exert increasingly stringent limits on pollutant emissions based on Federal Test Procedure. Seemingly, both higher fuel economy and lower emission meet the consumers needs for a cleaner vehicle with lower fuel cost. Yet, the design decisions concerning these two development directions are not straightforward for two reasons. First, conflicts between these two development directions occur in the engineering constraints. Second, consumers also balance between mutually connected factors such as price, driving experience, body type, capacity, and safety. For example, diesel engines enjoyed the popularity of providing more torque and higher fuel economy than the gasoline engines. However, the cost of reducing the emission level to comply with the same standard level for diesel engines is higher than that needed for gasoline engines [Sanchez et al. 2012]. Gasoline engines, on the other hand, compete against diesel engines with lower pollutant emissions, with the additional help of the tax imposed on diesel fuel. As the new generation of hybrid powertrain technologies arises, the options for high fuel economy and low emission enter the sight of consumers. But the cost of the hybrid technologies and the cognitive barrier on the trust of the new technology are two drawbacks. In this illustrative example, vehicle manufacturers have to face the challenging design decisions such as making bets on engine types and the related technologies that reduce emission without sacrificing the performance on
fuel economy and other product features, so that they can attract consumers.
In fact, designers and policy makers have noticed the important role of consumer model-ing - the achievement of the entrepreneur value such as profit closely relates to the purchase decision, and policy incentives or regulations cannot have meaningful impacts without acting through products adopted by consumers. In the past decades, significant attention has been paid on capturing the relationship between the demand and the product features, as well as consumer preferences on the tradeoffs among the product features. One of the popular tools to achieve these two goals is discrete choice analysis (DCA). DCA introduces the concept of choice probability, which describes the chance of a consumer to choose a particular product from a given set of alternatives. DCA formulates the choice probability as a function of prod-uct features and consumers’ demographic information. The convenience of translating such choice probability into the market share prediction makes DCA an important component when informing energy policy making and design decision making. In the past applications, DCA was employed to explain the vehicle market share changes after the energy policy applied[Boyd and Mellman 1980, Goldberg 1995; 1998, Train and Winston 2007, Beresteanu and Li 2011] by capturing important tradeoffs such as those between fuel economy, vehicle size and price. On the engineering design side, DCA served as the demand component in a profit maximization framework. Combining engineering models such as cost models, performance constraints, and technical bounds, designers were able to identify the technical barriers and strategic changes of the automakers under policy regulations[Michalek et al. 2004, Shiau et al. 2009a, Whitefoot et al. 2011].
1.2 Challenges from Reality: Complex Consumer Behaviors and
Considerations
Two basic assumptions behind classic DCA models have permeated previous design engi-neering research: consumers evaluate a product with the holistic utility additively contributed by every product feature, and consumers make choice from a universal set of available products in the market. Concededly, these assumptions offer a foundation to capture consumer decisions on product feature trade-offs, as well as lead to some mathematical benefits during deriving
choice probability formulas. However, how consumers process product information in reality challenges these assumptions. Due to cognitive limitations, consumers may not carefully eval-uate every piece of product information, and their perception of a feature may not quantitively match the actual performance. In vehicle markets, the perception of fuel economy is a typical example. Allcott and Wozny [2012] observed a discount rate when estimating the contribution of fuel costs saving to hybrid choice. The discount rate indicated that consumers ”acted” as if they were only willing to pay $0.61 to reduce the future cost by one dollar. In a lab experiment, Larrick and Soll [2008] found that the fuel cost saving intuitively believed by the consumers was biased. They termed the phenomena as ”MPG illusion” in which people misunderstood the fuel cost as linearly related to MPG. Empirical evidences also uncovered that attribute like fuel cost saving may not participate the careful trade-off process during the buying decision. In a survey sampling 57 households in California conducted by Turrentine and Kurani [2007], the respondents were found not tracking their gas expenditures in general. Even for those who owned a hybrid vehicle, their decisions were stated to be more about values such as protecting environment and being pioneers in new technology rather than caring in saving money on gas. Whether the benefit of tax credit is evaluated in the hybrid choice is also questionable. For ex-ample, according to the state-level hybrid sales statistics, in Colorado and Pennsylvania, there were over 30% eligible hybrid purchasers who did not claim their income tax credits [Gallagher and Muehlegger 2011], which made it less convincing that consumers would universally account for tax credits in the feature tradeoffs.
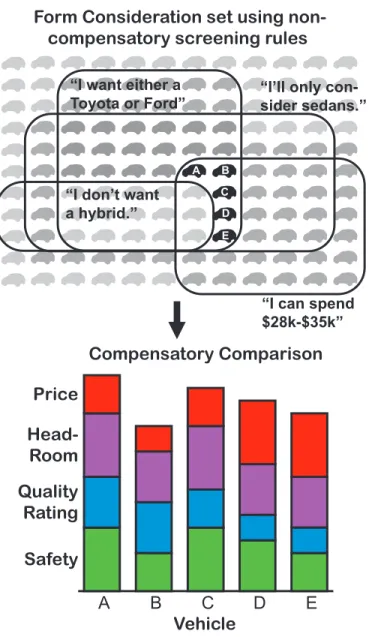
Consideration is an important type of complex behaviors that describes a frugal and quick screening process before the consumer will make careful evaluation and comparion among the remained products [Roberts and Lattin 1997, Hauser 2014]. Fig.1.1illustrates this process with a vehicle purchase example: when facing with a large number of vehicle options, a consumer first narrows down to five options via the screenings of brand, body type, powertrain, and price; among the five options, the consumer then compares the utilities of price, head-room, quality rating, safety in an additive manner as assumed by the traditional DCA models. The consideration screening process differentiates itself from the comparison process in two aspects. First, consideration reflects non-compensatory decision making, which means that unacceptable
features cannot be compensated by other attractive features. Second, the non-compensatory screening leads to only a subset of products considered by the consumer instead of a universal choice set assumed by the conventional models.
A B C D E A B C D E Vehicle Safety Quality Rating Head3 Room Price Compensatory Comparison “I(want(either(a Toyota(or(Ford” “I(can(spend $28k>$35k” “I’ll(only(con> sider(sedans.” “I(don’t(want a(hybrid.”
Form Consideration set using non3 compensatory screening rules
Figure 1.1 Consideration decisions and compensatory comparisons
These two structural differences of consideration models potentially reshape the understand-ing of design decisions. For example, when a household with children searches for a primary vehicle with enough passage capacity for the whole family, then body types such as two-seaters will be excluded, even if it has high fuel economy that the household also favors. Without understanding the non-compensatory property, a firm may wrongly make investments on
im-proving performance in product series that consumers do not consider. With the assumption that consumers choose from a subset of products, consideration models predict market shares and substitution patterns in a different viewpoint. When using consideration models, deci-sion makers expect sales only from the proportion of consumers who consider it, and foresee a product’s competition against the alternatives within the same consideration set. Ignoring considerations potentially over-simplifies market share and competition patterns, and eventu-ally misleads the design decisions. In the policy making perspective, identifying the screening rules used during vehicle purchases enhances the effectiveness of energy policies. For example, for consumers who do not consider hybrid vehicle because of price, financial incentives may nudge their considerations. However, for those who reject hybrids because of vehicle engineer-ing features, perhaps more effective strategy is encouragengineer-ing vehicle industry to design hybrid vehicles without sacrificing performance features that consumers screen on. Policy makers can also find opportunity to enhance hybrid adoptions by directly changing the screening rules via informational strategies such as role models and social orientations.
1.3 Contributions
The dissertation aims to bridge the gap between the current understanding of consideration models and the practical usage of consideration models in design engineering and energy policy analysis:
First, optimization tools are provided to handle the numerical difficulty in integrating con-sideration models in the design framework. While concon-sideration models capture more realistic non-compensatory screenings in decision process, the non-compensatory property introduces discontinuous choice probability into the optimization problem. Such discontinuity causes ob-stacles to the usage of derivative-based methods during searching for optimal solutions. This research offers treatments to get over these obstacles by implementing and testing two classes of methods - nonlinear programming methods and genetic algorithms.
Second, the impact of consideration models on design decisions is identified by comparing consideration models and traditional compensatory models. The model performance evaluation quantifies not only the predictive accuracy in consumer choices, but also the differences of design
features and the strategic value of the designs. The model comparison aims at communicating between designers and marketers on their understanding of model applications. For designers, it is the goal to show new opportunities of using more descriptive consumer models, and the consequences of using traditional models when consumers are actually using non-compensatory screenings. For marketers, this research serves to broaden their view of consumer modeling from predicting choice observations further to guiding strategic outcomes in design applications.
A simulation framework is constructed to investigate model mis-specifications, i.e. the in-consistency between the model assumptions and the behavioral mechanism behind the data. The real world datasets are unable to quantify mis-specifications, because the complete behav-ioral mechanism is unknown. This research creates a synthetic experimental environment where mis-specifications can be controlled to focus on the consumer behavior of interest. Compared to synthetic experiments in the past that only focused on model estimations, the experiments in this research particularly simulate the model application in the design process. The simulation also takes into account how the assumptions of a model affect the data collection process.
Finally, new design objective and new analysis tools are explored to utilize consideration stage information. In the conventional profit-driven optimization framework, it is natural to measure the strategic impact of a design as profitability. However, consideration models offer new information such as the consideration sets formed by different types of individuals in a population. One goal of this dissertation is to present new angles to analyze competitions and substitution patterns based on the consideration sets.
The remaining chapters are organized as follows: Chapter 2 reviews conventional discrete choice models, and their applications in the decision based design framework. The considera-tion models will be also introduced in a general manner. Chapter 3 reveals the numerical diffi-culty in applying the two-stage consider-then-choose models in design optimization problems. This chapter implements a variety of treatments and evaluates their performances. Chapter 4 constructs a synthetic data simulation to investigate the consequences of using mis-specified compensatory models and consideration models in the estimation and design processes. The investigation discusses multiple performance measures, including predictive power, design fea-ture difference, and profitability. Chapter 5 extends the simulation to include the survey design
process tailored according to different model assumptions. Chapter 6 explores new design ob-jectives and analysis approaches particularly for using consideration stage information with an illustrative case of enhancing hybrid vehicle adoptions. Chapter 7 concludes and discusses open questions.
CHAPTER 2. BACKGROUND REVIEW
2.1 Classic Discrete Choice Models
Classic discrete choice models describe the probability an individual consumer chooses a product from a set of available alternatives. Given the set of alternativesJ, the characteristics of the alternatives and the demographic information of the consumer, a random utility is as-signed to each of the alternatives which consists a representative component and an unobserved disturbance. The utility of productj for individuali is modeled as:
uij =βTi yij+ij (2.1)
where βi are coefficients indicating the taste of the consumer,yij are information of
prod-ucts attribute and the demographic information, for example pricej
incomei. In the representative
component, product attributes are weighted and contribute to the utility in an additive form. Classic discrete choice theory assumes a product is chosen by an individual when its random utility is the maximum among all the available alternatives. The models that follow this as-sumption are called Random Utility Maximization models (RUM) [Block and Marschak 1960, Manski 1977]. From this assumption, together with the prior beliefs of the distribution of the random terms, a variety of formula of the choice probability can be derived. Three typical models are reviewed in the follows.
Multinomial Logit Model
When the disturbance terms are iid distributed extreme value over all individuals and all alternatives and the utility coefficients vectorβ is identical across all individuals, it yields the
Logit model. The choice probability takes the form [McFadden 1974]:
PjM N L = P expuj
k∈J expuk
(2.2)
Although Logit model was built for a market where consumers have homogeneous taste, it is still a popular model in practice because it has a close form of choice probability and its likelihood function is globally concave [Maddala 1983].
Random Coefficients Model (Mixed Logit Model)
In random coefficients model (RC), the utility coefficients are randomly distributed across individuals. The most commonly assumed distribution of the coefficients are normal and log-normal distribution. Givenβ’s density functionf(β), the RC choice probability can be derived as the integral of logit choice probability overβ’s distribution:
PjRC = Z
PjM N L(β)f(β)dβ (2.3)
As this integral form does not have a close expression, Monte-Carlo sampling is needed to compute the choice probability. Despite of its computation complexity, mixed logit model allows high flexibility in taste variations, substitution patterns and correlation of unobserved disturbance over time. These advantages make mixed logit model popular in practice [Hensher and Greene 2003]. Furthermore, McFadden and Train [2000] have shown that this model can approximate any random utility model. In practice, however, the coefficients are typically assumed to be normally distributed [Nevo 2000].
Nested Logit Model
In a two-level nested logit model, alternatives are categorized into different predefined nests
B1,· · ·, BK, consumers are assumed to first pick one nest then choose a product from the nest.
For example, suppose there are vehicle alternatives from brands Honda, Toyota, GM, Ford, if the first level is categorized by foreign or domestic cars, then we will have nest B1 ={Honda, Toyota} nest B2 = {GM, Ford}, thus the consumer first pick a nest, for instance, domestic
cars, then choose between GM and Ford. In a nested model which presumes the nests are disjoint, the choice probability is the product of the nest level probability and the lower level choice probability within the nest:
PjN M L =Pj|Bk(j)·PBk(j) (2.4)
wherePBk(j) is the probability that nestBkis chosen andPj|Bk(j) is the conditional probability
that product j is chosen within the nest.
Denote the characteristics used to identify the nests are zik and the characteristics within
the nest level aswij, the condition choice probability within nest is the logit formula withwij
i.e. Pj|Bk(j) = expu(wij|β) P h∈Bkexpu(wih|β) (2.5) The choice probability of the nest also takes the logit formula:
PBk =
exp{Vk}
PK
k=1exp{Vk}
(2.6) with nest utility:
Vk=γTzik+λklog
X
h∈Bk
expuh (2.7)
The log-sum term in this formula carries the lower level features information into the choice of the nest. λk is referred as the log-sum coefficients which indicates the correlations of the
unobserved factor between products within nest k, with lower λ reflecting higher correlation. The formula reviewed here is from Daly [1987]. Another alternative formula was given by McFadden [1978]. The difference between two formulations is that McFadden’s model has the lower level within nest utility normalized by the log-sum coefficient λk. Dividing uh by λk is
required for consistency with RUM, but there is still debate about whether that is essential in the model [Train 2009].
2.2 Data Resource: Revealed Preference and Stated Preference
Discrete choice models can be estimated from two broad categories of data resources: re-vealed preference (RP) data and stated preference (SP) data. Rere-vealed preference data come from the real purchase observations and sales record. Besides the resource from aggregated sales, revealed preference data can be collected to have more specific information. For ex-ample, in Berry et al. [2004], a survey conducted by General Motor was used, in which a sample of real purchasers for each vehicle in 1993 model year was drawn for the questionnaire about household attributes. This sampling survey data supplemented pure macro observation of market shares.
Stated preference data are collected from designed choice experiments. In stated preference data, a choice experiment generally takes the following steps [Hensher 1994]: (1) identify a set of attributes with specified measurement and decide the number and magnitude of attribute levels; (2) design the combinations of attribute levels; (3) translate the designed combinations (profiles) into a survey that respondents can comprehend for data collection.
Both data resources have well-known strengths and downsides. For example, revealed pref-erence reflects realistic purchase habit but has difficulties in gathering sufficient information in product attributes and specific demographic information, while stated preference is important in obtaining information of attributes that are not available in the market and researchers can design and control the experiment specifically for the choice models being studied but the responses in stated preference may not closely match their actual preference [Wardman 1988]. To have the advantage of both RP and SP data in discrete choice modeling, there is a trend in combining both data resources in estimation. Adamowicz et al. [1994] has estimated a multinomial logit model from combined SP and RP data and found that combined information can overcome the preference inconsistency in independent usage of either data type. Empirical evidence also uncovered that the application of mixed logit model and the use of combined SP and RP data are mutually beneficial [Brownstone et al. 2000, Hensher 2008].
To collect stated preference data for discrete choice modeling, a choice or ranking survey is often used. The assumptions of the choice behavior not only influences the model structure, but also conduct the design of the discrete choice survey for estimation. One example is in the
evaluation of D-optimality, unlike the linear model where the efficiency only depends on the alternative features, the efficiency formula of the discrete choice models also depends on the choice probability [Kanninen 2002]. Therefore the prior beliefs of the estimated coefficients can influence the design of the survey [Sandor and Wedel 2001].
Desired properties of a discrete survey design include orthogonality (each attribute level appears an equal number of times in combination with all other attribute levels), level bal-ance (each level within an attribute appears an equal number of times), minimal overlap (the alternatives are prevented to have the same level for a given attribute) and utility balance (al-ternatives within a choice set should be equally attractive to respondents) [Huber and Zwerina 1996, Johnson et al. 2013]. The efficiency of a choice survey is also quantified by criteria such as D-efficiency [Kuhfeld et al. 1994], which is connected to maximum-likelihood estimation in a way that by maximizing the determinant of the inverse of the variance-covariance matrix, the joint confidence sphere around the complete set of estimated model parameters is minimized.
In achieving these properties, survey design methods vary. Methods based on orthogonal arrays can achieve level balance and orthogonality by systematically shifting levels on the basis of orthogonal arrays [Chrzan and Orme 2000, Street and Burgess 2007]. Sawtooth software system uses levels selection strategies that directly target to achieve level balance and level minimal overlap [Saw 2013]. Methods constructed to optimize D-efficiency can use candidate profile exchange algorithm. The Fedorov algorithm, which commercial software SAS based on [Kuhfeld 2010], is in this category. D-efficiency can be also locally optimized with heuristic procedures such as cyclically generating alternatives, swapping and relabeling attribute levels, and co-ordinate exchange algorithm [Huber and Zwerina 1996, Sandor and Wedel 2001, Yu et al. 2009].
2.3 Decision-Based Design and the Integration of Consumer Models
The idea of decision-based design (DBD) framework stems from the need to coordinate design teams within the same project who usually handle different aspects of information or requirements [Hazelrigg 1998]. In its early proposal, the framework emphasized on unifying a normative objective for a design project, and functionally mapping design alternatives into such
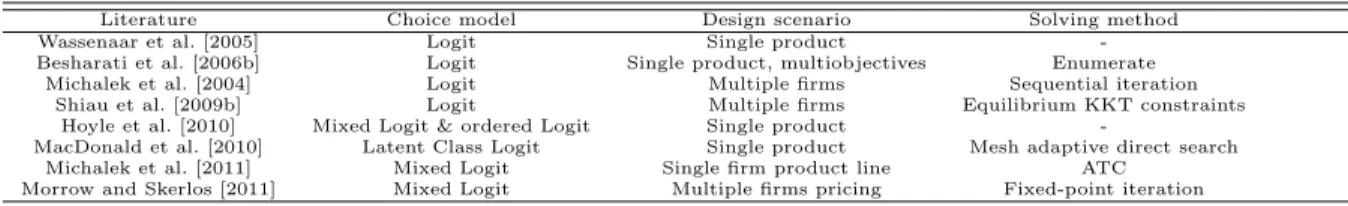
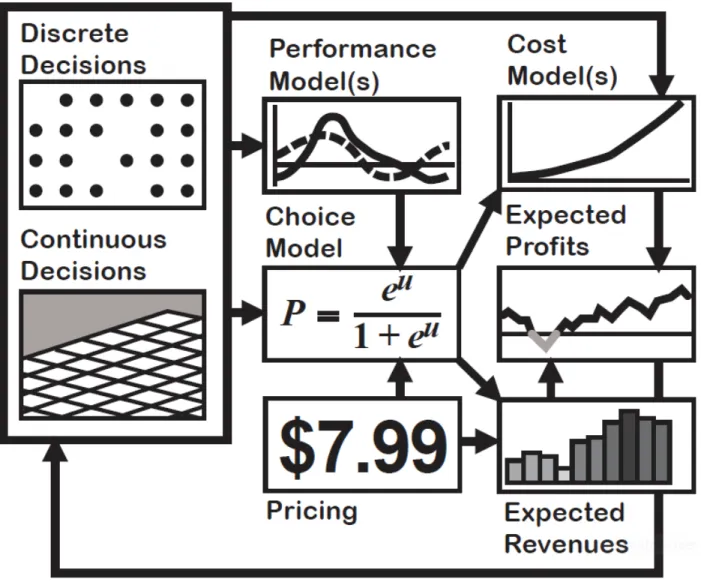
objective, so that designers can reach consistent decisions via optimization. The construction of framework adopted the views in information theory and engineering economics, in which the mapping between design alternatives and the objective reflected the nature of risk and uncer-tainty analysis in engineering and demand performances. The development of DBD actively grows in the past two decades. Engineering community has enriched this decision making tool in both case-specific applications and generalizable methodology study [Lewis et al. 2006]. One important stream in DBD is to specify the objective of product design as business value such as profit. In this interest, discrete choice models serve as a convenient tool in demand forecasting. The flowchart in Figure 2.1 illustrates the interactions between the engineering components and the market components in decision based design framework. The developments in DBD research are shown in three aspects : consumer models, design scenarios and the corresponding solving methods.
Table 2.1 Decision based design practices with discrete choice models
Literature Choice model Design scenario Solving method
Wassenaar et al. [2005] Logit Single product
-Besharati et al. [2006b] Logit Single product, multiobjectives Enumerate Michalek et al. [2004] Logit Multiple firms Sequential iteration
Shiau et al. [2009b] Logit Multiple firms Equilibrium KKT constraints Hoyle et al. [2010] Mixed Logit & ordered Logit Single product
-MacDonald et al. [2010] Latent Class Logit Single product Mesh adaptive direct search Michalek et al. [2011] Mixed Logit Single firm product line ATC
Morrow and Skerlos [2011] Mixed Logit Multiple firms pricing Fixed-point iteration
Table2.1lists relevant DBD research literatures where discrete choice models are employed. In the pioneer work of Wassenaar and Chen [2003] and Wassenaar et al. [2005] proposed a framework to include discrete choice models as demand modelling for decision-based design community, starting with the simple Logit model on a single product selection problem. Mod-els with more complexity are applied to meet the need of different market scenarios such as consumer heterogeneity [Michalek et al. 2011, Morrow and Skerlos 2011] and hierarchical choice [Hoyle et al. 2010].
The development of solving tools is often paired with the growing complexity of the design scenario considered in the problems. Analytical target cascading (ATC) is successfully applied in both single product and product line optimization problem [Michalek et al. 2011]. Design under competitive market has aroused the study of more complex optimization approaches. The associated solving approaches for multiple firms design under competitive environment
Figure 2.1 Flowchart of decision based design framework
includes: iterative approach in which each firm will sequentially maximize profit according to the updating competitors’ information until convergence [Michalek et al. 2004], equilibrium constraints approach where the KKT condition of the equilibrium is added in the optimization problem [Shiau et al. 2009b] and fixed point iteration approach where the equilibrium condition is formulated in a fixed-point form to prevent trivial solutions [Morrow and Skerlos 2011, Morrow et al. 2013].
2.4 Non-compensatory Behavior and Consideration
The classic compensatory models reviewed above shares the same assumption that decision makers will weigh and add all the alternatives information and maximize the utility. However, the concept of satisficing proposed by Simon in 1957 gave a different concept – a decision maker will stop searching for further options as soon as one alternative exceeds the minimum aspiration level. According to this view, decision makers need not examine all the options or examine all their features. This concept has been supported by abundant empirical studies in which respondents were revealed to use fast and frugal non-compensatory rules to elimi-nate options when faced with time pressure [Rieskamp and Hoffrage 2008], information cost [Br¨oder 2000] and memory requirement [Br¨oder and Schiffer 2003]. Decision makers can tailor different simple heuristics to adapt to different problem solving environment [Gigerenzer and Gaissmaier 2011]. The use of non-compensatory strategies such as conjunctive and disjunctive screening was captured with early protocol tracing techniques [Einhorn 1971]. Consideration strategies were found more likely to appear in some typical decision tasks. For example, Payne et al. recorded that compensatory process usually existed in the two-alternative comparison tasks, while the quick elimination of alternatives happened when the respondents were faced with multi-alternative task [Payne 1976]. Rieskamp et al. observed that under high time pressure, the participants are more likely to select a non-compensatory heuristic, particularly lexicographic screening [Rieskamp and Hoffrage 2008]. Brder et al. validated that when deci-sion tasks require memory search, respondents were more likely to use take-the-best strategy [Br¨oder and Schiffer 2003].
As an impact in marketing research, the awareness of the use of non-compensatory rules among consumers changed the traditional concept of choice set in discrete choice modelling. Instead of only assuming a universal choice set (with all the alternatives), the Consideration Set (a subset of the universal choice set) is studied [Roberts and Lattin 1997, Hauser et al. 2009]. Typical non-compensatory rules employed to form consideration set were discussed (see early concepts in [Dawes 1964, Einhorn 1970, Tversky 1972a]):
• Aspirational: the early idea was from [Simon 1972] who proposed the theory of bounded rationality, one of the examples was that decision makers will stop searching for options
once the benefit they obtain from an option exceed some ”aspirational limit”. Later this idea was translated into consideration modeling, see work from [Gilbride and Allenby 2004]. In aspirational screening, consumers will consider a product if the product ˜Os utility exceed some aspirational criteria.
• Conjunctive: a decision maker will consider an alternative only if all its features are acceptable. For example, If a consumer screens on hybrid and brand, a conjunctive rule will be ”I will consider a vehicle if it is hybrid AND it is Toyota”.
• Disjunctive: a decision maker will consider an alternative as long as one of its features is acceptable. For example, ”I will consider a Toyota OR a hybrid vehicle”.
• Subset conjunctive: a decision maker will consider an alternative if a certain number of its features are acceptable. For example, there are brand, price and hybrid three screening features and suppose the minimum number of acceptable features should be 2 for a vehicle to be considered, then a subset conjunctive rule can be stated as ”I will consider a vehicle if the vehicle is a Toyota hybrid OR if it is a hybrid with price under $25,000 OR if it is a Toyota under $25,000”.
• Disjunction of conjunctions: a decision maker will consider an alternative if it satisfies one or more than one sets of conjunctive rules. For example, also screening on brand, price and hybrid, a disjunction of conjunctions rule can be ”I will consider a vehicle if it is a Toyota OR if it is a hybrid under $25,000”.
• Elimination-by-Aspect: a decision maker successively chooses unacceptable feature levels and eliminates alternatives with those levels. For example if one order screening aspects as ”hybrid→price→brand ”, then the consumer will first eliminate non-hybrid vehicles then compare the candidates on the price, if the price is a tie, then move on to the brand.
2.5 Consider-Then-Choose Models
A general model representing consider-then-choose decisions can be described as follows. Suppose the universal choice set is J = 1, ..., J. Aconsideration set indexed by r = 1, ..., R,
denoted as Cr ⊂ {1, . . . , J} is defined by a set of screening rules sr = [sr,1, ..., sr,Lr]. For
conjunctive rules, it can be written as:
Cr=nj∈ {1, . . . , J} : sr(xj, pj,γ)≤0
o
(2.8)
This definition means that a product needs to satisfy the all the screening rules to be a member in the corresponding consideration set. An alternative form illustrating this is
Cr= n j∈ {1, . . . , J} : max l sr,l(xj, pj,γ)≤0 o (2.9)
The screening rules depend on product features xj, price pj and individual specific weights or
criteria γ. For example, a consideration set Cr = { all products j ∈ {1, ..., J} with price pj
under 20,000 dollars AND fuel economyej over 30mpg }can be defined by two screening rule
functions sr= [sr,1(xj, pj, γ1)≤0;sr,2(xj, pj, γ2)≤0] = [pj−20,000≤0; 30−ej ≤0].
For disjunctions, e.g. Cr={all productsj ∈1, ..., J with pricepj under 20,000 dollars OR
fuel economy ej over 30mpg }, the consideration set can be defined as:
Cr =nj ∈ {1, . . . , J} : min
l∈{1,...,Lr}
{sr,l(xj, pj, γl)} ≤0
o
(2.10)
Disjunctions of conjunctions can be formed by combining the min and max representations in Eqns. (4.2) and (4.3).
This structure is consistent with the forms used in marketing literatures. For example in Dzyabura and Hauser [2011], product features are binary coded, which can be transformed into the structure presented here.
Given a collection of screening rules and the associated consideration set, let the conditional probability that product j is chosen within the set be Pj|Cr and let the probability that the
consideration setCr is formed by PCr, then the choice probabilityPj can take the form of sum
up the joint probabilities cross all possible consideration sets.
Pj =
X
r
Note that this structure is been found similar to a nested logit model. Relative research can be seen in Swait [2001b] where the generalized nested logit formulation is used to model consideration sets by specifying the possible consideration sets as ”nests”. This work connected the consideration sets explosion models with the family of discrete choice models.
The conditional probability within the consideration set takes the form
Pj|Cr(X,p) = eu(xj,pj,β) eϑog+P k∈Cre u(xk,pk,β) ifj∈ Cr 0 ifj /∈ Cr (2.12)
The utility coefficients β can be assumed to be homogeneous across population or take the random coefficients form to include heterogeneity ( which requires a Monte-Carlo integral of the simple Logit form above ).
The representation of consideration set probability PCr were developed into different
spec-ifications in previous marketing research. Swait and Ben-Akiva [1987] introduced a random component into the screening rules function, so that with some assumed distribution of the random component,PCr can be derived based on the probability of each alternative’s
availabil-ity in this consideration set. Ben-Akiva and Boccara [1995] extended this random consideration set generation model by specifying the availability probability as Logit form. Instead of con-nectingPCr with parameterized screening rules, Chiang et al. [1999] assumed this consideration
set probabilities have a Dirichlet distribution across the population. Gilbride and Allenby [2004] avoided the enumeration of consideration sets by using a reduced form choice proba-bility which applied the Markov chain to identify the posterior distribution of the allowable screening criteria values.
The specifications reviewed above can work on choice data and can be estimated with clas-sical tools such as Maximum Likelihood Estimation (MLE) and Bayesian approaches. However the exponential growth of the possible consideration sets makes consider-then-choose models difficult to estimate in practice. This challenge motivated researchers to gather ”consider” stage information other than just using the final choice observations. For example, Jedidi and Kohli [2005] used ”acceptable/unacceptable” response data to estimate subset-conjunctive rule where the probability that a particular attribute level is acceptable were estimated and each level is
assumed to be independently perceived; this treatment allowed MLE method operate on the likelihood of an alternative is considered. Another example came from Dzyabura and Hauser [2011] who also presumed the binomial distribution for the screening rules to infer the most likely consideration pattern from the stated consideration responses to the adaptive questions online.
2.6 Methods of Estimating Consideration Models
Tracing and protocol analysis were classic methods applied to detect non-compensatory rules [Payne 1976, Bettman 1980] in which respondents decision process were self-reported or tracked. Shortcoming was reported along with the application of these direct elicitation ap-proaches, for example, inconsistency was observed between the stated screening criteria and the later choice made by the same individual [Green and Krieger 1988]. In spite of its im-perfection, direct elicitation approach continued contributing to later research in two ways. First, with the improvement of experiment design, self-elicitation approach can achieve higher accuracy. An example was provided by Ding and Hauser [2011] where the incentive-aligned setting was used. Second, methods based on latent constructs can use self-reported screening aspects and criteria to pre-establish a two-stage model that requires less estimation complexity, for example, Swait [2001a] constructed a two-stage model in which the acceptability thresholds were directly reported from a survey. Their technique avoided enumerating all the possible consideration sets.
Estimation tools that are widely applied in classic conjoint analysis such as maximum likeli-hood and Bayesian methods were also useful in non-compensatory model parameter estimation where probabilities of screening and choice are correspondingly formulated. Jedidi and Kohli [1996] generalized conjunctive and disjunctive rules as a linear threshold model then operated maximum likelihood method only on the probability of accepting an alternative and the con-sideration stage data. In their later work in 2005, a more informative model was estimated where the probability that each aspects/levels is screened was also included [Jedidi and Kohli 2005]. Gilbride and Allenby [2004] measured conjunctive and disjunctive rules with Bayesian approach from choice data, their reduced form of consider-then-choose choice probability eased
the enumeration of consideration sets.
Recently developed machine learning techniques brought new inferring tools to this field. Yee et al. [2007] and Kohli and Jedidi [2007] adapted greedoid language into screening rules inferring. One advantage of greedoid algorithm is that it makes use of the relationship between profile ordering and screening aspects ordering to effectively update the screening pattern to-wards the best fit to the data. Dzyabura and Hauser [2011] developed an active machine learning method to adaptively select survey questions in which the profiles are configured to maximize the information on the decision rules according to posterior beliefs and prior re-sponses. These machine learning techniques largely reduced the computation time compared to the traditional consideration sets exposion methods and thus enable the inferring of more possible screening aspects and levels.
2.7 Improvement of Predictive Power
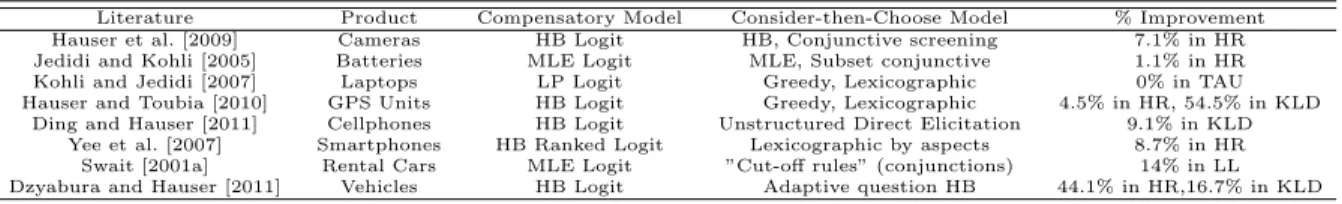
Pair with methods to uncover non-compensatory rules, the improvement of choice model predictions has been observed in a variety of product categories when non-compensatory rules were modeled. Swait reported an multinomial logit model with soft cut-offs fit the choice data of rental cars better than a pure multinomial logit model [Swait 2001a]. In a smart phone study Yee et al. observed that lexicographic models inferred by greedoid method predicts better than Bayes-ranked logit model [Rossi and Allenby ] on hit rate for at least half of the population in ranking task samples [Yee et al. 2007]. Ding et al. reported an improvement of relative Kullback-Leibler divergence (relative to null model prediction) in cellphones data with screening rules from unstructured direct elicitation than Hierachical Bayesian logit model [Ding and Hauser 2011]. Other examples in categories of cameras, batteries, laptops, GPS Units, vehicles [Hauser et al. 2009, Jedidi and Kohli 2005, Kohli and Jedidi 2007, Hauser and Toubia 2010, Dzyabura and Hauser 2011] are listed in Table 4.1.
Note that the validation of prediction power can only indicate that the model better describe the data as if the respondents are more likely to react as how these models describe. But they don’t necessarily prove that the respondents are actually using these procedures of these models.
Table 2.2 Recent consider-then-choose models constructed from stated preference data (cited from NSF Award NO.1334764). Abbreviations: HB - Hierachical Bayes; MLE - Maximum Likelihood; HR - ”hit rate” (frequency of correct prediction on hold-out samples); KLD - Kullback-Liebler Divergence; TAU - Kendall’s Tau [Hauser 1978], LL - Log-likelihood (increase)
Literature Product Compensatory Model Consider-then-Choose Model % Improvement Hauser et al. [2009] Cameras HB Logit HB, Conjunctive screening 7.1% in HR Jedidi and Kohli [2005] Batteries MLE Logit MLE, Subset conjunctive 1.1% in HR Kohli and Jedidi [2007] Laptops LP Logit Greedy, Lexicographic 0% in TAU Hauser and Toubia [2010] GPS Units HB Logit Greedy, Lexicographic 4.5% in HR, 54.5% in KLD
Ding and Hauser [2011] Cellphones HB Logit Unstructured Direct Elicitation 9.1% in KLD Yee et al. [2007] Smartphones HB Ranked Logit Lexicographic by aspects 8.7% in HR
Swait [2001a] Rental Cars MLE Logit ”Cut-off rules” (conjunctions) 14% in LL Dzyabura and Hauser [2011] Vehicles HB Logit Adaptive question HB 44.1% in HR,16.7% in KLD
CHAPTER 3. CONSIDERATION AND DESIGN OPTIMIZATION
3.1 Introduction
Generally applying consider-then-choose models in a design optimization framework still faces challenges. Specifically, the choice probabilities in consider-then-choose models can be discontinuous in continuous decisions. For example, suppose an individual can purchase a product with price p ($) and “value” x≥ 0. If they buy the product they obtain a utility of
U(x, p) = u(x, p) +E whereu(x, p) = 1−p+x, and if they opt not to buy the product they obtain a utility of Θ = 1 +E0 for i.i.d. extreme value errors E,E0. However they will consider the product only ifp≤$1−a screening rule. This example models a situation where individuals only have so much to spend on a product, and can obtain utility from both ownership and the amount of money left over after purchase. Consider-then-choose choice probabilities are then given by PC(x, p) = e1−p+x/(e+e1−p+x) ifp≤$1 0 ifp >$1 (3.1)
Observe that limp↑1PC(x, p) =ex/(e+ex)>0 while limp↓1PC(x, p) = 0, and thusPC(x,·) is discontinuous atp= 1. See also Fig. 3.1.
Because of these discontinuities, optimization methods that rely on derivatives information cannot be assured to solve this type of problem. In this section, we present research that addresses this numerical issue. The contribution of this work is to explore efficient tools to support further application of consider-then-choose models. The outcomes of this research are: • Numerical methods based on Nonlinear Programming (NLP) are explored. Three for-mulations of the optimization problem are derived: forfor-mulations based on constrained complementarity, penalized complementarity and smoothing.
• Genetic Algorithm (GA) is applied. Two classes of GA methods are implemented: GA with a penalty on constraints violation and a hybrid GA with constraints solved by NLP. • The performance of the numerical methods are obtained in a demonstration case where a firm is designing a vehicle under consumers’ budget screening rules. The properties of five methods are shown by the optimality, feasibility and computation cost of their solutions. In the remaining section, we will first introduce the general design optimization problem with consider-then-choose model in Section 3.2. The formulations of three NLP methods and two GA methods will be presented in Section3.3and Section 3.4. The demonstration example will be described in Section3.4. Section 3.5reports the performance of the methods as results. This discussion is based on work from Morrow et al. [2012] and Morrow et al. [pted], though we include more details than available in those publications.
3.2 The Optimization Problem
Suppose a firm is designing a product line withJ products, each with engineering features vector xj and price pj. The engineering relationships among the features can be described in
equality or inequality constraints. With the costs as the function of engineering features and the mapping from product attributes to predicted demand (i.e. choice probability), the general formulation the design optimization problem can be written as:
maximize π(X,p) =
J
X
j=1
Pj(X,p)(pj−cj(xj))
with respect to for all j= 1, ..., J pj ≥0
Lj ≤xj ≤Uj
subject to for all j= 1, ..., J
cEj (xj) =0
cIj(xj)≥0
wherecj(.) is the cost function, cEj (.) is equality constraints,cEj (.) is inequality constraints, L
and U are lower bounds and upper bounds of the features. When applying a consider-then-choose model, the choice probability under individuals sample size I is specified as:
Pj(X,p) = I
X
i=1
PijCT C(X,p) (3.3)
If productj is considered by individuali(i.e. in consideration setCi), it will be compared with
other products in the same consideration set, otherwise it won’t be chosen. That is:
PijCT C(X,p) = expui(xj,pj) 1+P k∈Ciexpui(xk,pk) j ∈ Ci 0 j 6∈ Ci (3.4)
The consideration set Ci is defined by a group of individual specific screening rules si(xj, pj)
such that
Ci ={j∈1,· · · , J :si(xj, pj)≤0} (3.5)
Note that the consider-then-choose (CTC) choice probability is discontinuous on the design space, because at the point where screening criteria is active, the product will ”enter” or ”leave” an individual’s consideration set. This discontinuous property is crucial for design optimization as taking derivatives with respect to the design variables. When multiple products and mul-tiple screening rules are involved, this issue become particularly challenging not only because the number of possible consideration sets grows exponentially but also because the number of feasible combinations of the possible consideration set are relatively small. Method like enumeration the possible consideration pattern will suffer from explosive number of inefficient searches.
3.3 NLP Methods
To implement nonlinear programming (NLP) approaches for the consider-then-choose op-timization problem, Morrow et al. [2012] proposed a relaxation for the CTC choice probability
in Eqn. (3.4), the relaxed form is: ˆ Pij CT C (w,X,p) = ( QRi r=1wijr) expuij 1 +PJ k=1( QRi r=1wikr) expuik . (3.6)
This formula relaxed discontinuity by introducing slack variableswi,j,r to represent : if product j satisfies individual i’s screening rule r then wi,j,r = 1, otherwise wi,j,r = 0. To match the
CTC structure, ideally we seek to construct a formula such that for all i, j, r, when screening rulessi,r(xj,pj)≤0, wi,j,r strictly equals to 1, and whensi,r(xj,pj)>0,wi,j,r strictly equals
to 0. We call this desired property as strictly choice-consistency.
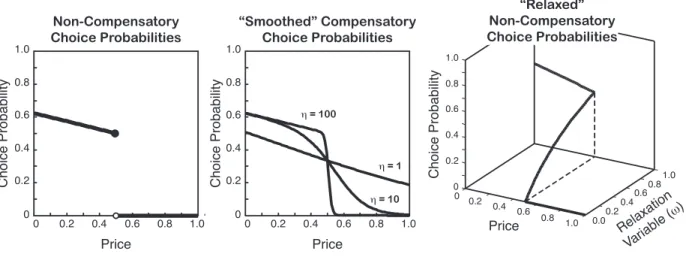
0 0.2 0.4 0.6 0.8 1.0 0 0.2 0.4 0.6 0.8 1.0 Price Choice Probability 0 0.2 0.4 0.6 0.8 1.0 0 0.2 0.4 0.6 0.8 1.0 Price Choice Probability η = 1 η = 100 η = 10 0 0.2 0.4 0.6 0.8 1.0 0.00.2 0.40.6 0.81.0 0 0.2 0.4 0.6 0.8 1.0 Price Choice Probability Relaxation Variable ( ω) Non-Compensatory
Choice Probabilities “Smoothed” CompensatoryChoice Probabilities
“Relaxed” Non-Compensatory Choice Probabilities
Figure 3.1 Two classes of NLP methods to handle discontinuous non-compensatory choice probabilities. Left: Discontinuous choice probabilities from the example at the start of this section. Center: “Smoothed” choice probabilities using Eqn. (3.6) and the smoothing model in Eqn. (3.7). Right: “Relaxed” smooth choice probabilities using Eqn. (3.6) and the complementarity constraints in Eqn. (3.9).
Two classes of NLP methods are implemented on this purpose: NLP with smoothing ap-proach and NLP with complementarity constraints.
3.3.1 NLP with Smoothing
The smoothing approach is using a smoothed step function to approximate the desired relationship betweenw and s. This step function is defined as:
Lη(s) = (1 +e−η) e−ηs 1 +e−ηs (3.7) for any η≥0 and s∈R. These functions define the following smoothed problem:
maximize πˆC(w,X,p)
with respect to wi,j,r ∈R for all i, j, r
lj ≤xj ≤uj, pj ≥0 for allj
subject to cEj (xj) =0, cIj(xj)≤0 for all j wi,j,r−Lη(si,r(xj, pj)) = 0 for all i, j, r
(3.8)
The smoothing factorη performs in a way that when η= 0, the optimization problem will collapse to the problem without consideration behavior and whenη ↑ ∞, the step function will be approaching the clear ”cut-off”. The solve of Problem (3.2) takes the following procedures: solve Eqn. (3.8) with an initial small value ofη; If the solve is successful, increaseηand resolve Eqn. (3.8) starting at the last solution. This process is repeated until either solving failure is ecountered or the two successive solutions are sufficiently close.
3.3.2 NLP with Complementary Constraints
If adding complementary constraints to relate this slack variables w to the screening rule by the following mixed complementarity problem (MCP):
0≤w≤1⊥s≡ w= 1 ifs≤0 w∈[0,1] ifs≤0 w= 0 ifs >0 (3.9)
needs to be implemented explicitly for the NLP solver to handle. We use two implementations: a) adding constraints to reflect complementarity (C-MPCC); b) penalizing the violation of complementarity (P-MPCC).
Constrained MPCC (C-MPCC): With slacks variables+i,j,r and s−i,j,r to capture the positive part and the negative part of screening rules value, adding complementary constraints defines the following problem:
maximize ˆπC(w,X,p) +τX i,j,r
wi,j,r
with respect to lj ≤xj ≤uj, pj ≥0 for allj wi,j,r, vi,j,r, s+i,j,r, s
−
i,j,r ≥0 for alli, j, r
subject to cEj (xj) =0, cIj(xj)≤0for all j I X i=1 Ri Y r=1 wi,j,r ! ≥1 for all j si,j,r(xj, pj)−s+i,j,r+s−i,j,r = 0 wi,j,r+vi,j,r = 1 wi,j,rs+i,j,r≤0 vi,j,rs−i,j,r ≤0 for all i, j, r (3.10) The term τP
w with τ > 0 serves to enforce strictly choice consistency of w. This for-mulation will be solved with Sequential Quadratic Programming (SQP) solver SNOPT, for the reason that SQP relaxes the constraints during solving the subproblem, preventing the difficulty in an Interior point method where the feasible set of this problem does not have a topological interior.
function yields the following formulation: maximize πˆC(w,X,p) +τX i,j,r wi,j,r−M X i,j,r
(wi,j,rs+i,j,r+vi,j,rs−i,j,r)
with respect to lj ≤xj ≤uj, pj ≥0 for allj
wi,j,r, vi,j,r, s+i,j,r, s−i,j,r≥0 for alli, j, r
subject to cEj (xj) =0, cIj(xj)≤0 for allj I X i=1 Ri Y r=1 wi,j,r ! ≥1 for allj
si,j,r(xj, pj)−s+i,j,r+s−i,j,r = 0 for alli, j, r wi,j,r+vi,j,r = 1 for alli, j, r
(3.11)
for some M > 0. In practice, M is empirically chosen to be sufficiently large to enforce complementarity.
3.4 GA Methods
Two classes of genetic algorithm are applied to solve the multiple products design problem under consider-then-choose model : a penalty-based genetic algorithm (P-GA) that combines feasible solutions selection technique; a hybrid genetic algorithm that embeds an NLP solver to strictly handle design constraints (C-GA).
3.4.1 Penalized GA (P-GA)
Penalty-based genetic algorithm is widely applied to incorporating constraints, but there are well-known difficulties associated with it. Specifically, the selection and the scaling of the penalty parameter highly affect the balance between optimizing the objective and achieving feasibility, and the appropriate value of penalty parameter is sensitive to problem features including the number of constraints and the nonlinear complexity of the constraint functions [Richardson et al. 1989]. These drawbacks are especially crucial when equality constraints are involved, as the feasible searching space has smaller dimensions than the variables space. For