THE IMPACT OF SIMULATED ASTIGMATISM ON
FUNCTIONAL MEASURES OF VISUAL
PERFORMANCE
Sung-Hua Yang
B.Optom., MSc.
May, 2015
Submitted in fulfilment of the requirements for the degree of Master of Applied Science (Research)
Vision and Driving Laboratory
School of Optometry and Vision Science Faculty of Health
Institute of Health and Biomedical Innovation Queensland University of Technology
Keywords
Astigmatic blur Astigmatic axis Astigmatic power Visual acuity Reading ratesVisual processing speeds
Reading eye movements
ii
Abstract
Uncorrected refractive error, including astigmatism, is a leading cause of reversible visual impairment. While the ability to perform vision-related daily activities is reduced when people are not optimally corrected, only limited research has investigated the impact of uncorrected astigmatism. Given the capacity to perform vision-related daily activities involves integration of a range of visual and cognitive cues, this research examined the impact of simulated astigmatism on visual tasks that also involved cognitive input. The research also examined whether the higher levels of complexity inherent in Chinese characters makes them more susceptible to the effects of astigmatism. The effects of different powers of astigmatism, as well as astigmatism at different axes were investigated in order to determine the minimum level of astigmatism that resulted in a decrement in visual performance.
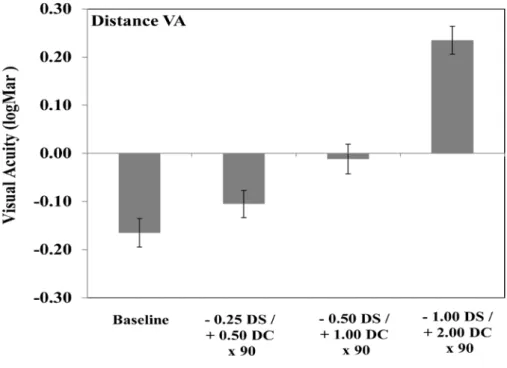
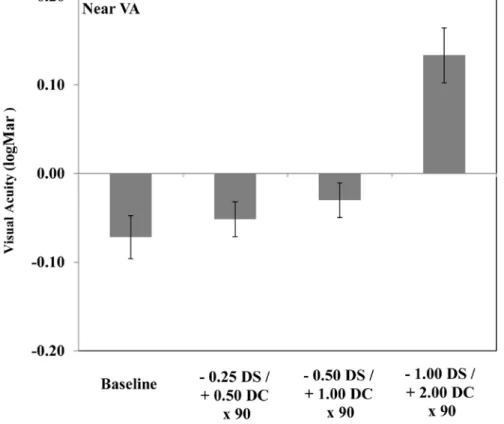
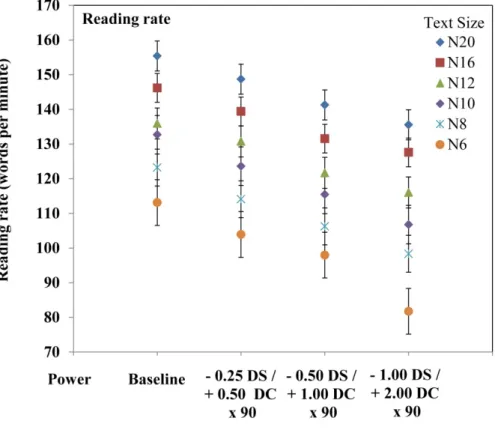
Study 1 investigated the impact of three powers (0.50 DC, 1.00 DC, 2.00 DC) of against-the-rule astigmatism (ATR) and three different axes of astigmatism (ATR, with-the-rule (WTR) and oblique (OBL)) on distance and near visual acuity, and reading rates for six font sizes. Participants included 12 young, visually normal adults (mean age 23.9 ± 5.5 years; range 18 to 34 years). Distance visual acuity was measured using a high contrast logMAR chart at 4 m, while near visual acuity and reading rates were tested using a series of Bailey-Lovie reading charts. The order of testing was randomised, and participants were required to watch a movie (at 40 cm) for 10 minutes to standardise the level of blur adaptation. A short break (5 minutes) with clear vision was provided on completion of each testing condition. Distance and near visual acuity significantly (p<0.05) decreased as a function of increasing levels of cylindrical power for ATR astigmatism. Importantly, even small amounts of ATR astigmatism (as low as 0.50 DC) had a significant negative impact on visual acuity. Similarly, the axis of astigmatism differentially impacted on both distance and near visual acuity compared with best-correction, where OBL astigmatism had a significantly greater detrimental effect than either WTR or ATR astigmatism. Reading rate for all six font sizes significantly decreased with increasing power of ATR astigmatism and as a function of astigmatic axis. Furthermore, there were significant interactions between font size and astigmatic power, where the effects of
astigmatism were greater for smaller font sizes. In addition, reading rate with OBL astigmatism was significantly slower than for the other axes of astigmatism.
Study 2 investigated the impact of simulated astigmatism of the same powers and axes as in Study 1 on outcome measures that involved the integration of vision and cognitive skills. Participants included 12 visually normal young adults (mean age 24.8 ± 5.3 years; range 18 to 34 years). Outcome measures included distance and near visual acuity, and tasks involving visual and cognitive skills (Developmental Eye Movement Test (DEM), Digit Symbol Substitution Test (DSST), and Trail Making Tests A and B). Increasing levels of ATR astigmatism increased visual processing time on both the Trails A and B tests and also reduced DSST scores, relative to the best-corrected condition and all conditions were significantly different to one another. While all three axes of astigmatism decreased performance on the Trails A and B tests and the DSST, there were no between axis differences, with the exception of the Trails B where both WTR and OBL astigmatism were worse than ATR. Performance on these tests is thus clearly affected by the presence of astigmatism even at low levels, but there is little axis dependency. Conversely, performance on the DEM was more robust to the effects of simulated astigmatism. Collectively, the results of Study 2 suggest that performance of tasks involving the integration of vision and cognitive skills, visual scanning and visual processing are influenced by the level of astigmatism, but are less axis dependent. This slowing of visual scanning and visual processing in the presence of astigmatism has implications for performance of everyday activities.
Study 3 evaluated the impact of astigmatism on visual acuity and reading performance using Chinese rather than English characters, in order to determine whether the higher levels of complexity inherent in Chinese characters makes them more susceptible to the effects of astigmatism. Participants included 12, visually normal young adults (mean age 23.5 ± 2.4 years; range 20 to 28 years), for whom Chinese was their first spoken and written language. Distance visual acuity was tested as for Studies 1 and 2, while near visual acuity and reading rate were tested using Chinese near vision charts. Astigmatism had a significantly greater negative impact on reading rates using Chinese compared to the English symbols investigated in Study 1. Reading rates for Chinese text became slower with increasing powers of
iv
ATR astigmatism, even as low as 0.50 DC. Astigmatic axis also impacted on reading rate, where simulated astigmatism reduced reading rate for all font sizes compared to optimal correction, with OBL astigmatism having the greatest detrimental effect. The finding that astigmatism had a greater negative impact on reading rates for Chinese compared to English characters is likely to reflect the relative visual complexity and higher levels of cognitive processing required for reading Chinese characters. This suggests that correction of astigmatism is even more important for individuals reading Chinese than English text and that astigmatism as low as 0.50 DC can be problematic.
In summary, different astigmatic powers resulted in reduced distance and near visual acuity and also lowered reading rates and visual processing speeds. Oblique astigmatism had the greatest negative impact, with the majority of outcomes being affected to a similar extent by WTR and ATR astigmatism. Collectively, these findings are important for better understanding the influence of astigmatism on functional vision and assist eye care practitioners in recognising the importance of correcting astigmatism, even for levels as low as 0.50 DC.
Table of Contents
CHAPTER 1: INTRODUCTION ... 1
1.1 Background ... 1
1.2 Aims of this research ... 2
1.3 Thesis outline ... 3
CHAPTER 2: LITERATURE REVIEW ... 6
2.1 Optics of the eye ... 6
2.2 Astigmatism ... 7
2.2.1 Symmetry of astigmatism between right and left eyes ... 10
2.2.2 Association between spherical refractive error and astigmatism ... 10
2.2.3 The influence of genetics on astigmatism ... 12
2.2.4 Prevalence and changes of astigmatism with age ... 12
2.2.5 Blur adaptation and astigmatism ... 14
2.2.6 The correction of astigmatism ... 14
2.3 Refractive error and quality of life ... 15
2.4 Refractive error and reading ... 16
2.5 Refractive error and driving ... 17
2.6 Impact of impaired vision on tasks involving cognitive skills ... 18
2.7 Impact of astigmatism on visual acuity ... 19
2.8 Impact of astigmatism on reading performance ... 21
2.9 Testing visual acuity and reading with Chinese characters ... 23
2.10 Rationale ... 24
CHAPTER 3: IMPACT OF SIMULATED ASTIGMATIC REFRACTIVE BLUR ON VISUAL ACUITY AND READING... 27
3.1 Introduction ... 27
3.2 Methods ... 28
3.2.1 Participants ... 28
vi
3.2.3 Protocol ... 30
3.2.4 Distance and near visual acuity ... 32
3.2.5 Reading rate ... 33
3.2.6 Statistical analysis ... 33
3.3 Results ... 34
3.3.1 Powers of ATR astigmatism ... 34
3.3.2 Axes of astigmatism ... 40
3.4 Discussion ... 44
3.5 Conclusion ... 46
CHAPTER 4: IMPACT OF SIMULATED ASTIGMATIC REFRACTIVE BLUR ON TESTS INVOLVING VISION AND COGNITION ... 48
4.1 Introduction ... 48
4.2 Method ... 49
4.2.1 Participants ... 49
4.2.2 Protocol ... 49
4.2.3 Distance and near visual acuity ... 50
4.2.4 Developmental Eye Movement Test (DEM test) ... 50
4.2.5 Digit Symbol Substitution test (DSST)... 51
4.2.6 Trail Making Tests A and B (TMT A and TMT B) ... 52
4.2.7 Statistical analysis ... 53
4.3 Results ... 53
4.3.1 Powers of ATR astigmatism ... 53
4.3.2 Axes of astigmatism ... 59
4.4 Discussion ... 66
4.5 Conclusion ... 68
CHAPTER 5: IMPACT OF SIMULATED ASTIGMATISM BLUR ON FUNCTIONAL MEASURES OF VISUAL PERFORMANCE USING CHINESE CHARACTERS... 70
5.2 Method ... 71
5.2.1 Participants ... 71
5.2.2 Protocol ... 71
5.2.3 Distance and near visual acuity ... 72
5.2.4 Reading rate ... 73
5.2.5 Statistical analysis ... 74
5.3 Results ... 75
5.3.1 Powers of ATR astigmatism ... 75
5.3.2 Axes of astigmatism ... 79
5.3.3 Comparison of the reduction in reading performance with astigmatism for English and Chinese characters ... 82
5.4 Discussion ... 89
5.5 Conclusion ... 93
CHAPTER 6: CONCLUSIONS ... 94
6.1 Impact of astigmatism on distance and near visual acuity ... 95
6.2 Impact of astigmatism on reading rate (English characters) ... 96
6.3 Impact of astigmatism on functional visual tasks (DEM, DSST, and TMT A and B) ... 96
6.4 Impact of astigmatism on reading rate (Chinese characters) ... 98
6.5 Summary and Implications ... 99
APPENDICES ... 102
Appendix 1 Participant information and consent form ... 102
viii
List of Figures
Figure 2-1 – Total wavefront aberrations (left), sphero-cylinder components (centre) and higher order aberration components (right). Total equals the sum of the sphero-cylinder and higher order components; colours at the red end of the
spectrum indicate higher dioptric powers... ...6 Figure 2-2– Schematic representation of the eye’s refracting surfaces; the front and
back surfaces of the cornea and the front and back surfaces of the crystalline lens. GRIN is gradient refractive index. ...8 Figure 2-3 – With-the-rule astigmatism (left) has the steeper corneal meridian along
the vertical meridian (90 ± 30 degrees), oblique astigmatism (centre) has the steeper corneal meridian between (30 to 60 and 120 to 150 degrees, while against-the rule astigmatism (right) has the steeper corneal meridian along the horizontal meridian (180 ± 30 degrees); colours at the red end of the
spectrum indicate steeper curvatures.. ...10 Figure 2-4 – The effect of different axes of astigmatism on image quality. In myopic
ATR the vertical detail is blurred, in myopic OBL the oblique detail is
blurred and in myopic WTR the horizontal detail is blurred. ...19 Figure 3-1 – Sample of Bailey-Lovie reading chart...33 Figure 3-2 – Group mean distance visual acuity as a function of three different powers
of ATR astigmatism (error bars represent the standard error of the mean). ...35 Figure 3-3 – Group mean near visual acuity with different levels of ATR astigmatism
(error bars represent the standard error of the mean). ...37 Figure 3-4 – Mean reading rate; reading rate of different text size and with different
levels of astigmatic power (error bars represent the standard error of the
mean). ...38 Figure 3-5 – Group mean distance visual acuity with different levels of spherical blur
and ATR astigmatism (error bars represent the standard error of the mean). ...39 Figure 3-6 – Group mean distance visual acuity with different axes of astigmatism
(error bars represent the standard error of the mean). ...40 Figure 3-7 – Group mean near visual acuity with different axes of astigmatism (error
bars represent the standard error of the mean)...41 Figure 3-8 – Mean reading rate; reading rate of different text size and with different
astigmatic axis (error bars represent the standard error of the mean). ...43 Figure 4-1 – Schematic representation of the different components of the DEM test. ...51 Figure 4-2 – Sample of DSST and Trail Making tests. ...52 Figure 4-3 – Group mean distance visual acuity with different levels of ATR
Figure 4-4 – Group mean near visual acuity with different levels of ATR astigmatism (error bars represent the standard error of the mean). ...56 Figure 4-5 – Mean DEM adjusted vertical and horizontal time with different levels of
astigmatic power (error bars represent the standard error of the mean). ...57 Figure 4-6 – Mean DSST score with different levels of astigmatic power (error bars
represent the standard error of the mean). ...58 Figure 4-7 – Mean TMT time with different levels of astigmatic power (error bars
represent the standard error of the mean). ...59 Figure 4-8 – Group mean distance visual acuity with different axes of astigmatism
(error bars represent the standard error of the mean). ...60 Figure 4-9 – Group mean near visual acuity with different axes of astigmatism (error
bars represent the standard error of the mean)...62 Figure 4-10 – Mean DEM adjusted vertical and horizontal time with astigmatism on
different axes (error bars represent the standard error of the mean). ...63 Figure 4-11 – Mean DSST score with astigmatism on different axes (error bars
represent the standard error of the mean). ...64 Figure 4-12 – Mean Trail Making test time with astigmatism on different axes (error
bars represent the standard error of the mean)...65 Figure 5-1 – Sample of a Chinese (7 strokes per character) near visual acuity chart ...73 Figure 5-2 – Group mean distance visual acuity with different levels of ATR
astigmatism (error bars represent the standard error of the mean). ...755 Figure 5-3 – Group mean near visual acuity with different levels of ATR astigmatism
(error bars represent the standard error of the mean). ...76 Figure 5-4 – Mean reading rate; reading rate of different text size and with different
levels of astigmatic power (error bars represent the standard error of the
mean). ...78 Figure 5-5 – Group mean distance visual acuity with different axes of astigmatism
(error bars represent the standard error of the mean). ...79 Figure 5-6 – Group mean near visual acuity with different axes of astigmatism (error
bars represent the standard error of the mean)...81 Figure 5-7 – Mean reading rate; reading rate of different text size and with different
astigmatic axis (error bars represent the standard error of the mean). ...82 Figure 5-8 – Reduction in the overall percentage reading rate as a function of the three
different powers of astigmatism for the English and Chinese characters
(error bars represent the standard error of the mean). ...85 Figure 5-9 – Overall reduction in percentage reading rate for all power of ATR
astigmatism combined as a function of character size for the Chinese and
x
Figure 5-10 – Overall reduction in percentage reading rate for 2.00 DC of astigmatism for the three axes combined as a function of font/symbol size for the Chinese and English charts (error bars represent the standard error of the mean).. ...88 Figure 5-11 – Sample of similarity between Chinese characters ...92
List of Tables
Table 2-1 – Summary of studies comparing the effect of astigmatic axis orientation on visual performance. ...23 Table 3-1 – Luminance and illuminance levels of charts ...32 Table 3-2 – Group mean data (± standard deviation) and one-way ANOVA results for
the effect of three different powers of ATR astigmatism compared to
baseline ...36 Table 3-3 – Group mean data (± standard deviation) for the effect of three different
levels of spherical blur and astigmatism compared with baseline condition ...39 Table 3-4 – Group mean data (± standard deviation) and one-way ANOVA results for
the effect of three different axes of astigmatism compared with baseline
condition ...42 Table 4-1 – Luminance and illumination of charts ...50 Table 4-2 – Group mean data (± standard deviation) and one-way ANOVA results for
the effect of three different powers of ATR astigmatism ...55 Table 4-3 – Group mean data (± standard deviation) and one-way ANOVA results for
the effect of 3 different axes of astigmatism compared with baseline
condition ...61 Table 5-1 – Luminance and illuminance of near charts ...72 Table 5-2 – Group mean data (± standard deviation) and one-way ANOVA results for
the effect of three different powers of ATR astigmatism compared to
baseline ...77 Table 5-3 – Group mean data (± standard deviation) and one-way ANOVA results for
the effect of 3 different axes of astigmatism compared with baseline
condition ...80 Table 5-4 – Group mean percentage reduction (± standard deviation) in reading rate
relative to the optimal correction for the 3 levels of astigmatism and for each of the six font sizes for the English (Study 1) and Chinese (Study 3)
characters ...84 Table 5-5 – Group mean percentage reduction (± standard deviation) in reading rate
relative to the optimal correction for the 3 axes of astigmatism and for each
Acknowledgements
I would like to appreciate my supervisor Professor Joanne Wood for her invaluable advice, assistance and support throughout my career. I would also thank my associate supervisor Professor Michael Collins for all of his generosity, assistance and encouragement.
Thanks to everyone at Vision and Driving Laboratory, and Contact Lens and Visual Optics Laboratory, particularly Alexander Black, Rodney Jensen, Fan Yi, and Catherine Foster for their advice and encouragement throughout my journey. Thanks also to Philippe Lacherez for his invaluable statistical advice. In addition, I wish to thank Sumithira Narayanasamy for her generosity in time and encouragement. Many thanks to the participants, without their generosity of time and enthusiasm, none of these studies would have been possible.
A special thanks to my parents for their understanding, enduring support, and guidance. Finally, I would like to thank Cuihong Miao for her continued support, patience, and understanding during my studies.
Chapter 1:
Introduction
1.1 Background
Uncorrected refractive error is a leading cause of reversible visual impairment (Coleman et al., 2006) and has been shown to reduce distance visual acuity and near work as well as functional tasks of daily living such as reading and driving (Higgins et al., 1998; Chung et al., 2007; Wood et al., 2014). While there has been extensive research into the effects of spherical refractive blur on clinical and functional tests of vision, there is only limited research investigating the effects of blurred vision caused by uncorrected astigmatic refractive error and this is an important issue given the relatively high prevalence of astigmatism in the population (Fan et al., 2004; Read et al., 2007; Ferrer-Blasco et al., 2009; Hashemi et al., 2011).
Some studies have investigated the impact of astigmatism on visual acuity (Villegas et al., 2006), and functional visual performance measures such as reading (Casagrande et al., 2013). However, investigation of the effect of a range of astigmatic powers and axis orientations on these measures has not been undertaken and was one of the main aims of the studies in this thesis. In addition, given that the capacity to perform vision-related daily activities involves the integration of a range of visual and cognitive cues and does not simply depend on high contrast visual acuity, this research also examined the impact of simulated astigmatism on a range of tasks involving both visual and cognitive function, including visual search and speed of visual processing tasks.
This research also examined whether the higher levels of complexity inherent in Chinese characters makes them more susceptible to the effects of simulated astigmatism. Chinese characters are different to English characters in that they can have up to 18 strokes in a single character and these strokes can be various lengths and at a wide variety of angles. Therefore reading Chinese characters in the presence of astigmatic blur presents a unique challenge in terms of spatial resolution and
cognitive demand. A particular aim of this research was to determine the minimum level of astigmatism that impacted on visual performance when assessed using Chinese characters, as well as the axis of astigmatism that had the greatest negative impact on performance. This is a potentially important issue given the relatively high prevalence of astigmatism in the Chinese population (Chen, et al., 2013).
1.2 Aims of this research
The overall aim of this research was to investigate how different levels and axes of astigmatic blur impact on functional measures of visual performance. In order to achieve this aim three studies were conducted. These studies, along with their specific aims are described below.
Study 1. Impact of simulated astigmatic refractive blur on functional measures of visual performance (distance visual acuity, near visual acuity and reading rate)
The aim of Study 1 was to investigate how uncorrected astigmatism, in terms of both power and axis, impacts upon distance and near visual acuity and reading performance. This study extends previous work by testing at lower levels of astigmatism and also testing at a range of axes of astigmatism.
Hypothesis 1: That the power and axis of astigmatism will influence distance and near visual acuity and reading rates.
Study 2. Impact of simulated astigmatic refractive blur on tests involving both visual and cognitive input
The aim of Study 2 was to investigate how uncorrected astigmatism, both in terms of the power of the cylinder and its axis, impacts upon performance of tasks involving the integration of both visual and cognitive skills including the Developmental Eye Movement Test (DEM), Digit Symbol Substitution Test (DSST), and Trail Making Tests A and B.
Hypothesis 2: That the power and axis of astigmatism will impact upon performance of tasks involving the integration of both visual and cognitive skills, including the DEM test, DSST, and Trail Making Tests A and B.
Study 3. Impact of simulated astigmatism on functional measures of visual performance using Chinese characters (near visual acuity and reading rate) The aim of Study 3 was to investigate the impact of simulated astigmatism of different powers and axes on near visual acuity and reading rates using Chinese characters, which are hypothesised to present a higher level of visual and cognitive effort than the standard English letter charts employed in Experiments 1 and 2 of this thesis. The differential impact of astigmatism on reading rates measured using Chinese characters was compared to reading rates with English characters measured in Study 1.
Hypothesis 3: That the power and axis of astigmatism will have an influence near visual acuity and reading rate using charts based on Chinese characters.
Hypothesis 4: That there will be a difference in the effects of the power and axis of astigmatism on near visual acuity and reading rate using charts based on English versus Chinese characters, with the effects being greater for Chinese characters.
1.3 Thesis outline
This thesis is structured as follows:
Chapter 1 briefly summarises the research background, the overall research aims as well as specific aims of each of the three experiments, and provides an outline of each of the chapters.
Chapter 2 includes a review of the literature and provides an overview of astigmatism and its impact on visual function. Topics include the optics of the eye,
an overview of astigmatism, the impact of refractive error on quality of life, reading and driving performance, the impact of impaired vision on tasks involving cognitive skills, the impact of astigmatism on visual acuity and reading performance and testing visual acuity and reading with Chinese characters. The overall rationale of the research is also provided.
Chapter 3 describes the study design, research methodology and results for Study 1 which involved investigation of the impact of different powers and axes of astigmatism on binocular distance visual acuity, binocular near visual acuity, and binocular reading performance for six different font sizes. Participants included those for whom English is their first spoken and written language.
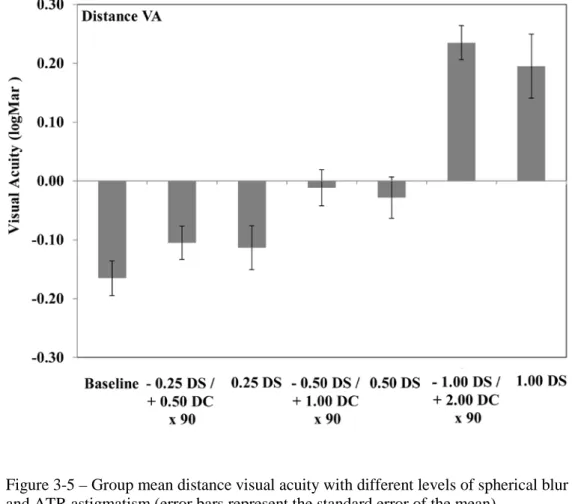
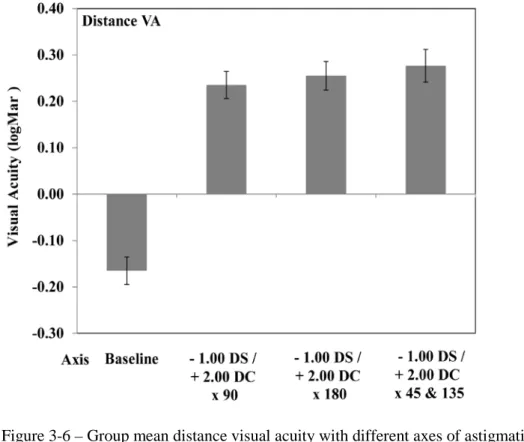
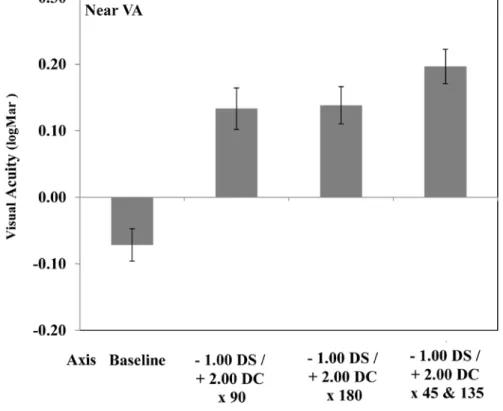
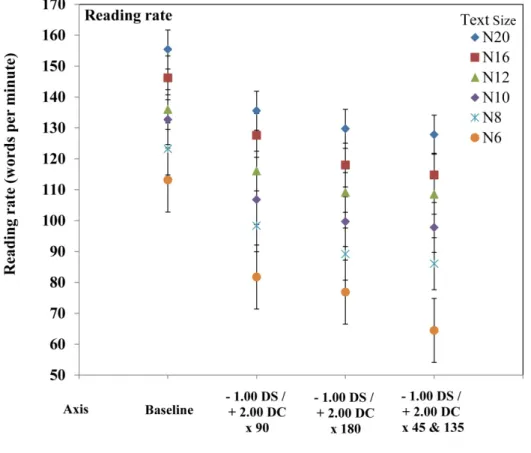
The powers of astigmatism included in the experiments described in Chapters 3, 4 and 5 included: - 0.25 DS / 0.50 DC x 90, - 0.50 DS / 1.00 DC x 90 and - 1.00 DS / 2.00 DC x 90. To test the effect of the axis of astigmatism in all three experiments, the following powers and axes of astigmatism were included; - 1.00 DS / 2.00 DC x 90, - 1.00 DS / 2.00 DC x180 and - 1.00 DS / 2.00 DC x 135 (right eye) and 45 (left eye). The mean spherical equivalent was maintained as plano for all of the simulated astigmatic conditions in the three experiments. Spherical blur control conditions were also used to measure distance visual acuity in Study 1 only, including: + 0.25 DS, + 0.50 DS and + 1.00 DS, in order to match the best sphere of the three cylinder powers.
The following two chapters present the research examining the impact of astigmatism on the binocular performance of tasks that involve vision and cognitive skills such as the DEM, DSST, and Trail Making A and B Tests (Chapter 4), and the impact of astigmatism on binocular near visual acuity and binocular reading performance involving Chinese symbols for Chinese speaking participants (Chapter 5). Chapter 5 also includes a comparison between the percentage reductions in reading rates for English and Chinese characters (collected in Experiments 1 and 3 respectively).
Finally, Chapter 6 presents an overview and summary of the major findings of this thesis. Implications for further research are also presented in this chapter.
Chapter 2:
Literature Review
This chapter provides a review of relevant literature regarding uncorrected refractive errors, especially astigmatism, and how they impact upon vision and functional performance tasks, such as driving and reading, in order to provide a clear framework for the design of the experiments described in this thesis.
2.1 Optics of the eye
The optical properties of the human eye determine the focus of light on the retina and the optical quality of the retinal image. Any mismatch between the optical power of the ocular components and the axial length of the eye results in optical defocus and a blurred retinal image. The ability of the eye to resolve an image on the retina is determined by the optical quality of that image, the resolution of the photoreceptors and the subsequent neural mechanisms that process the visual information.
Optical focusing errors can be expressed in a number of ways. In terms of wavefront optics, the aberrations of the eye are classified as lower order (e.g., prism, defocus, astigmatism) and higher order (e.g., coma, spherical aberration) (Figure 2-1). The clinical correction of refractive errors is normally limited to correction of the spherical and astigmatic components, although the correction of higher orders is possible with spectacle lenses, contact lenses, refractive surgery or adaptive optics (Dai, 2008).
Figure 2-1 – Total wavefront aberrations (left), sphero-cylinder components (centre) and higher order aberration components (right). Total equals the sum of the sphero-cylinder and higher order components; colours at the red end of the spectrum indicate higher dioptric powers.
Spherical (defocus) errors result from the total power of the refracting surfaces focusing light in front of the retina (myopia) or behind the retina (hyperopia). While these spherical refractive errors can result from excessive power in the cornea or crystalline lens, they typically arise because the axial length of the eye is either too long (myopia) or too short (hyperopia) in comparison to the optical power of that particular eye (Deller et al., 1947). The following sections will deal specifically with the optical characteristics of astigmatism of the human eye.
2.2 Astigmatism
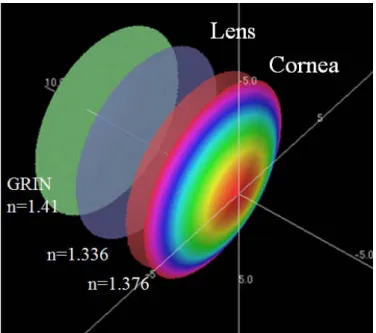
Astigmatism describes the refractive condition where parallel rays of light entering the eye are focused at two distinct focal lines that are perpendicular to one another, rather than at a single focal point. The majority of astigmatism of the eye typically occurs as a result of differences in the anterior corneal surface curvature of the two principal meridians, while the other refractive surfaces of the eye, including the posterior cornea, and the front and back surfaces of the lens also contribute to the total astigmatism. Because of the greater refractive index difference at the anterior corneal surface (n=1air to n=1.376cornea) compared to that at the posterior corneal surface (n =1.376cornea to n=1.336aqueous) (Figure 2-2), the posterior corneal surface contributes less astigmatism, even if the difference in radius of curvature between the two principal meridians is identical on the front and back surfaces. The astigmatism of the crystalline lens can arise from a range of factors including toric surface curvatures of the front and back surfaces of the lens, decentration or tilting of the lens with respect to the line of sight, or potentially due to asymmetric refractive index distribution across the lens. The lens has a gradient refractive index which is higher in the nucleus (about n=1.41), decreasing towards the cortex (about n=1.35) (Pierscionek et al., 1989).
The astigmatism induced by the anterior cornea is often known as corneal astigmatism, while the astigmatism induced by the other refractive surfaces is known as internal astigmatism. The astigmatism measured by keratometers is often called corneal astigmatism instead of anterior corneal astigmatism, because the keratometer has historically been calibrated with a refractive index of 1.3375, instead of the true refractive index of the cornea (n=1.376) (Phillips et al., 1997). By using a lower refractive index for the keratometer calibration, this reduces the anterior corneal surface power by about 10%, assuming that the posterior cornea will contribute -10% of the anterior corneal power (e.g., if anterior is + 2.00 DC x 90, then posterior is assumed to be - 0.20 DC x 90 or + 0.20 DC x 180).
The total ocular astigmatism is the combination of anterior corneal and internal astigmatism and the difference between the total and anterior corneal astigmatism is sometimes also referred to as residual astigmatism. The approximate ratio of the contribution of anterior corneal and internal astigmatism to the total astigmatism is defined by Javal’s rule (Grosvenor, 1978):
Figure 2-2– Schematic representation of the eye’s refracting surfaces; the front and back surfaces of the cornea and the front and back surfaces of the
Total astigmatism (DC) = 1.25 x anterior corneal astigmatism (DC) + 0.50 DC ATR
This rule is based on the probability that the posterior cornea only contributes a small amount of ATR astigmatism and the rule does not apply for cases of oblique astigmatism. The posterior corneal surface in adults contributes astigmatic refractive power of about 0.30 D ATR (Ho et al. 2009). Grosvenor et al. (1988) revisited this relationship between corneal and total astigmatism and suggested a simplified version of Javal’s rule. The slope of the regression was found to be close to 1, and the y intercept close to + 0.50 (i.e., + 0.50 DC ATR). Keller et al. (1996) studied the relationship between corneal and total astigmatism using videokeratoscopy across a range of entrance pupil sizes from 2 to 7 mm and compared this with subjective refraction for the same entrance pupil sizes. The linear regressions were similar for all pupil sizes and were consistent with the simplified Javal’s rule described by Grosvenor, et al. (1988).
The axis of astigmatism is typically classified as with-the-rule (WTR) astigmatism, against-the-rule (ATR) astigmatism or oblique (OBL) astigmatism. In WTR the minus correcting cylinder axis is near to horizontal (between 150 and 30 degrees) (Baldwin et al., 1981; Hashemi, et al., 2011). This is typically due to the vertical meridian of the cornea being steeper than the horizontal meridian (Hayashi et al., 1995) (Figure 2-3). In ATR astigmatism the minus correcting cylindrical axis is near to vertical (60 to 120 degrees) and it typically occurs because the steepest meridian of the anterior corneal surface is near to the horizontal axis (Hayashi, et al., 1995; Chen, Zuo, et al., 2013). In OBL astigmatism the minus correcting cylinder axes are between the WTR and ATR axes (30 to 60 and 120 to 150 degrees) (Bennett, 1984; Saunders, 1986) and it is the least common form of astigmatism (Satterfield, 1989).
2.2.1 Symmetry of astigmatism between right and left eyes
McKendrick and Brennan (1996) reported that the mean value of the cylindrical power and axis were similar between the right and left eyes of patients within their cohort, but there was no distinct predominance of axes showing direct or mirror symmetry. Studies by Dunne et al. (1994) and Garcia et al. (2003) have found evidence for mirror symmetry of axes between eyes. In a more recent study, Guggenheim et al. (2008) also provided evidence that the axes of astigmatism in fellow eyes exhibit mirror rather than direct symmetry.
The following sections provide an overview of the association between astigmatism and other refractive errors, the influence of genetics on the development of astigmatism and the changes in astigmatism that occur with ageing.
2.2.2 Association between spherical refractive error and astigmatism
In a study of the wavefront aberrations of the eye, Porter et al. (2001) reported that astigmatism (≥ 0.25 D) exists in 73% of adult human eyes with myopic refractive error. Both spherical and astigmatic refractive errors are also often found together in children (Fan, et al., 2004; Lai et al., 2010), with strong evidence showing an association between the presence of astigmatic and spherical refractive errors (Fulton
Figure 2-3 – With-the-rule astigmatism (left) has the steeper corneal meridian along the vertical meridian (90 ± 30 degrees), oblique astigmatism (centre) has the steeper corneal meridian between(30 to 60 and 120 to 150 degrees, while against-the rule astigmatism (right) has the steeper corneal meridian along the horizontal meridian (180 ± 30 degrees);
et al., 1982; Goss et al., 1990; Gwiazda et al., 2000; Farbrother et al., 2004; Heidary et al., 2005). The relationship between astigmatism and myopia was studied by Gwiazda, et al. (2000) in a longitudinal study from 1974 to 2000 which followed 245 participants for up to 23 years. Their results showed that infantile astigmatism was associated with increased astigmatism and myopia during the school years, and that ATR astigmatism was significantly associated with higher levels of myopia after the age of seven.
Farbrother, et al. (2004) also noted an association between the development of myopia and astigmatism in a large study of 90,884 subjects. They showed a strong association between the astigmatic axis (especially WTR astigmatism) and high levels of spherical refractive error (both hyperopia and myopia). They also reported that subjects with low levels of ametropia, especially myopic subjects (21-30 years of age), were more likely to exhibit ATR astigmatism. In a later study (Heidary, et al., 2005), found a high prevalence of astigmatism within a population (217 participants) that had high levels of myopia and the severity of myopia was found to be associated with astigmatism, which was predominantly WTR. A number of studies have also found an association between the presence of astigmatism and anisometropia (Yamashita et al., 1999; Qin et al., 2005; Linke et al., 2011). However, some studies have failed to find n association between astigmatism and the presence of myopia (Pärssinen, 1991) or myopia progression (Goss, et al., 1990).
A role for astigmatism in the development of spherical refractive error has been proposed by various authors (Howland, 1982; Gwiazda, et al., 2000). Gwiazda, et al. (2000) noted that ATR astigmatism in infants was associated with a higher prevalence of myopia and astigmatism during childhood and suggested that astigmatism interacts with the emmetropisation process in the developing eye. Buehren et al. (2007) analysed the optical changes in the cornea due to eyelid pressure following reading and proposed that hyperopic defocus and ATR astigmatism would provide the best retinal image and that this subsequently could promote the eye to become myopic with ATR astigmatism. Vincent et al. (2013) also examined the optical changes occurring in the cornea after reading in the fellow eyes of anisomyopes. Greater levels
of ATR were noted in the more myopic eye and this led to the proposal by these authors that astigmatism may influence eye growth in anisomyopia.
2.2.3 The influence of genetics on astigmatism
The development of astigmatism also appears to be influenced by genetic factors. Wixson (1965) demonstrated that the corneal powers of children were influenced by the corneal power of their parents’ eyes, while Clementi et al. (1998) analysed familial trends in corneal astigmatism and found that when families with high levels of astigmatism are included, modelling suggests a degree of heritability of astigmatism.
Studies of twins have compared monozygotic and dizygotic twins to examine the effect of genetics on astigmatic refractive errors. However the results have been ambiguous. Teikari and O’Donnell (1989) and Valluri et al. (1999) found no substantial differences in astigmatism between monozygotic and dizygotic twins. However, Teikari et al. (1989) found more similarity in the axes of astigmatism in monozygotic twins compared to dizygotic twins. Hammond et al. (2001) studied the refractive error similarity of over 500 twin pairs and found some heritability of astigmatism, but less than that for spherical refractive errors. In recent genome-wide association studies, various potential candidate genes associated with astigmatism development have been identified (Fan et al., 2011; Han et al., 2011; Lopes et al., 2013)
2.2.4 Prevalence and changes of astigmatism with age
The prevalence of astigmatism, along with its power and axis, are reported to change across the lifespan. Infants are reported to show a high prevalence of astigmatism during the first year of life (Atkinson et al., 1980), which has been shown to reduce over the subsequent years up until school age (Dobson et al., 1984; Gwiazda et al., 1984; Rowland et al., 1985; Abrahamsson et al., 1990; Ehrlich et al., 1997).
Dobson, et al. (1984) examined the data of 281 children aged up to 9.5 years old with astigmatism (≥ 1.00 D). They found a change of astigmatic axis with age, with those astigmatic children under 3.5 years old showing predominantly ATR astigmatism, transitioning to be predominantly WTR astigmatism for those over 5.5 years old. Fan, et al. (2004) found a higher incidence of astigmatism in Chinese preschool children than that previously reported, with 55.8 % of school-age students having at least 0.50 D of astigmatism which was predominantly WTR in axis.
The prevalence of astigmatism in adults over 30 years of age was reported to be 24.5% in Handan, China (Liang et al., 2009). In older populations older than 65 years of age, the prevalence was as high as 74% in Taiwan (Cheng et al., 2003). Ferrer-Blasco, et al. (2009) noted that the mean level of astigmatism in an adult population less than 40 years of age was 0.75 DC, and that the average level of astigmatism increased slightly in older populations up to 70 years of age.
A change is consistently reported in the average astigmatic axis in adults with increasing age. In general, there tends to be a shift from predominantly WTR towards ATR astigmatism with increasing age in adults (Anstice, 1971; Saunders, 1986). Hashemi, et al. (2011) showed that both ATR and OBL astigmatism increased with age, however, the increase in ATR (45.6%) with age was greater than the increase in OBL astigmatism (33.7%) with age. These changes in total astigmatic axis seem to be due to changes in corneal astigmatism, with various studies showing that corneal astigmatism changes from predominantly WTR in young adults to more oblique axes and ATR in older adults (Anstice, 1971; Baldwin, et al., 1981; Liu et al., 2011).
In summary, astigmatism is a common refractive error and demonstrates changes in both magnitude and axis with increasing age. Astigmatism changes from being predominantly ATR in infants to being predominantly WTR around 5-6 years of age. For young adults, a low magnitude of astigmatism (0.25 DC) is common. With-the-rule astigmatism is most common in adults, with OBL astigmatism being the least prevalent. In adults, corneal astigmatism shows a change from being predominantly WTR in young adults to more OBL and ATR with increased age.
The following two sections provide an overview of some of the issues associated with the correction of astigmatism, including adaption of the visual system to the presence of astigmatism, and the various optical means to correct astigmatism.
2.2.5 Blur adaptation and astigmatism
When exposed to spherical refractive blur, the visual system demonstrates the ability to partially adapt to the blur, so that visual acuity improves over time in the presence of blur (Pesudovs et al., 1993; Mon-Williams et al., 1998). The time course of this adaptation is rapid and plateaus after around 6 minutes (Khan et al. 2013). A similar phenomenon has been shown to occur with astigmatic blur (Sawides et al., 2010; Ohlendorf et al., 2011; Vinas et al., 2012; Kompaniez et al., 2013; Vinas et al., 2013). This process of adaptation appears to be sensitive to both the power and the axis of the astigmatism (Sawides, et al., 2010; Ohlendorf, et al., 2011), with larger amounts of astigmatic blur resulting in greater levels of adaptation, and adaptation to astigmatic blur along the vertical meridian resulting in clear images appearing blurred along the horizontal meridian. The short-term impact of astigmatic blur also appears to be lessened when the axis of the induced astigmatism matches the natural axis of astigmatism and is worse when the axis is perpendicular (Vinas, et al., 2013).
2.2.6 The correction of astigmatism
The optical correction of astigmatism can take many forms including spectacles, contact lenses and refractive surgery. Lenses to correct astigmatism are described as cylindrical or toric and the axes of the maximum and minimum powers of the cylindrical lens are orthogonal. The axes of the cylindrical lens are aligned with the axes of the astigmatism of the eye to provide optical correction.
In spectacle correction, the axis of the cylindrical lens is appropriately aligned in the spectacle frame to match the eye’s astigmatism. Contact lens correction is more complex. Soft toric contact lenses require some form of stabilisation in the lens to maintain the correct axis of the cylindrical lens power. Because soft toric contact lenses are more difficult to fit, are available only in limited powers and axes of
cylinder and are more expensive than soft spherical contact lenses, low levels of astigmatism (<1.00 DC) are often left uncorrected in soft contact lens wearers (Richdale et al 2007). Any unwanted rotation of the soft toric lens whilst in the eye can also result in residual uncorrected astigmatism (Chamberlain et al 2011).
Rigid spherical contact lenses naturally correct a large proportion (89%) of the anterior astigmatism through the tear lens that forms beneath the contact lens (Read et al., 2014). If a spherical rigid contact lens still leaves residual astigmatism, this can be corrected with a toric rigid lens design (Phillips, et al., 1997). Lower levels of astigmatism can also be corrected through the emerging procedure of astigmatic orthokeratology (Chen et al., 2012; Chen, et al., 2013), where the rigid contact lens is designed to alter the astigmatic shape of the anterior corneal surface. The surgical correction of astigmatism can also involve reshaping of the corneal surface (e.g., LASIK for astigmatism) (Koller et al., 2006; Bababeygy et al., 2008) or the implantation of intra-ocular toric lenses during cataract surgery (Ahmed et al., 2010; Holland et al., 2010).
The remainder of this literature review focuses on the functional impacts of astigmatism. Topics to be considered include refractive error and quality of life, refractive error and reading, refractive error and driving performance, impact of impaired vision on tasks involving cognitive skills, the impact of astigmatism on visual acuity and reading performance, and testing visual acuity and reading with Chinese characters.
2.3 Refractive error and quality of life
Refractive error has received increasing attention because of its high prevalence in many regions of the world (Katz et al., 1997; Wu et al., 2001; Xu et al., 2005; Vitale et al., 2008). The World Health Organization (WHO) and the International Agency for the Prevention of Blindness (IAPB) have highlighted the fact that uncorrected refractive error is a leading cause of visual impairment (World Health Organisation, 2007). A number of studies have assessed vision-related quality of life using a standardised 25-item vision-specific quality of life (VQOL) instrument, the National
Eye Institute Visual Function Questionnaire (Nirmalan et al., 2005; Suzukamo et al., 2005). Using this instrument, a measurable impact of correctable visual impairment on VQOL has been found in various cross-sectional studies. Nirmalan, et al. (2005) reported that uncorrectable and correctable refractive error both reduced VQOL and visual acuity. In another study, participants who received optimal correction had greater improvements in near and distance visual acuity, and VQOL than those who were inaccurately-corrected, or uncorrected (Coleman, et al., 2006).
Rahi et al. (2008) reported that the vision loss caused by uncorrected refractive error not only decreased VQOL but also increased the difficulty when performing a range of vision-related tasks, including reading and driving (Margolis et al., 2002). Previous researchers have also shown that refractive error significantly impacts on performance of vision-related daily living activities that relates to the associated decrease in visual acuity and vision function (Lamoureux et al., 2004). These results suggest that refractive errors not only impact on visual acuity, but have the potential to also decrease many aspects of vision-related function and quality of life. The effects of refractive error on functional tasks including reading and driving are described in the following sections.
2.4 Refractive error and reading
Reading is an important skill that is used in many daily tasks. The impact of refractive error on reading performance depends to some extent on chart design. Distance and near visual acuity charts can make use of isolated letters and lines of letters, while isolated words and continuous text are also used in near visual acuity charts (Bailey et al., 2013). However, these forms of charts have different levels of legibility and require different cognitive abilities for optimal performance. Bailey, et al. (2013) emphasised that it is better to assess near visual acuity using letter-by-letter scoring, while unrelated words can be used as an indicator of near reading ability. Legge et al. (1989) developed the MNREAD charts based on continuous text with a logarithmic size progression that can also be used for assessing reading speed. More recently, Wolffsohn and Cochrane (2000) introduced another reading chart, known as the Practical Near Acuity Chart (PNAC), which used a single paragraph of three related
words on each line (3-letter word, 4-letter word, and 5-letter word). Near acuity measured with the PNAC and Bailey-Lovie charts was highly correlated (r = 0.97), although the time taken to measure near acuity with the PNAC was faster than with Bailey-Lovie charts.
West et al. (2002) demonstrated that the visual acuity loss caused by uncorrected refractive error contributed to deficits in performance of vision-related daily tasks such as reading and near work. Uncorrected refractive errors have been shown to have a significant negative effect on reading performance (Taylor, 2000). Chung et al. (2007) using the MNREAD Acuity Charts also found a relationship between increasing amounts of spherical blur and reduced maximum reading rates, threshold print size and reading acuity.
2.5 Refractive error and driving
The efficient integration and timely processing of visual information from various sources are two important components of an individual’s ability to complete daily tasks. Wood et al. (2009) suggested that visual impairment degraded visual processing speeds and impacted not only on the ability to undertake visual tasks, but also on the ability to apprehend and quickly process sensory information. For example, drivers with visual blur are likely to have difficulty reading highway signs in the distance (such as signs of speed limit, stop, and exit) which is important for safe vehicle control decisions (Schieber, 2004). Kline et al. (1999) reported that night-time sign recognition was significantly reduced when visual acuity was degraded, and the ability to detect road hazards and avoid them was significantly worse when participants were driving with visual impairment. However there is only a weak association between reduced visual acuity and driving crash risk (Owsley et al., 1999; Owsley et al., 2001; Owsley et al., 2010).
Blurred vision due to spherical refractive errors has been found to impair a number of aspects of driving performance, including total driving time, hazard avoidance and sign recognition, while lane-keeping and gap judgements appear to be relatively unaffected by blur (Higgins, et al., 1998). Spherical blur as low as 0.50 DS reduced
overall measures of driving performance on a closed road at night but not during the daytime (Wood, et al., 2014), as well as the ability to detect and recognise pedestrians at night (Wood et al., 2012). Chu et al. (2010) also showed that bifocal contact lenses significantly reduced many aspects of night-time driving performance on a closed road circuit.
2.6 Impact of impaired vision on tasks involving cognitive skills
Functional vision can be considered to involve the integration of information requiring both visual and cognitive skills. Dickinson et al. (1991) noted that reading rate should not be the sole measure of the capacity for reading and suggested using tests that require additional cognitive processing ability to better reflect performance on everyday tasks. The Digit Symbol Substitution Test (DSST) and the Trail Making A and B Tests (TMT) are standardised tests that require integration of visual ability, including visual search as well as cognitive skills. A number of studies have reported that performance on these types of tests is impacted by various forms of visual impairment.
Wood, et al. (2009) reported that visual impairment comprising reduced contrast sensitivity that was simulated using specially designed filters, significantly increased the time taken to complete the DSST and the TMT A and B in young adults. These results were also shown to extend to older adults, where the time taken to complete selected cognitive tasks that involved speed of visual processing was significantly impaired when visual input was degraded using filters that reduced contrast sensitivity in a similar manner to that of early cataracts (See et al., 2010; Wood, et al., 2012). Similarly, Hunt et al. (2010) reported that speed of visual information processing was slowed for older adults when the appearance of paper-based versions of the DSST charts was blurred, rather than blurred using optical lenses or filters as was the case in other studies. The productivity of computer users was found to be negatively impacted by impaired vision induced by 2.00 DC of imposed astigmatism (Daum et al., 2004) and 1.50 DC astigmatism (Sheedy et al., 1990), with the time to complete tasks increased by up to 29% and 12%, respectively. However, the impact of astigmatic blur on the performance of laboratory-based or everyday functional tasks involving
the integration of vision and cognitive skills has received relatively little attention, with the majority of literature focusing on the impact of astigmatic blur on standardised measures of visual acuity as described in the following sections.
2.7 Impact of astigmatism on visual acuity
The effects of astigmatism on visual function are determined by the meridional blur induced by the condition. The focal planes of astigmatism are orthogonal and in the case of ATR (negative correction cylinder axis x 90 degrees), the more myopic meridian tends to blur vertical detail, whereas in WTR (negative correcting cylinder axis x 180 degrees) the more myopic meridian blurs the horizontal detail (Figure 3-4). The magnitude of retinal blur depends on a range of factors such as pupil size and the interaction with other optical aberrations of the eye, such as spherical error and higher order aberrations.
The location of the astigmatic focal planes with respect to the retina will be also be influenced by the eye’s accommodation response. Astigmatism can be present in a variety of forms, for example: as a crossed cylinder of +0.50DS/-1.00 DC x 90, as a simple hyperopic astigmatism of -1.00 DC x 90, or as simple myopic astigmatism of +1.00 DC x 180. In the case of crossed cylinder astigmatism (+0.50DS/-1.00 DC x 90), the circle of least confusion (as defined by geometrical optics) is placed at the retina. In the case of simple hyperopic (-1.00 DC x 90) or myopic (+1.00 DC x 180) astigmatism, one focal plane is at the retina while the other focal plane is behind (hyperopic) or in front (myopic) of the retina. In an eye with active accommodation, the level of accommodation response and the target vergence will therefore determine the relative locations of the orthogonal astigmatic focal planes with respect to the
Figure 2-4 – The effect of different axes of astigmatism on image quality. In myopic ATR the vertical detail is blurred, in myopic OBL the oblique detail is blurred and in myopic WTR the horizontal detail is blurred.
retina. Stark et al (2003) provided a detailed summary of these possible focussing strategies and they included focusing using the least accommodative response, the most accommodative response, the circle of least confusion, other intermediate focal positions within the astigmatic interval, the more ‘‘vertical’’ focal detail, the more ‘‘horizontal’’ focal detail, the response closest to the resting or tonic level of accommodation, or dynamic/fluctuating accommodation to periodically optimize each focal plane.
Atchison et al. (2009) used adaptive optics to test the subjective limits of the perception of spherical and crossed cylinder astigmatic blur. They found that the average astigmatic blur detection was about 90% of the dioptric value of spherical blur (for defocus considered to be “just noticeable” this was 0.18 DS and 1.01 DS for “bothersome” blur). Both Applegate et al. (2003) and Rocha et al. (2007) also found that the blur detection threshold of crossed cylinder astigmatism was similar to that found for defocus. However, these authors also noted variability between subjects in the expected improvement associated with correcting low amounts of natural astigmatism (< 0.50 DC) and concluded that under clinical conditions, there was little benefit in correcting these small amounts of astigmatism.
Watanabe et al. (2013) examined the effect of hyperopic astigmatism with cycloplegia on visual acuity in 0.50 DC steps, from 0.50 to 2.50 DC, and reported that visual acuity was significantly negatively correlated with increasing cylinder power. Pesala et al. (2014) measured the impact of uncorrected astigmatism on visual acuity in pseudophakic eyes in 0.50 DC steps up to ± 2.50 DC, and reported that both increasing negative and positive astigmatism had a similar linear effect in decreasing distance visual acuity. Near visual acuity has the potential to be improved with positive astigmatism, since the myopic astigmatic focal plane provides some improvement in near image quality along one meridian (Casagrande, et al., 2013).
Most studies that have investigated the impact of the axis of astigmatism on visual acuity have reported that ATR astigmatism causes a greater loss of visual acuity than WTR or OBL astigmatism. Studies by both Wolffsohn et al. (2011) and Wills et al.
(2012) noted that simulated ATR crossed cylinder astigmatism had more impact on visual acuity and reading performance than WTR crossed cylinder astigmatism, particularly for smaller print size targets. Atchison, et al. (2009) also reported higher levels of sensitivity to the detection of blur with ATR than WTR crossed cylinder astigmatism. In addition, Yamamoto et al. (2014) reported that patients who had ATR astigmatism following monofocal intraocular lens implantation had significantly worse visual acuity that those with WTR astigmatism. Importantly, Vinas, et al. (2013) noted that the impact of astigmatic blur was dependent on the orientation of induced astigmatism and that this effect was significantly influenced by the eyes natural axis of astigmatism.
Of relevance to the impact of astigmatism on visual acuity are the prescribing patterns of optometrists with respect to astigmatic correction. O’Leary and Evans (2003) found that the majority of optometrists would correct astigmatism at levels of 0.75 DC and above. In a study comparing spherical and toric soft contact lenses, Richdale et al. (2007) concluded that the correction of 0.75 DC to 1.00 DC astigmatism produced a clinically significant improvement in visual acuity. Hayashi et al. (2010) also concluded that for patients with intraocular lens implants (IOL) following cataract extraction, it was clinically advisable to consider toric IOLs when the level of astigmatism reaches 1.00 DC.
In summary, both the level of astigmatism and the orientation of the astigmatic axis impact on distance and near visual acuity. Most clinical studies suggest that a threshold of the order of 0.75 DC requires correction to improve visual acuity, however, astigmatic blur can be detected at much lower values.
2.8 Impact of astigmatism on reading performance
As stated in the previous sections, functional vision testing is an important method to define visual ability along with standard visual acuity testing (Kaido et al., 2006). Yamaguchi et al. (2011) suggested that a functional vision assessment should involve daily tasks, such as reading. Dickinson, et al. (1991) imposed simulated crossed cylinder astigmatism and noted that reading rates were impaired by astigmatism,
while Whittaker and Lovie-Kitchin (1993) also found that reading tasks became more difficult in the presence of uncorrected astigmatism.
In a detailed study of the effects of astigmatism on reading, Wills, et al. (2012) found that simulated crossed cylinder astigmatic blur reduced reading rates compared with baseline for all of the tested levels and axes of astigmatism (1.00 and 2.00 DC, ATR and WTR astigmatism). They noted that reading rate for N16 print size was decreased by 10% with 2.00 DC WTR astigmatism, while for smaller print sizes of N12 and N10, the reduction of reading rate was up to 24% with 1.00 DC ATR astigmatism and both ATR and WTR astigmatism at 2.00 DC. They noted that ATR astigmatism had a greater impact on reading fluency than WTR astigmatism, even for small amounts of astigmatism. Wolffsohn et al. (2011) also reported that reading speeds were decreased with increasing levels of uncorrected crossed cylinder astigmatism, but only for powers of astigmatism of 3.00 DC or greater. They also showed that uncorrected crossed cylinder ATR astigmatism resulted in a greater reduction in reading rate compared to OBL astigmatism.
Kobashi et al. (2012) investigated the effects of ATR, WTR, and OBL myopic astigmatism at 1.00, 2.00 and 3.00 DC with cycloplegia and found that reading performance decreased significantly with increasing levels of astigmatism. In addition, they reported that the axis of each level of astigmatism impacted on reading acuity and the maximum reading speed, with performance with OBL astigmatism being worse than that with ATR and WTR astigmatism. However, there was no significant difference in reading performance between ATR and WTR astigmatism. Casagrande, et al. (2013) used cycloplegia and 0 DC, -0.75 DC, and -1.50 DC of ATR and WTR astigmatism and found that increasing astigmatism resulted in reduced reading acuity, with WTR astigmatism causing a greater reduction in reading acuity and slower reading speeds compared with ATR astigmatism. Table 2-1 summarises previous studies that have compared the effect of the axis of astigmatism on visual performance. Overall, most studies have demonstrated that ATR causes a greater loss of performance than WTR or OBL astigmatism, although this is not always the case.
(ATR=against-the-rule astigmatism; WTR = with-the-rule astigmatism; OBL=oblique astigmatism; MNRead-J = Japanese version of the Minnesota Low Vision Reading Test acuity charts)
2.9 Testing visual acuity and reading with Chinese characters
Only a limited number of studies have used visual acuity charts that have included Chinese characters to determine distance or near visual performance (Woo et al.,
Author (Date) Subjects (n) Age mean +/- SD Visual performance Testing chart Axis Trindade et al. (1997) 20 71.75 ± 7.47 Distance VA Near VA Snellen Jaeger WTR = ATR ATR > WTR Remón et al. (2006) 4 20 Distance VA Letters or Landolt C ATR = WTR = OBL Atchison, et al. (2009) 6 31 ± 10 Blur limit Letters ATR > WTR Wolffsohn, et al. (2011) 21 58.9 ± 2.8 Distance VA Near VA logMAR logMAR ATR > WTR = OBL ATR > WTR = OBL
Reading rate Standardised
texts ATR > OBL Wills, et al. (2012) 30 21.7 ± 3.4 Distance VA Near VA Bailey-Lovie Bailey-Lovie ATR > WTR ATR > WTR
Reading rate Bailey-Lovie ATR > WTR
Kobashi, et
al. (2012) 38
44.9 ± 19.5
Distance VA Landolt-C OBL > WTR = ATR
Reading MNRead J OBL > WTR =
ATR Casagrande, et al. (2013) 23 26 ± 6 Near VA Reading speed Snellen Standardised sentences WTR > ATR WTR > ATR Table 2-1 – Summary of studies comparing the effect of astigmatic axis orientation on visual performance
1980; Johnston, 1985), despite the fact that a large proportion of the world’s population consists of readers of Chinese. While English characters are mostly composed of 3-5 strokes (depending on the font type), Chinese characters can range in complexity from 2-18 strokes per character (Zhang et al., 2007). A recent study explored whether reading visual span (number of characters seen in each fixation) is affected by the level of complexity of Chinese text (Wang et al., 2014). These authors demonstrated in a group of bilingual (English and Chinese) subjects that as the complexity of the Chinese characters increased, the visual span was found to get smaller, suggesting that reading rate would also be likely to diminish.
Zhang et al. (2009) also explored the effect of Chinese character complexity by investigating the legibility of Chinese characters of different levels of spatial complexity both with and without the spherical blur of up to + 2.00 DS. Their study demonstrated that Chinese characters with more strokes resulted in lower levels of visual acuity, but that the introduction of blur caused a similar rate of loss of visual acuity with Chinese and Snellen E optotypes. The link between reading rates, blur and Chinese character complexity is clearly a complex topic and importantly, the influence of astigmatic blur of different levels of power and axes on visual acuity and reading performance with Chinese text has not been investigated.
2.10 Rationale
In summary, a number of researchers have shown that uncorrected spherical refractive error and simulated visual impairment result in problems in the performance of a number of vision-related daily living tasks and activities (Rahi, et al., 2008; Wood et al., 2010). These tasks include, for example, reading performance and performance on a variety of cognitive tests (Taylor, 2000; Wood, et al., 2009; Wood, et al., 2010). Importantly, there has been only limited research investigating the effects of blurred vision resulting from uncorrected astigmatic refractive error on functional measures such as reading performance (Villegas et al., 2014). While the above research findings clearly highlight the important relationship between visual blur and performance measures that require integration of vision and cognition, the issue of uncorrected astigmatism has rarely been considered; this is important given the relatively high
prevalence of astigmatism of various axes in both children as well as in adult populations.
Studies that have explored the impact of spherical blur on visual performance have demonstrated that as the magnitude of spherical blur increases, visual performance decreases. However, the impact of astigmatic blur on visual function is much less well understood. Astigmatic blur has two important features, power and axis. While increasing the power of astigmatism has been shown to cause greater losses of vision, the impact of axis is less consistent and potentially depends on the interaction between the blurred meridian (axis) of the retinal image and the orientation of the salient features within the scene or visual task being undertaken. Orientation dependency of astigmatism is a key factor in understanding its impact on the performance of visual tasks.
In Experiment 1, the influence of a comprehensive range of astigmatic powers and axes on visual performance for distance visual acuity, near visual acuity and reading rate for a range of font sizes was investigated. The effect of equivalent levels of spherical blur on distance visual acuity were also studied and compared to that resulting from astigmatic blur.
In Experiment 2, the effect of astigmatic blur was investigated for a range of tests that involve visual resolution, eye movements and cognitive demands including visual processing speeds. This second experiment investigated how astigmatic blur impacts on the performance of those visually-related tasks that reflect the way in which we make use of vision under more complex everyday situations.
Finally, in Experiment 3 the impact of astigmatism on visual acuity and reading rates with Chinese characters was investigated and compared to the effect of astigmatism on English text. Chinese text was chosen since it differs from English text in that it contains more spatially complex characteristics, with details at a variety of angles within a symbol. Given the orientation dependent nature of astigmatic blur, it was
considered that Chinese symbols may present a particular challenge in the presence of astigmatic blur.
Chapter 3:
Impact of simulated astigmatic
refractive blur on visual acuity and reading
3.1 Introduction
It is well known that astigmatism influences both distance and near visual acuity (Trindade, et al., 1997; Kobashi, et al., 2012). Studies have shown an approximately linear reduction in distance visual acuity with increasing cylindrical power, with a loss of 1-2 lines of logMAR distance visual acuity per dioptre of cylindrical power, although the method of inducing astigmatic error varied amongst the studies (Remón, et al., 2006; Atchison et al., 2011; Watanabe, et al., 2013). The impact of astigmatism on visual acuity has also been shown to depend on the axis of astigmatism. Visual acuity has been shown to be reduced to a greater extent when the axis of crossed cylinder astigmatism is either ATR (Wolffsohn, et al., 2011; Wills, et al., 2012) and/or OBL (Wolffsohn, et al., 2011). However, other authors have failed to find a difference in the effect of different crossed cylinder astigmatic axis on visual acuity (Ohlendorf et al 2011).
While there is significant evidence showing that astigmatic blur reduces visual acuity, there has been only limited research investigating the effect of astigmatism on functional visual performance. Wills, et al. (2012) reported that reading rate was reduced by crossed cylinder astigmatism, depending on the power and axis of astigmatism. Similarly, Wolffsohn, et al. (2011) reported that reading speed was reduced for uncorrected crossed cylinder astigmatism, however, they also reported that other functional measures including glare sensitivity and performance on a computer-based simulated driving performance task were unaffected by astigmatism.
The aim of this study was to investigate how simulated crossed cylinder astigmatism, in terms of both power and axis, impacts upon distance and near visual acuity and reading performance. This first study extends previous work by testing at lower levels of astigmatism and at a range of axes.
3.2 Methods 3.2.1 Participants
Participants included 12 young adults (mean age 23.92 ± 5.49 years; range 18 to 34 years) and included 8 females and 4 males. All participants gave informed consent and the study was conducted in accordance with the Declaration of Helsinki (Ethics forms in Appendix 1).
The inclusion criteria included: (1) age between 18-35 years; (2) first spoken and written language to be English; (3) good general health with no self-reported neurological illness or cognitive impairment; (4) no history of significant ocular disease or injury; (5) normal binocular vision function (no history of strabismus or ocular motility disorders); (6) astigmatism less than or equal to 0.50 DC to minimise the habitual adaption to uncorrected astigmatism; and (7) best corrected visual acuity of 0.00 logMAR or better in both eyes.
3.2.2 Screening procedures
All participants underwent a screening procedure to determine whether they met the study inclusion criteria. The tests included in the vision screening assessment were:
(a) Case history
Each participant was interviewed to obtain information regarding their ocular history, including whether they had any significant history of ocular trauma or surgery and their general health (including medication use).
(b) Refractive error
Each participant’s refractive status was determined by an experienced and qualified optometrist using non-cycloplegic retinoscopy followed by
monocular subjective refraction using a phoropter and standard cross cylinder procedures and binocular balancing using alternate occlusion.