MEG-based detection and localization of perilesional dysfunction in
chronic stroke
Ron K.O. Chu
a,c,*, Allen R. Braun
e, Jed A. Meltzer
a,b,c,d aUniversity of Toronto, Department of Psychology, 100 St. George Street, 4th Floor, Sidney Smith Hall, Toronto, ON M5S 3G3, Canada bUniversity of Toronto, Department of Speech-Language Pathology, 160-500 University Avenue, Toronto, ON M5G 1V7, Canada c
Rotman Research Institute, Baycrest Centre, 3560 Bathurst St., Toronto, ON M6A 2E1, Canada d
Heart and Stroke Foundation Canadian Partnership for Stroke Recovery, 600 Peter Morand Cres., Suite 201, Ottawa, ON K1G 5Z3, Canada e
Language Section, National Institute on Deafness and Other Communication Disorders, National Institutes of Health, Bethesda, MD, USA
a b s t r a c t
a r t i c l e i n f o
Article history:
Received 13 November 2014 Received in revised form 20 March 2015 Accepted 23 March 2015
Available online 8 April 2015 Keywords:
Magnetoencephalography Beamformer source reconstruction Time–frequency analysis Chronic stroke
Post-stroke impairment is associated not only with structural lesions, but also with dysfunction in surviving perilesional tissue. Previous studies using equivalent current dipole source localization of MEG/EEG signals have demonstrated a preponderance of slow-wave activity localized to perilesional areas. Recent studies have also demonstrated the utility of nonlinear analyses such as multiscale entropy (MSE) for quantifying neuronal dysfunction in a wide range of pathologies. The current study utilized beamformer-based reconstruction of sig-nals in source space to compare spectral and nonlinear measures of electrical activity in perilesional and healthy cortices. Data were collected from chronic stroke patients and healthy controls, both young and elderly. We assessed relative power in the delta (1–4 Hz), theta (4–7 Hz), alpha (8–12 Hz) and beta (15–30 Hz) frequency bands, and also measured the nonlinear complexity of electrical activity using MSE. Perilesional tissue exhibited a general slowing of the power spectrum (increased delta/theta, decreased beta) as well as a reduction in MSE. All measures tested were similarly sensitive to changes in the posterior perilesional regions, but anterior perilesional dysfunction was detected better by MSE and beta power. Thefindings also suggest that MSE is specifically sen-sitive to electrophysiological dysfunction in perilesional tissue, while spectral measures were additionally affect-ed by an increase in rolandic beta power with advancaffect-ed age. Furthermore, perilesional electrophysiological abnormalities in the left hemisphere were correlated with the degree of language task-induced activation in the right hemisphere. Finally, we demonstrate that single subject spectral and nonlinear analyses can identify dysfunctional perilesional regions within individual patients that may be ideal targets for interventions with non-invasive brain stimulation.
© 2015 The Authors. Published by Elsevier Inc. This is an open access article under the CC BY-NC-ND license (http://creativecommons.org/licenses/by-nc-nd/4.0/).
1. Introduction
Stroke causes profound disturbances to cognition, and is a leading cause of adult disability. One of the most debilitating cognitive impair-ments is aphasia, which typically occurs following damage to language networks in the left hemisphere. As stroke-induced cortical lesions are essentially permanent, language recovery is thought to proceed from processes of reorganization and neural plasticity occurring in structural-ly intact brain tissue. Specifically, reorganization of the language net-work after stroke is associated with the recruitment of structurally intact, perilesional tissue (Cornelissen et al., 2003;Warburton et al., 1999) and contralateral homotopic language areas (Musso et al., 1999; Thulborn et al., 1999;Tillema et al., 2008). Although both perilesional
and contralesional activities are thought to play a role in recovery, re-cruitment of perilesional areas is associated with a better long-term out-come (Heiss and Thiel, 2006), and a shift from right to left hemisphere activation has been observed to occur during spontaneous recovery (Saur et al., 2006) and with treatment (Wilson et al., 2012). With the ad-vent of noninvasive brain stimulation as a viable treatment for aphasia and post-stroke motor disorders, positive results have been obtained from efforts to induce a shift from contralesional to perilesional activity, either through excitatory stimulation of the affected hemisphere or through inhibition of the unaffected hemisphere (Kang et al., 2011; Marangolo et al., 2013;Naeser et al., 2005a;Szaflarski et al., 2011). It is still unknown why perilesional tissue remains underactivated in some patients. In some cases, patients may have large lesions that en-gulf most of the left hemisphere language areas; as such, language pro-cessing must be relegated to right hemisphere homologues. However in other cases, perilesional tissue may be structurally intact, but‘ function-ally lesioned’(Hofmeijer and van Putten, 2012) representing an ideal * Corresponding author at: 3560 Bathurst St., Toronto, ON, Canada. Tel.: +1 416 785
2500x2117.
E-mail address:[email protected](R.K.O. Chu).
http://dx.doi.org/10.1016/j.nicl.2015.03.019
2213-1582/© 2015 The Authors. Published by Elsevier Inc. This is an open access article under the CC BY-NC-ND license (http://creativecommons.org/licenses/by-nc-nd/4.0/). Contents lists available atScienceDirect
NeuroImage: Clinical
target for intervention. Therefore, noninvasive methods to identify functional abnormalities in the perilesional tissue will help guide phys-iological interventions to target the most relevant areas, and to assess their effectiveness. The current study demonstrates that spectral and nonlinear analyses of source localized MEG signals can be used to iden-tify dysfunctional perilesional tissue.
One of the most prominent indices of tissue dysfunction following stroke is a change in spontaneous oscillatory activity measured by spectral analyses of MEG/EEG signals. Studies have found in-creased low frequency (Butz et al., 2004; Harmony et al., 1995; Machado et al., 2004;Meinzer et al., 2013;Zappasodi et al., 2007) and attenuated high frequency (Cuspineda et al., 2009) spontaneous ac-tivity, localized to the perilesional areas. Importantly, improved func-tional outcomes are associated with a reduction in perilesional low frequency amplification (Meinzer et al., 2004, 2008;Zappasodi et al., 2007) and an increase in perilesional alpha-band functional connectiv-ity (Westlake et al., 2012). Thus, low frequency amplification and high frequency attenuation are promising indicators of dysfunctional perilesional tissue.
Although most characterizations of pathological spontaneous activi-ty in stroke have centered on spectral analyses, researchers have also applied techniques from thefield of nonlinear dynamics towards analy-sis of brain signals in other disorders (for a review, seeStam, 2005). In particular, measures based on the concept of entropy have been espe-cially useful. The various algorithms incorporating this term aim for a measure of the complexity of neural dynamics, with complexity indicat-ing a rich temporal structure that is neither random (e.g., white noise) nor strictly periodic. In this study, we examine multiscale entropy (MSE;Costa et al., 2002, 2005), an increasingly popular technique that assesses time series complexity across multiple time scales, reducing the arbitrariness inherent in pre-selecting a specific time scale (see the Methods section for details). Reduced MSE has recently been dem-onstrated in brain injury (Raja Beharelle et al., 2012), autism (Bosl et al., 2011;Catarino et al., 2011) and Alzheimer3s disease (Hornero et al., 2008;Park et al., 2007).
Given the success of MSE to characterize dysfunctional physiological signals, the current study aimed to compare MSE with the more tradi-tional measures of spectral power in their ability to characterize perilesional dysfunction. We used beamforming analysis of MEG data to localize and quantify abnormal perilesional activity in patients who have had a stroke in the left hemisphere of the brain. The patients were participating in a MEG study of language processing, aiming to identify networks that are recruited to support language comprehen-sion in post-stroke aphasia (Meltzer et al., 2013). In the present study, we analyzed spontaneous aspects of the MEG data collected from these patients, focusing on the intertrial interval of the language com-prehension task, but obtaining very similar results from data extracted from the task periods. We hypothesized that, irrespective of engage-ment in a cognitive task, altered neural dynamics would be present in the perilesional tissue, compared to other brain regions and compared to the same brain regions in healthy control participants. We used both spectral-based and entropy-based measurements, and report here the similarities and differences found in these approaches. Specifi -cally, the measures were compared along two levels: 1) the spatial ex-tent of abnormal spontaneous activity detected by these measures and 2) the degree to which spontaneous perilesional activity predicted lan-guage activation in the right hemisphere homologues, a frequently ob-served consequence of damage or dysfunction in the left hemisphere language areas (Crinion and Price, 2005;Saur et al., 2006;Thompson and den Ouden, 2008).
The above questions were addressed withfive different analyses. To address thefirst question, we 1) computed voxel-based comparisons of source localized relative power and MSE between patients and controls. To illustrate the differences in power spectra that drove the differences between groups seen in the whole-brain maps, we 2) additionally com-puted power spectra in selected regions of interest (ROIs). To address
the second question, we 3) computed task activation maps and 4) assessed correlations between task activation in the right hemi-sphere and characteristics of spontaneous signals in the left hemihemi-sphere. Finally, we 5) computed single subject maps to demonstrate the clinical utility of this approach for detecting tissue dysfunction within individu-al patients. Additionindividu-ally, to further characterize the relationships be-tween the nonlinear and spectral measures, we examined across-subjects correlations between MSE and relative power in different bands.
2. Methods 2.1. Participants
MEG data were obtained from three groups of participants, who had participated in studies of language comprehension (Meltzer et al., 2013; Meltzer and Braun, 2011). These included 25 patients (11 female, 2 left-handed) with aphasia, resulting from a single left-hemisphere ischemic stroke which occurred at least 6 months prior to testing (0.7–24.3 years, mean 5.8 years). Patients ranged in age from 34–72 years (mean 57). The study was approved by the Institutional Review Board of the NIH In-tramural Program (NIH protocol 92-DC-0178). The participants werefi -nancially compensated.
Imaging data from aphasic participants were compared with data from two control groups. First, there was a young control group, consisting of 24 healthy subjects (12 female, aged 22–37, mean 27). Ad-ditionally, to control for the effects of aging, we recruited an older con-trol group, consisting of nine healthy subjects matched in age to the aphasic patients (range 44–71, mean 53). All young and age-matched controls were right-handed. None of the participants reported any de-velopmental language difficulties.
The aphasic patients and the older control subjects underwent an extensive battery of cognitive and neurolinguistic assessments in addi-tion to MEG and structural MRI, while the younger controls only com-pleted the neuroimaging components. All older control subjects tested were within the normal limits on all cognitive and linguistic tests, while the aphasic patients exhibited deficits consistent with their diag-nosis of post-stroke aphasia. More details regarding the lesion charac-teristics and neuropsychological profiles of the patients can be found inMeltzer et al. (2013).
The smaller number of age-matched controls reduced the power of our contrasts to reveal aging-related changes. However, as demonstrat-ed in the results, both young and age-matchdemonstrat-ed controls demonstratdemonstrat-ed comparable differences relative to aphasic patients, localized to the perilesional regions, although the effects were stronger for young con-trols. Critically, the age-matched controls served to confirm that the cur-rentfindings were related to stroke and not aging.
2.2. Sentence picture-matching paradigm
The participants performed a sentence picture-matching task during MEG scanning. Complete details of the sentence and picture materials can be found in previous reports (Meltzer et al., 2013;Meltzer and Braun, 2011). A brief description of the paradigm is as follows. On each trial, subjects heard a sentence, spoken at a natural rate, while viewing afixation cross. After the sentence, thefixation cross remained during a 3-s memory delay. Next, the cross was replaced by two pic-tures. Subjects indicated which picture correctly depicted the action de-scribed in the sentence, by pressing the left or right button on afiber optic response box. Pictures remained on screen for 4 s, and were followed by an inter-trial interval of 2.1–2.25 s. Trials were presented in seven runs of 36 trials each, and subjects were allowed to rest in be-tween runs if desired. The total time for the experiment was approxi-mately 1 h and 30 min, including preparation.
Triggers were inserted into the MEG acquisition stream to allow for analysis of the MEG signal during each time period of the task. In the
present study, we assessed spontaneous aspects of perilesional neural activity by analyzing data from the intertrial interval, using data epochs consisting of 1 s prior to sentence onset. Thus, analyses are based on 252 1-s epochs per participant. Data from the intertrial interval reflect a state of seated relaxation but high alertness, as participants were en-gaged in a cognitive task but were not actively processing sensory or cognitive information at the time. The possible implications of this se-lection of data as opposed to“true rest”are addressed in the Discussion section.
2.3. Anatomical MRI
Each patient underwent an anatomical MRI session, for purposes of MEG source localization and lesion delineation. MRI was acquired on a General Electric, Signa 3-Tesla scanner with an 8-channel head coil, using parallel imaging with ASSET reconstruction. Scans included a T1-weighted 3D high-resolution MPRAGE (1 mm isotropic resolution, Fast Spin-echo T2, T2 and FLAIR (both 3.5 mm thick slices)). T1 images were skull stripped by applying a stripping procedure to the T2-weighted image, applying the resulting mask to the T1 image, and mak-ing further manual adjustments. This procedure produces better results than stripping the T1 image directly, due to the presence of large lesions that appear dark on T1 contrast.
Lesion borders were delineated using segmentation tools in FSL and ROI drawing tools in AFNI, based on a T1 intensity threshold followed by manual adjustments. Regions of gliosis were included in the lesion on the basis of hyperintense signal seen in a coregistered T2–FLAIR image. T1 images were spatially normalized by computing a 12-parameter affine registration between the individual patient brains and the“Colin brain”in Talairach space. Nonlinear registration algo-rithms produced slightly better registrations in some cases, but were not reliable for all patients in the presence of large lesions, so affine reg-istration was adapted for consistency across the cohort. Cost-function masking was applied using the individual lesion masks to exclude the lesioned area from the warp computation. Using the computed affine matrices, both T1 anatomical images and lesion masks were warped into Talairach space for group analysis of lesion characteristics and source-localized MEG activation.
For the display of activation maps derived from patient data, we con-structed a“composite lesion underlay”to indicate damaged regions with the greatest overlap across patients. The spatially normalized T1-weighted anatomical images of the 25 patients were averaged together. The resulting image was further darkened by subtracting a percentage of the signal proportional to the number of patients having a lesion at each voxel.
2.4. MEG acquisition and analysis
MEG was recorded with a CTF Omega 2000 system, comprising 275 first order axial gradiometers. For environmental noise reduction, syn-thetic third-order gradiometer signals were obtained through adaptive subtraction of 33 reference channels located inside the MEG dewar far from the head. Signals were digitized at 600 Hz with an anti-aliasingfi l-ter at 125 Hz. Head position was tracked continuously using coils placed at threefiducial points on the head (McCubbin et al., 2004, 2004). The average head position over the entire experiment was used for source localization, and coregistered with the samefiducial points marked on the anatomical MRI using adhesive marker disks. In no cases did the total root-mean-square of movement for any coil exceed 1 cm. 2.5. Synthetic aperture magnetometry
MEG source analysis was conducted using synthetic aperture mag-netometry (SAM) (Vrba and Robinson, 2001), as implemented in CTF software (CTF, Port Coquitlam, British Columbia, Canada). SAM is a beamformer technique that can be used to compute the full time course
of virtual channels at selected individual locations, or on a regular grid of locations (voxels) spread across the brain. SAM is a scalar beamformer, in which a nonlinear optimization technique is used to select one direc-tion of currentflow at each voxel to maximize dipole power. In short, SAM provides a series of weights for each voxel; the weights are com-puted so as to pass signal from a dipole located in the target voxel, while minimizing signal power from all other locations. We computed weights on a whole-brain grid of locations spaced 1 cm apart. These weights were then multiplied with the original sensor time series data to yield a new, spatiallyfiltered, time series signal at each voxel (1 cm3). Normalized weights were used to render virtual signals in
di-mensionless units of signal-to-noise ratio, with noise power estimated as the lowest singular value of the sensor covariance matrix (Vrba and Robinson, 2001). This weight normalization step is commonly used to compensate for the depth-bias inherent in beamforming. However, be-cause all our analyses are scaled to the signal strength, this step does not affect the results of the study at all. Signals werefiltered at 0–80 Hz prior to beamforming.
2.6. Exploratory analysis of perilesional abnormalities
As mentioned above, we are presenting a reanalysis of data from an experiment originally designed to assess adaptive right hemisphere activation in aphasia (Meltzer et al., 2013). The present study evaluates new methods for characterizing abnormal spontaneous activity in perilesional tissue in stroke patients. Although all statistical maps are corrected for multiple comparisons across voxels, we did not con-duct additional correction across the multiple signal quantities (e.g., relative delta power, theta power and multiscale entropy) assessed in this study. As such, the following analyses are exploratory in nature, and the methods identified as being the most sensitive and specific may be used in future confirmatory studies in which study de-sign and statistical power are optimized to test specific hypotheses about perilesional electrophysiological abnormalities, such as their rela-tionship to other indices of pathology (e.g., bloodflow, metabolism, white matter disconnection).
2.6.1. SAM maps—spontaneous activity during the intertrial interval We tested for changes in the frequency content of spontaneous MEG signals using spectral analysis. At each voxel, the power spectrum of the virtual signal for each data epoch was computed using Welch3s method in Matlab (Fast Fourier Transform of 500 ms Hamming windows with 50% overlap). Power spectra were averaged across epochs.
To evaluate quantitative parameters related to slowing of spontane-ous activity, we computed measures of relative power from the resulting power spectra. Relative power of the delta (1–4 Hz), theta (4–7 Hz), alpha (8–12 Hz) and beta (15–30 Hz) frequency bands were calculated as the ratio of the power of each specific frequency band di-vided by the total power across 0–80 Hz. Computing relative power over the frequency spectrum avoids potential confounds introduced by the normalized beamformer weights (Luckhoo et al., 2014) and ef-fectively bases the analysis on spectral shape rather than levels of abso-lute power.
Besides measures based on the power spectrum, we also calculated MSE from the time series signal at each voxel; a detailed explanation of MSE calculations can be found inCosta et al. (2002). MSE is an creasingly popular technique from a family of techniques that have in-cluded approximate entropy (ApEn), introduced byPincus (1991),
and the later refinement sample entropy (SampEn; Richman and
Moorman, 2000). Most entropy estimation methods are dependent on a choice of parameters, the most critical of which is the time scale on which successive samples are compared. MSE addresses the problem of time scale selection by successively averaging the signal across pro-gressively larger scales, and computing SampEn at each scale, denoted by a scaling parameter. The original sampled time series is generally
thefinest time scale, while increasingly coarser scales are obtained by averaging successive values. Sample entropy is the negative natural log-arithm of the conditional probability that two sequences of m consecu-tive data points, within a tolerance r, will remain similar following the addition of the next consecutive data point. The tolerance value r is a threshold for a binarized decision on whether two sequences are suffi -ciently similar to constitute a“match,”and is commonly scaled by the standard deviation of the time series. Put simply, lower values of SampEn indicate time series that have more self-similarity: the shape of succes-sive values centered around one time resembles that centered around other times. Both periodic and completely random signals (e.g., white noise) are low in sample entropy, while complex aperiodic signals (e.g., 1/f noise) are higher in sample entropy (Costa et al., 2005, 2002).
Sample entropy was calculated with the parameters m = 2 and r = 0.2 from scales 1–12, which corresponded to times scales of approxi-mately 1.5–20 ms. The entropy values averaged across the 12 time scales were used for the MSE maps. There are no clear guidelines for choosing parameter values, though r values typically range between 0.1 and 0.25 and m values are either 1 or 2 (seeLake et al., 2002for a dis-cussion of the optimal choices for m and r).
These methods produced whole-brain 3D-maps (including the in-farcted regions) of relative power in each frequency band, and MSE. The maps were then warped into Talairach space by applying the trans-formation computed on anatomical images (see above), and interpolat-ed to afinal resolution of 5 mm3. The maps for patients and controls were compared using voxel-wise independent sample t-tests imple-mented in AFNI. All of the maps were thresholded at pb0.005, with a minimum cluster size of 10 voxels to keep the family-wise error rate at pb0.05. This threshold was based on Monte Carlo simulations from the 3dClustSim tool in AFNI using an FWHM of 8, as calculated previous-ly with the same data (Meltzer et al., 2013).
2.6.2. SAM maps—task activation
The SAM technique can also be used to map task-related neural ac-tivity using a pseudo-T statistic, which is a normalized measure of the difference in oscillatory power in a given frequency range between two time windows (Vrba and Robinson, 2001). Previous results have demonstrated that task-induced neural activity generally results in de-creased oscillatory power in the 8–30 Hz range, both in simple sensory and complex cognitive paradigms (Brookes et al., 2005;Hillebrand et al., 2005;Singh et al., 2002). Thus, we created single subject, pseudo-T SAM maps which quantified the change in 8–30 Hz power between the sen-tence listening period and the baseline intertrial interval. The values from these pseudo-T maps were subjected to group level analysis to as-sess neural activity related to sentence processing between patients and controls, as well as ROI analyses in patients to assess the correlation be-tween perilesional spontaneous activities and task-induced activation of the homologous contralesional cortex.
2.6.3. ROI analyses
Voxel-wise statistical maps provide a good overview of differences between patients and controls, but are potentially affected by variability in the lesion extent across patients. To directly test the hypothesis that perilesional regions generate abnormal physiological activity, we ana-lyzed changes in relative band power and MSE within specific regions of interest in both hemispheres.
To quantitatively assess the degree of dysfunction detected by the spectral and nonlinear measures we selected two atlas-based regions that consistently tended to border the anterior and posterior portions of lesions in most of the patients. To do so, we visually inspected the map of lesion overlap (seeMeltzer et al., 2013, Fig. 4a), and compared it with an atlas of 90 macroanatomical regions (Eickhoff et al., 2005). From this inspection we identified the middle frontal gyrus as an ideal anterior ROI. Two regions from that atlas, labeled as“angular gyrus”
and“inferior parietal lobe,”were combined into a posterior ROI in each hemisphere. In each patient, the ROI was masked by the lesion
maps in order to exclude lesioned voxels. On average, 22.67% (SD = 25) of the posterior ROI and 19.15% (SD = 19.46) of the anterior ROI were excluded due to lesion overlap.
The atlas-based ROIs provide a means to assess signal characteristics in consistent locations across subjects, but they are not truly
“perilesional”in all subjects due to variability in lesion location and ex-tent. Therefore, we also constructed customized perilesional and contralesional ROIs for each aphasic patient. The voxels immediately sur-rounding the lesion mask (downsampled to a 1 cm resolution) were identified in each participant, and as a control, the same region was de-fined in the undamaged right hemisphere by reflecting the perilesional mask across the sagittal axis in Talairach space and warping it back to in-dividual space. Areas exhibiting FLAIR hyperintensity were not generally included in the perilesional ROIs, as they were included in the original le-sion tracings. Only voxels containing a majority of gray matter were in-cluded in the perilesional ROIs, as estimated by automated anatomical segmentation of high-resolution T1 scans, performed in FSL software. This procedure produced ROIs containing structurally intact cortical tis-sue in all patients, even those with mainly subcortical infarcts.
Relative power and MSE values were then averaged across all in-cluded voxels within these ROIs and univariate ANOVAs were conduct-ed to compare the averagconduct-ed values between groups. Post-hoc comparisons were conducted using Tukey3s HSD test.
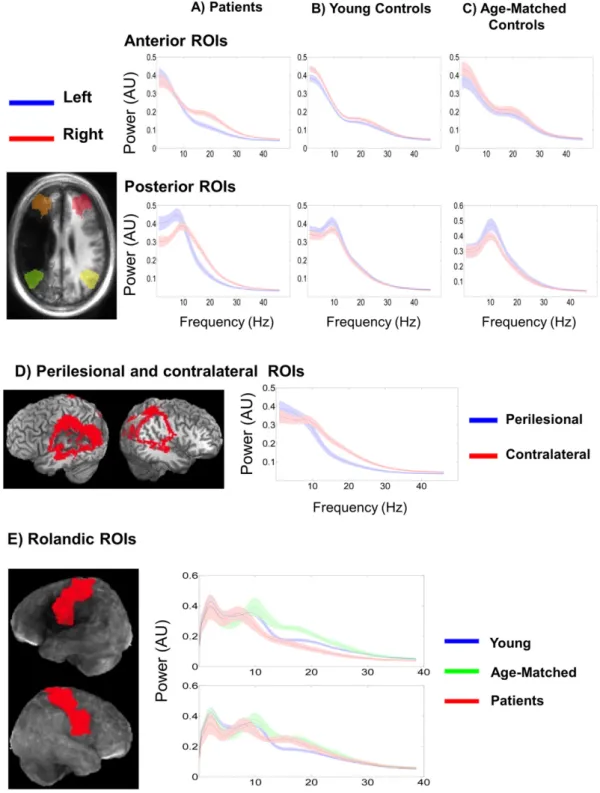
The SAM analysis revealed that relative to the young controls, both patients and age-matched controls exhibited increased right hemi-sphere rolandic beta power compared to younger controls (Fig. 1). To further investigate the signal characteristics in the rolandic region, we extracted averaged power spectra from bilateral rolandic ROIs which
consisted of the pre- and post-central gyri as defined by the
macroanatomical atlas. 2.6.4. Correlations with activity
To test whether perilesional abnormalities predict task-induced acti-vation of homologous regions in the right hemisphere, we calculated Pearson correlations of intertrial MSE and relative power at the left perilesional ROIs with subsequent task-related activation (8–30 Hz power decrease during sentence listening compared to the intertrial in-terval) at respective contralateral homologous ROIs.
2.6.5. Single subject maps
One objective of the current study is to present a methodology to identify dysfunctional tissue within each individual patient. Thus, we present two approaches for creating single subject maps.
In one approach, we adopted a methodology used inMuhlau et al. (2009)for voxel-based morphometry of individual patients. Briefly, un-equal two-sample t-tests were performed at each voxel comparing an individual patient3s score against the mean of each control group. To cal-culate the t-score at each voxel, the difference between each patient3s score and each control group3s mean was divided by a pooled variance estimate. This resulted in two t-maps for each patient: one vs. young controls and one vs. age-matched controls. These maps were overlaid on top of the individual structural MRI to identify the dysfunctional perilesional tissue on the individual subject level.
We also present an alternative approach for single subject mapping that does not require data from a control group. Specifically, z-score maps were created by comparing each voxel within an individual3s brain against the mean and standard deviation calculated from all voxels within the brain (including the lesioned area). This approach highlights areas in which brain electrical activity differs strongly from the rest of the brain, and in our experience, does not show patterns of significant alterations within the brains of healthy control subjects. 2.6.6. Correlations between measures
To better understand the general relationship between spectral band power and MSE, as measures of neural activity, we calculated
Pearson3s correlations between MSE and relative power at each fre-quency band and between MSE and the ratio of low (delta + theta) to high (beta) frequency power. In controls, the whole cortex was used as an ROI. We also tested whether the relationship between spectral power and MSE would change as a result of brain pathology, by comput-ing the correlations within the perilesional ROI.
3. Results
3.1.1. Voxel-wise maps—aphasia vs. controls
Fig. 1presents the comparison maps of relative power and MSE be-tween groups andTable 1summarizes these results for each hemi-sphere. Voxels with significant differences are colored and overlaid on an artificially darkened average anatomical image representing the le-sion distribution across patients; the darker regions correspond to areas with greater lesion overlap. The highest lesion overlap occurred in the left inferior frontal and superior temporal areas, consistent with typical infarct patterns resulting from left middle cerebral artery occlu-sion, the most common cause of aphasia (Phan et al., 2005).Fig. 1 pre-sents maps estimated from the baseline intertrial period and from the sentence listening and memory delay period of the task. Visual inspec-tion indicates that the estimates from the two periods revealed very similar patterns of results, with slightly more sensitivity associated with the estimates from the baseline period. As such, the following sec-tion will focus on thefindings from the baseline period, which repre-sents a better estimation of spontaneous neural activity.
3.1.2. Patients vs. young controls
In the left hemisphere, patients exhibited significantly increased delta and theta power and significantly reduced beta power and MSE posterior to the region of maximal lesion overlap. Patients also exhibit-ed rexhibit-educexhibit-ed beta power and MSE anterior to the region of maximal le-sion overlap.
In the right hemisphere, patients exhibited significantly reduced delta and theta power in the superior temporal, inferior parietal and rolandic regions. Patients also exhibited increased rolandic beta. 3.1.3. Patients vs. age-matched controls
In the left hemisphere, patients exhibited significantly increased delta and theta power and significantly reduced beta power and MSE posterior to the region of maximal lesion overlap. Patients also exhibit-ed rexhibit-educexhibit-ed beta power and MSE anterior to the region of maximal le-sion overlap.
There were no significant differences between patients and age-matched controls in the right hemisphere.
3.1.4. Age-matched vs. young controls
In general, both control groups exhibited similar relative power values across the whole brain. Differences were noted in the delta, theta, and beta bands. Specifically, age-matched controls exhibited de-creased left hemisphere delta power in the posterior temporal areas and significantly decreased right hemisphere theta power in the inferior parietal, rolandic and inferior frontal areas, relative to younger controls. Age-matched controls also exhibited bilaterally increased beta power in rolandic regions (precentral and postcentral gyri).
3.2. Task activation
Fig. 2a–c presents the group level activation maps for patients and controls; activation is reflected as the magnitude of a 8–30 Hz power re-duction (desynchronization). Young and age matched controls exhibit-ed primarily left lateralizexhibit-ed ventral activation. In the patients, left hemisphere activation is localized to the perilesional tissue anterior to
the lesion while right hemisphere activation in the patients was local-ized to the contralateral homologues of the lesioned and perilesional tis-sues. These maps are thresholded by activation magnitude (effect size), as the average pseudo-T value across subjects. An arbitrary effect size threshold of 0.5 is used here to avoid differences in the extent of statis-tically significant activation related to different numbers of subjects in the three groups. The activation magnitude maps are shown here to demonstrate the increased degree of right hemisphere activation in stroke patients, as the region of interest analysis (Section 3.3.5) exam-ined correlations between perilesional dysfunction and compensatory activation of the right hemisphere.
Fig. 2d–fpresents statistical maps comparing task-related 8–30 Hz desynchronization between groups. Compared to the young and age-matched controls, the patients exhibited a significant deficit in desynchronization (Fig. 2d–e; reflected by positive t-values) in the temporoparietal junction. Increased right hemisphere activity in pa-tients reached statistical significance relative to the young controls (Fig. 2d) but not compared to the age-matched controls (Fig. 2e). The presence of right-hemisphere activation was highly variable across patients. Therefore, we conducted subsequent ROI-based correlation analyses to assess possible associations between the degree of left-hemisphere perilesional dysfunction and right-left-hemisphere task activa-tion (Section 3.3.5). The age-matched controls exhibited increased left hemisphere rolandic desynchronization relative to young controls. 3.3. Region of interest analyses
3.3.1. Atlas-based anterior ROI
Fig. 3a–b presents the power spectra extracted from the four atlas-based ROIs. In the left hemisphere anterior ROI, there was a significant main effect of group for relative beta power, F(2,55) = 5.840, pb0.01. Post-hoc analyses using Tukey3s HSD test revealed that beta power was significantly lower in patients (M = 0.185, SEM = 0.011) when compared to the young (M = 0.218, SEM = 0.011) and age-matched controls (M = 0.253, SEM = 0.018). The main effects of relative delta, F(2,55) = 1.767, p = 0.181, theta, F(2,55) = 2.409, p = 0.099 and alpha, F(2,55) = 0.538, p = 0.587, were not significant.
There was also a main effect of MSE, F(2,55) = 6.240, pb0.01; MSE was significantly lower in patients (M = 1.784, SEM = 0.012) when compared to the young (M = 1.837, SEM = 0.013) and age-matched controls (M = 1.852, SEM = 0.021).
In the right hemisphere, there were no significant main effects of rel-ative delta, F(2,55) = 1.711, p = 0.190, relrel-ative theta, F(2,55) = 2.006, p = 0.144, relative alpha, F(2,55) = 0.171, p = 0.844, relative beta, F(2,55) = 1.643, p = 0.203, or MSE, F(2,55) = 0.730, p = 0.487.
3.3.2. Atlas-based posterior ROI
In the left hemisphere posterior ROI, there were significant main ef-fects of relative power in the delta, F(2,55) = 5.992, pb0.01, theta, F(2,55) = 12.331, pb0.001 and beta, F(2,55) = 10.106, pb0.001, frequency bands. Post-hoc analyses revealed that delta power was sig-nificantly higher in patients (M = 0.110, SEM = 0.001) when compared to the young (M = 0.090, SEM = 0.001) and age-matched controls (M = 0.073, SEM = 0.011). Theta band power was also significantly higher in patients (M = 0.115, SEM = 0.005) when compared to young (M = 0.090, SEM = 0.005) and age-matched controls (M = 0.076, SEM = 0.008). The patients also exhibited significantly reduced relative beta power (M = 0.160, SD = 0.010) when compared to the young (M = 0.210, SD = 0.010) and age-matched controls (M = 0.237, SD = 0.017). There were no significant group differences in rela-tive alpha power, F(2,55) = 0.544, p = 0.446.
There was also a significant main effect of MSE, F(2,55) = 9.636, pb0.001. Patients exhibited significantly decreased MSE (M = 1.755, SEM = 0.011) when compared to the young (M = 1.843, SEM = 0.011) and age-matched controls (M = 1.821, SEM = 0.017).
In the right hemisphere ROI, there was a marginally significant main effect of group for relative delta power, F(2,55) = 2.796, p = 0.069.
However, post-hoc analyses with Tukey3s HSD test revealed no
differences between the patients (M = 0.078, SEM = 0.005), and the young (M = 0.092, SD = 0.005) and age-matched controls (M = 0.076, SEM = 0.008). There were no main effects of group in the Fig. 1.Voxel-wise contrasts from baseline (upper) and sentence listening (lower) periods of the task. T-test maps of relative power and MSE overlaid on top of an artificially darkened render representing the lesion distribution across patients; darker regions correspond to areas with greater lesion overlap. The maps contrast patients minus young controls (A), patients minus age-matched controls (B), and age-matched controls minus young controls (C). Active voxels are color coded according to the magnitude of difference and thresholded at pb0.05, corrected.
Table 1
Summary of the results from the SAM analysis of spontaneous activity within each hemisphere.‘Increased’indicates the contrast yielded at least one significant cluster of positive voxels (pb0.05, corrected),‘decreased’indicates the opposite; Ns. = no significant clusters.
Patients minus young controls Patients minus age-matched controls Age-matched minus young controls
Left hemisphere Right hemisphere Left hemisphere Right hemisphere Left hemisphere Right hemisphere
Delta (1–4 Hz) Increased Decreased Increased Ns. Decreased Ns.
Theta (5–7 Hz) Increased Decreased Increased Ns. Ns. Decreased
Alpha (8–12 Hz) Ns. Ns. Ns. Ns. Ns. Ns.
Beta (15–30 Hz) Decreased Increased Decreased Ns. Increased Increased
theta, F(2,55) = 2.338, p = 0.106, alpha, F(2,55) = 0.310, p = 0.310 and beta, F(2,55) = 2.113, p = 0.131, frequency bands. The main effect of MSE was also not significant, F(2,55) = 0.100, p = 0.905.
3.3.3. Perilesional ROI
Fig. 3d presents the locations of a perilesional ROI and its contralesional mirror ROI in one sample subject, along with the power spectra averaged across subjects from the two ROIs. Note that the ROI does not appear perfectly symmetrical in both hemispheres due to the distortion of the left hemisphere structures by the lesion. Paired t-tests revealed that the perilesional ROI exhibited significantly in-creased delta, t(24) = 5.15, pb0.001, and theta power t(24) = 7.051, pb0.001 as well as significantly reduced beta power, t(24) = 11.475, pb0.001, compared to the contralesional ROI. The difference in relative alpha power was not significant, t(24) = 1.464, p = 0.156.
The left hemisphere perilesional ROI also exhibited significantly re-duced MSE, t(24) = 6.578, pb0.001, when compared to the contralat-eral mirror ROI.
3.3.4. Rolandic ROI
Fig. 3e presents the average power spectra from the bilateral rolandic ROIs for all groups. Across both hemispheres, differences be-tween spectra are most notable along the beta band. Specifically, right hemisphere beta power is increased for the patients and age-matched controls, while left hemisphere beta is increased only for the age-matched controls.
3.3.5. Correlations with homologue task activation
Fig. 4presents scatterplots of right hemisphere homologue task acti-vation as a function of intertrial MSE and relative power in left hemi-sphere perilesional areas. Perilesional relative delta power was positively associated with right hemisphere homologue task activation (r(23) = 0.516, pb0.01), while perilesional MSE was negatively associ-ated with right hemisphere homologue activation (r(23) =−0.540, pb0.01). There were no significant correlations between right hemi-sphere task activation and perilesional relative theta (r(23) = 0.321, pN0.118), relative alpha (r(23) =−0.164, p = 0.433), and relative beta (r(23) =−0.271, p = 0.191).
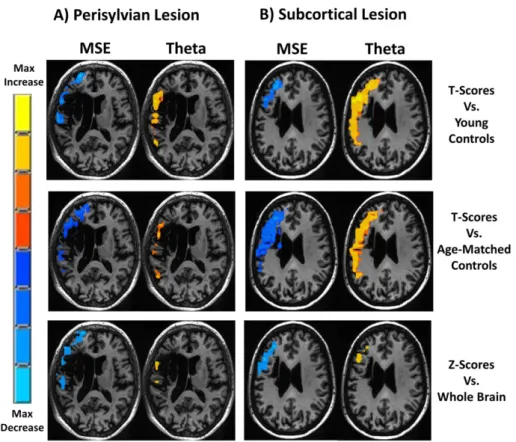
3.4. Single subject mapping
Thresholded single subject maps of relative theta power and MSE are shown inFig. 5for one patient with a perisylvian lesion and one pa-tient with a subcortical lesion. For both papa-tients, MSE was reduced and theta was increased. The magnitude and spatial extent of perilesional dysfunction as detected by the t-score and z-score methods were com-parable. To illustrate the sensitivity of the different measures for single subject mapping and to estimate the incidence of detectable abnormal-ities in perilesional tissue in individual patients, we calculated the pro-portion of voxels that exhibited significant t-scores vs. age-matched controls (pb0.05, uncorrected), within each individual3s perilesional ROI (Fig. 6).
Fig. 2.Task activation maps. Pseudo-T maps (left panel) presenting an 8–30 Hz event related desynchronization during the sentence listening period of the task for patients (A), young controls (B) and age-matched controls (C). These maps represent the average magnitude of activation across subjects (effect size), and are thresholded at an arbitrary level of 0.5, to avoid differences related to different numbers of subjects in the groups. T-test maps (right panel) contrast patients minus young controls (E), patients minus age-matched controls, and (F), age-matched minus young controls. Active voxels are color coded according to the magnitude of difference and thresholded at pb0.05, corrected.
3.5. Correlations between MSE and spectral band power
Table 2presents correlations of MSE and relative band power across the entire cortex for controls and in the perilesional areas of pa-tients. In the young controls there were significant negative correlations between MSE and relative delta, r(22) =−0.638, pb0.01, relative theta, r(22) =−0.702, pb0.01, and the (delta + theta)/beta ratio, r(22) =−0.828, pb0.01. MSE also positively correlated with relative beta power, r(22) = 0.815, pb0.01. MSE did not correlate with relative
alpha power, r(22) = 0.043, p = 0.849. As demonstrated inTable 1, the same pattern of correlations between MSE and spectral power was also present in the age-matched controls and in the perilesional tissue. 4. Discussion
This study illustrates a novel approach to the characterization of al-tered spontaneous electrical activity generated by perilesional areas fol-lowing stroke. Building on previous EEG and MEG studies, both spectral Fig. 3.Power spectra averaged across all voxels from the atlas-based (top), perilesional and contralateral (middle), and rolandic (bottom) ROIs. Spectra from homologous ROIs are plotted together: left hemisphere in blue and right hemisphere in red. Spectra are plotted separately for patients (A), young controls (B), and age-matched controls (C). Spectra from the perilesional and contralateral ROIs, averaged across all subjects, are plotted together (D): left hemisphere in blue and right hemisphere in red. The displayed lesion and perilesional ROIs are from the single sample subject. (E) Averaged spectra from the three groups are plotted together for the left (top) and right (bottom) rolandic ROIs. Shaded regions represent the standard error of the mean power estimate.
and nonlinear analyses of electrophysiological data revealed robust group differences between patients with stroke and healthy controls, and between the affected and unaffected hemispheres (e.g.,Finnigan et al., 2004;Finnigan and van Putten, 2013;Tecchio et al., 2006, 2005). Whereas previous studies of spontaneous electrical activity in stroke have largely focused on increased low frequency signals, the present
study presents a method for source analysis of low amplitude high frequency activity, and characterization of signals using nonlinear algo-rithms in source space.
The analysis of different signal measures in a common source space allowed us to evaluate differences in sensitivity between them. For ex-ample, SAM maps of reduced MSE and relative beta in patients vs.
Fig. 5.Single subject maps. Maps of baseline relative theta (right) and MSE (left) are presented for a patient with a left hemisphere perisylvian lesion (A) and a patient with an anterior subcortical lesion (B). T-score maps were computed by comparing the single subject3s value at each voxel vs. the mean and standard deviation of the young (upper) and age-matched (middle) control groups. Z-score maps (lower) were computed by comparing each voxel vs. the mean and standard deviation of all voxels in the individual3s brain. Active voxels are color coded according to the magnitude of difference and thresholded at pb0.05, uncorrected.
Fig. 4.The magnitude of contralateral homologous task activation (8–30 Hz ERD) plotted as a function of perilesional relative delta, theta, alpha, beta, and MSE (B). Pearson3s correlations are presented with eachfigure. *Significant at pb0.05.
controls revealed significant voxels in areas anterior and posterior to the areas of maximal lesion overlap, while maps of increased relative theta and delta revealed significant voxels only posterior to the lesion zone. This is further confirmed by ROI analyses demonstrating that MSE, delta, theta, and beta measures were sensitive to changes in the poste-rior ROI, while only MSE and beta power were sensitive to dysfunction in the anterior ROI. This particular distinction between the anterior and posterior regions most likely reflects the idiosyncratic nature of the present sample of patients, whose lesions were distributed in various areas centered on the left perisylvian cortex. However, these results suggest that reductions in MSE and beta power may be equally or even more sensitive than the more commonly used measures of low-frequency power increase.
Some limitations apply for this study, and suggest directions for fu-ture research. One limitation is that true“resting”MEG data were not available in these patients. Patients were originally recruited for an MEG study of language processing, and the timing of the procedures was optimized to maximize sensitivity for that study. In the present re-analysis of that MEG data, we examined“spontaneous”data from the intertrial interval of the language task. Similar results were obtained from data in the task periods. Thus, there is some concern that the brief intertrial intervals included task-related neural activity‘spilled over’from the previous trial. However, given that neural activity results in a decrease in 8–30 Hz power (Brookes et al., 2005;Hillebrand et al., 2005; Singh et al., 2002), such spillover would result in reduced 8–30 Hz power for active tissue relative to inactive tissue. Our results demonstrated the opposite: perilesional tissue exhibited reduced beta-band power (15–30 Hz) relative to healthy tissue from both con-trol groups.
Nonetheless, true resting data would be desirable. Based on the pres-entfindings, we now consider it worthwhile to routinely collect at least 5 min of resting data from stroke patients participating in MEG studies. Studies underway in our laboratory are also assessing correlations be-tween perilesional MEG abnormalities and MRI-based measures such as white matter integrity (assessed with FLAIR and diffusion tensor im-aging) and bloodflow (assessed with arterial spin labeling). These
studies have the potential to reveal the underlying mechanisms that may contribute to tissue dysfunction, such as white matter disconnec-tion and hypoperfusion.
Another limitation of the present study is the difficulty in conducting group statistical analysis in a heterogeneous sample of patients. The pa-tients did have some commonalities: all had a single left-hemisphere stroke impinging on perisylvian language regions, leading to aphasia but there was also considerable variability in aphasia symptoms, and lesion location and extent. We dealt with this heterogeneity by conducting several complementary analyses, based on whole-brain mapping, consistent atlas-based ROIs, and customized perilesional ROIs. Each had drawbacks: the whole-brain mapping ignores the lesion location, the atlas-based ROIs are perilesional in some subjects but not others, and the customized perilesional ROIs have widely variable size and location across participants. Fortunately all analyses converged on the same conclusions: perilesional tissue consistently exhibited reduced high frequency activity and MSE, and in some regions also showed in-creased low frequency activity. In fact, we anticipate that the methods presented in this paper will ultimately be more useful for analysis of individual patients in a clinical/therapeutic context (seeSection 4.3), obviating the problems associated with group analysis.
Together, thefindings support the utility of both spectral and nonlin-ear time series measures in source space to identify neural dysfunction in the perilesional tissue, and suggest that identification of increased delta-range activity alone may provide an incomplete characterization of altered spontaneous neural dynamics after stroke.
4.1. Relationship between spectral and nonlinear measures
While there were differences between maps based on spectral mea-sures and multi-scale entropy, they were overall quite similar, raising the question of whether these techniques provide complementary in-formation, or instead represent two ways of quantifying essentially the same phenomenon. Besides the visual comparison of statistical maps generated from both techniques, we also assessed direct correla-tions between MSE and spectral power across subjects in patients and controls, testing whether there was a close association between these measures in normal, healthy tissue. In all groups, MSE was positively correlated with beta power, but negatively with delta and theta power, and not significantly correlated with alpha power. Thus, MSE seems to closely covary with the ratio of higher frequencies to lower fre-quencies in an electrophysiological signal, at least at the time scales that we assessed. This intuition was confirmed by directly assessing the cor-relation between MSE and the (delta + theta)/beta power ratio, which was stronger than the correlation with any individual frequency band. A similar conclusion was reached byBruce et al. (2009)who compared SampEn and spectral measures in EEG obtained from adults during wakefulness and sleep, and also obtained similar results from simulated EEG signals.
One difference noted between the spectral measures and MSE relat-ed to the effects of aging deserves some special scrutiny. We did not ob-serve any differences in MSE between the younger controls and the age-matched controls (Fig. 1c). However, age-matched controls exhibited bilateral increased relative beta power, and decreased delta/theta power, which seemed to be a general effect of aging rather than an indi-cation of disease-related pathology. This general speeding of the signal is also present in the unaffected right hemisphere of the patients, when compared to the young controls. Furthermore the power spectra from the right rolandic ROI (Fig. 3e) clearly shows increased beta power for both patients and age-matched controls.
Thisfinding is in line with previous reports of age-related speeding of electrical activity.Bruce et al. (2009)found decreased relative delta and increased relative beta associated with aging during wakefulness and sleep.Feinberg and Campbell (2003)also found reduced delta asso-ciated with aging during sleep, whileMann and Roschke (2004)found a significant negative correlation between age and delta/theta power Fig. 6.Bar graph illustrating the proportion of participants with significant perilesional
changes in relative power and MSE compared to the age-matched controls (significant single subject t-scores; pb0.05, uncorrected). The colored bars represent different propor-tions of the perilesional ROI with significant voxels.
Table 2
Correlations of MSE and relative power. Correlations were computed across subjects, be-tween MSE and relative delta, theta, alpha & beta averaged across the whole cortex for controls and across perilesional tissue for patients.
Young controls Age-matched controls Patients
Delta −0.638** −0.785* −0.856** Theta −0.702** − 0.757* − 0.855** Alpha 0.043 −0.285 0.222 Beta 0.815** 0.844** 0.810** Delta–theta/beta ratio −0.828** −
0.851** − 0.938** * pb0.05. ** pb0.01.
measured during sleep. This speeding of the frequency spectrum may seem contrary to behavioral and electrophysiological studies demon-strating age-related increases in the latency of response time and ERPs (Rossini et al., 2007). However,Hong and Rebec (2012)proposed that the speeding of the frequency spectrum may actually reflect compensa-tory speeding offiring rates. Specifically, the authors suggest that aging associated increases in conduction delays will progressively increase the phase difference between synchronized neurons until they are in antiphase. To compensate, one neuron must double thefiring rate to re-align their excitability peaks. This compensatory speeding will be reflected as a shift of the frequency spectrum from low to high frequen-cies. It should be noted that the authors hypothesized aging related in-creases in gamma power while we observed increased beta. This is likely due to the fact that the speeding was observed in the rolandic regions where idle beta activity is dominant (Ritter et al., 2009). Our findings are consistent with a previous report of increased relative and absolute beta power in older adults compared to younger adults (Holschneider and Leuchter, 1995).
Notably, the MSE measures were not significantly affected by this in-crease in relative beta power present in older participants. Therefore, it is possible that MSE could provide a more specific indicator of perilesional dysfunction in stroke, dissociable from the effects of aging. Future studies including larger groups of participants at various age levels are needed to fully dissociate the role of aging in altered neural dynamics commonly seen in patients with neurological disorders. 4.2. Compensatory right hemisphere activation
The activation maps presented here converge with a multitude of studies demonstrating right hemisphere language activation in chronic aphasia (Musso et al., 1999;Thulborn et al., 1999;Tillema et al., 2008). Specifically, we found a bilateral pattern of activation in aphasic patients during language processing, while the younger and older controls ex-hibited strong left-lateralization. Despite the bilateral pattern seen in the patients, increased right-hemisphere activation in the patients as a group was not statistically significant compared to the age-matched controls (Fig. 2e). This may be due to the low power resulting from a smaller group of older controls, but is also related to the high degree of variability across the patient group in lesion characteristics and right-hemisphere activation. In our previous study with this cohort, we characterized the relationship between language comprehension performance and differential activation to sentences of varying diffi cul-ty levels,finding a correlation between right hemisphere activation and successful comprehension (Meltzer et al., 2013). However, in that study, positive correlations with performance were not generally in homolo-gous regions to those associated with comprehension performance based on lesion analysis; this suggests that compensatory activity may reflect adaptive recruitment of alternative strategies rather than homol-ogous takeover of the same cognitive functions.
In the present study, we examined a simpler contrast of sentence lis-tening vs. the prestimulus baseline, to test whether there was any asso-ciation between the degree of right hemisphere activation present in each patient and the degree of perilesional dysfunction detected during the intertrial period. We didfind such an association: perilesional dys-function (increased slowing and reduced entropy) was correlated with task activation in the right hemisphere homologue of the perilesional tissue. Thus, the current results provide evidence for ho-mologous takeover during basic sentence processing, which is modulat-ed by the magnitude of the left hemisphere dysfunction. Some authors have suggested that the activation of right hemisphere homologues of the language areas may reflect a release of transcallosal inhibition from the damaged left hemisphere (Martin et al., 2004;Thiel et al., 2006b). The currentfindings are consistent with this hypothesis, but do not test this hypothesis directly. We are currently exploring effective connectivity analyses to directly test the hypothesis of transcallosal in-hibition in stroke.
4.3. Identifying targets for non-invasive stimulation-based intervention The role of right hemisphere activation in residual language process-ing is still debated though evidence suggests that the best outcome is as-sociated with a reintegration of the surviving perilesional regions into the language network (Saur et al., 2006). Therapeutic studies of nonin-vasive brain stimulation typically aim to increase the activation of struc-turally intact perilesional cortex, either by direct excitatory stimulation of that tissue (Marangolo et al., 2013;Szaflarski et al., 2011), or by inhib-itory stimulation to the contralateral hemisphere (Abo et al., 2012; Barwood et al., 2011, 2013;Kakuda et al., 2011;Kindler et al., 2012; Naeser et al., 2005b;Medina et al., 2012;Naeser et al., 2010;Thiel et al., 2013, 2006a;Waldowski et al., 2012;Weiduschat et al., 2011; Winhuisen et al., 2007). However, there is also evidence of beneficial outcomes associated with excitatory right hemisphere stimulation (Flöel et al., 2011). It is likely that a multitude of factors contribute to the overall relationship between stimulation site and behavioral out-come, including lesion size, location, pre-stroke laterality and structural and functional integrity of the perilesional tissue.
The methods demonstrated here provide a means to identify dys-functional perilesional tissue potentially suitable for physiological interventions such as transcranial magnetic stimulation (TMS) and transcranial direct current stimulation (tDCS). The fact that stimulation of the perilesional cortex can improve behavioral outcomes suggests that the dysfunctional perilesional tissue has the capacity for successful reintegration into the language network. Critically, such regions may be ideal targets for intervention as numerous studies have demonstrated that the best clinical outcome in aphasia is associated with reactivation of the perilesional tissue. The single subject mapping approaches pre-sented here provide a means to identify tissue within an individual pa-tient that is most likely to benefit from non-invasive stimulation, and could also allow researchers to assess both short-term and long-term changes in cortical activity induced by the stimulation. It should be noted that the single subject maps from some patients did not show perilesional dysfunction. As such, it stands to reason that these patients may not benefit from direct perilesional stimulation. The clinical utility of the single subject maps lies in its ability to identify ideal candidate pa-tients and brain regions for stimulation-based rehabilitation. Thus, map-ping of perilesional dysfunction is likely to play an important role in the future development of physiologically informed neurorehabilitation programs in stroke.
Acknowledgments
We thank the participating patients and their families. Data collec-tion was funded by the Intramural Research Program of the Nacollec-tional In-stitute on Deafness and Other Communication Disorders. Later analyses were supported by grants from the Heart and Stroke Foundation Cana-dian Partnership for Stroke Recovery and the Alzheimer's Association. References
Abo, M., Kakuda, W., Watanabe, M., Morooka, A., Kawakami, K., Senoo, A., 2012. Effective-ness of low-frequency rTMS and intensive speech therapy in poststroke patients with aphasia: a pilot study based on evaluation by fMRI in relation to type of aphasia. Eur. Neurol. 68 (4), 199–208.http://dx.doi.org/10.1159/00033877322948550. Barwood, C.H., Murdoch, B.E., Riek, S., O’Sullivan, J.D., Wong, A., Lloyd, D., Coulthard, A.,
2013. Long term language recovery subsequent to low frequency rTMS in chronic non-fluent aphasia. NeuroRehabilitation 32 (4), 915–928.http://dx.doi.org/10.3233/ NRE-13091523867417.
Barwood, C.H., Murdoch, B.E., Whelan, B.M., Lloyd, D., Riek, S., O’Sullivan, J.D., Coulthard, A., Wong, A., 2011. Improved language performance subsequent to low-frequency rTMS in patients with chronic non-fluent aphasia post-stroke. Eur. J. Neurol. 18 (7), 935–943.http://dx.doi.org/10.1111/j.1468-1331.2010.03284.x21138505.
Bosl, W., Tierney, A., Tager-Flusberg, H., Nelson, C., 2011. EEG complexity as a biomarker for autism spectrum disorder risk. B.M.C. Med. 9, 18. http://dx.doi.org/10.1186/1741-7015-9-1821342500.
Brookes, M.J., Gibson, A.M., Hall, S.D., Furlong, P.L., Barnes, G.R., Hillebrand, A., Singh, K.D., Holliday, I.E., Francis, S.T., Morris, P.G., 2005. GLM-beamformer method demonstrates stationaryfield, alpha ERD and gamma ERS co-localisation with fMRI BOLD response
in visual cortex. Neuroimage 26 (1), 302–308. http://dx.doi.org/10.1016/j. neuroimage.2005.01.05015862231.
Bruce, E.N., Bruce, M.C., Vennelaganti, S., 2009. Sample entropy tracks changes in electro-encephalogram power spectrum with sleep state and aging. J. Clin. Neurophysiol. 26 (4), 257–266.http://dx.doi.org/10.1097/WNP.0b013e3181b2f1e319590434. Butz, M., Gross, J., Timmermann, L., Moll, M., Freund, H.-J., Witte, O.W., Schnitzler, A.,
2004. Perilesional pathological oscillatory activity in the magnetoencephalogram of patients with cortical brain lesions. Neurosci. Lett. 355 (1–2), 93–96.http://dx.doi. org/10.1016/j.neulet.2003.10.06514729243.
Catarino, A., Churches, O., Baron-Cohen, S., Andrade, A., Ring, H., 2011. Atypical EEG com-plexity in autism spectrum conditions: a multiscale entropy analysis. Clin. Neurophysiol. 122 (12), 2375–2383.http://dx.doi.org/10.1016/j.clinph.2011.05. 00421641861.
Cornelissen, K., Laine, M., Tarkiainen, A., Järvensivu, T., Martin, N., Salmelin, R., 2003. Adult brain plasticity elicited by anomia treatment. J. Cogn. Neurosci. 15 (3), 444–461. http://dx.doi.org/10.1162/08989290332159315312729495.
Costa, M., Goldberger, A.L., Peng, C.K., 2002. Multiscale entropy analysis of complex phys-iologic time series. Phys. Rev. Lett. 89 (6), 068102.http://dx.doi.org/10.1103/ PhysRevLett.89.06810212190613.
Costa, M., Goldberger, A.L., Peng, C.K., 2005. Multiscale entropy analysis of biological sig-nals. Phys Rev E Stat Nonlin Soft Matter Phys 71 (2 1), 02190615783351. Crinion, J., Price, C.J., 2005. Right anterior superior temporal activation predicts auditory
sentence comprehension following aphasic stroke. Brain 128 (12), 2858–2871. http://dx.doi.org/10.1093/brain/awh65916234297.
Cuspineda, E.R., Machado, C., Virues, T., Martínez-Montes, E., Ojeda, A., Valdés, P.A., Bosch, J., Valdes, L., 2009. Source analysis of alpha rhythm reactivity using LORETA imaging with 64-channel EEG and individual MRI. Clin. E.E.G. Neurosci. 40 (3), 150–156. http://dx.doi.org/10.1177/15500594090400030619715176.
Eickhoff, S.B., Stephan, K.E., Mohlberg, H., Grefkes, C., Fink, G.R., Amunts, K., Zilles, K., 2005. A new SPM toolbox for combining probabilistic cytoarchitectonic maps and functional imaging data. Neuroimage 25 (4), 1325–1335.http://dx.doi.org/10.1016/ j.neuroimage.2004.12.03415850749.
Feinberg, I., Campbell, I.G., 2003. Kinetics of non-rapid eye movement delta production across sleep and waking in young and elderly normal subjects: theoretical implica-tions. Sleep 26 (2), 192–20012683479.
Finnigan, S., van Putten, M.J., 2013. EEG in ischaemic stroke: quantitative EEG can unique-ly inform (sub-)acute prognoses and clinical management. Clin. Neurophysiol. 124 (1), 10–19.http://dx.doi.org/10.1016/j.clinph.2012.07.00322858178.
Finnigan, S.P., Rose, S.E., Walsh, M., Griffin, M., Janke, A.L., McMahon, K.L., Gillies, R., Strudwick, M.W., Pettigrew, C.M., Semple, J., Brown, J., Brown, P., Chalk, J.B., 2004. Correlation of quantitative EEG in acute ischemic stroke with 30-day NIHSS score: comparison with diffusion and perfusion MRI. Stroke 35 (4), 899–903.http://dx. doi.org/10.1161/01.STR.0000122622.73916.d215001786.
Flöel, A., Meinzer, M., Kirstein, R., Nijhof, S., Deppe, M., Knecht, S., Breitenstein, C., 2011. Short-term anomia training and electrical brain stimulation. Stroke 42 (7), 2065–2067.http://dx.doi.org/10.1161/STROKEAHA.110.60903221636820. Harmony, T., Fernández-Bouzas, A., Marosi, E., Fernández, T., Valdés, P., Bosch, J., Riera, J.,
Bernal, J., Rodríguez, M., Reyes, A., 1995. Frequency source analysis in patients with brain lesions. Brain Topogr. 8 (2), 109–117.http://dx.doi.org/10.1007/ BF011997748793121.
Heiss, W.-D., Thiel, A., 2006. A proposed regional hierarchy in recovery of post-stroke aphasia. Brain Lang. 98 (1), 118–123.http://dx.doi.org/10.1016/j.bandl.2006.02. 00216564566.
Hillebrand, A., Singh, K.D., Holliday, I.E., Furlong, P.L., Barnes, G.R., 2005. A new approach to neuroimaging with magnetoencephalography. Hum. Brain Mapp. 25 (2), 199–211. http://dx.doi.org/10.1002/hbm.2010215846771.
Hofmeijer, J., van Putten, M.J., 2012. Ischemic cerebral damage: an appraisal of synaptic failure. Stroke 43 (2), 607–615. http://dx.doi.org/10.1161/STROKEAHA.111. 63294322207505.
Holschneider, D.P., Leuchter, A.F., 1995.Beta activity in aging and dementia. Brain Topogr. 8 (2), 169–180.
Hong, S.L., Rebec, G.V., 2012. A new perspective on behavioral inconsistency and neural noise in aging: compensatory speeding of neural communication. Front. Aging Neurosci. 4, 27.http://dx.doi.org/10.3389/fnagi.2012.0002723055970.
Hornero, R., Escudero, J., Fernández, A., Poza, J., Gómez, C., 2008. Spectral and nonlinear analyses of MEG background activity in patients with Alzheimer3s disease. I. E.E.E. Trans. Biomed. Eng. 55 (6), 1658–1665.http://dx.doi.org/10.1109/TBME.2008. 91987218714829.
Kakuda, W., Abo, M., Momosaki, R., Morooka, A., 2011. Therapeutic application of 6-Hz-primed low-frequency rTMS combined with intensive speech therapy for post-stroke aphasia. Brain Inj 25 (12), 1242–1248.http://dx.doi.org/10.3109/02699052. 2011.60821221902549.
Kang, E.K., Kim, Y.K., Sohn, H.M., Cohen, L.G., Paik, N.J., 2011. Improved picture naming in aphasia patients treated with cathodal tDCS to inhibit the right Broca3s homologue area. Restor. Neurol. Neurosci. 29 (3), 141–152. http://dx.doi.org/10.3233/RNN-2011-058721586821.
Kindler, J., Schumacher, R., Cazzoli, D., Gutbrod, K., Koenig, M., Nyffeler, T., Dierks, T., Müri, R.M., 2012. Theta burst stimulation over the right Broca3s homologue induces im-provement of naming in aphasic patients. Stroke 43 (8), 2175–2179.http://dx.doi. org/10.1161/STROKEAHA.111.647503.
Lake, D.E., Richman, J.S., Griffin, M.P., Moorman, J.R., 2002. Sample entropy analysis of neonatal heart rate variability. Am. J. Physiol. Heart Circ. Physiol. 283 (3), R789–R797.http://dx.doi.org/10.1152/ajpregu.00069.2002.
Luckhoo, H.T., Brookes, M.J., Woolrich, M.W., 2014. Multi-session statistics on beamformed MEG data. Neuroimage 95, 330–335.http://dx.doi.org/10.1016/j. neuroimage.2013.12.02624412400.
Machado, C., Cuspineda, E., Valdés, P., Virues, T., Llopis, F., Bosch, J., Aubert, E., Hernández, E., Pando, A., Alvarez, M.A., Barroso, E., Galán, L., Avila, Y., 2004. Assessing acute mid-dle cerebral artery ischemic stroke by quantitative electric tomography. Clin. E.E.G. Neurosci. 35 (3), 116–12415259617.
Mann, K., Röschke, J., 2004. Influence of age on the interrelation between EEG frequency bands during NREM and REM sleep. Int. J. Neurosci. 114 (4), 559–571.http://dx.doi. org/10.1080/0020745049042270415195358.
Marangolo, P., Fiori, V., Calpagnano, M.A., Campana, S., Razzano, C., Caltagirone, C., Marini, A., 2013. tDCS over the left inferior frontal cortex improves speech production in aphasia. Front. Hum. Neurosci. 7, 539.http://dx.doi.org/10.3389/fnhum.2013. 0053924046740.
Martin, P.I., Naeser, M.A., Theoret, H., Tormos, J.M., Nicholas, M., Kurland, J., Fregni, F., Seekins, H., Doron, K., Pascual-Leone, A., 2004. Transcranial magnetic stimulation as a complementary treatment for aphasia. Semin. Speech Lang. 25 (2), 181–191. http://dx.doi.org/10.1055/s-2004-82565415118944.
McCubbin, J., Vrba, J., Spear, P., McKenzie, D., Willis, R., Loewen, R., Robinson, S.E., Fife, A.A., 2004. Advanced electronics for the CTF MEG system. Neurol. Clin. Neurophysiol. 2004, 6916012695.
Medina, J., Norise, C., Faseyitan, O., Coslett, H.B., Turkeltaub, P.E., Hamilton, R.H., 2012. Finding the right words: transcranial magnetic stimulation improves discourse productivity in non-fluent aphasia after stroke. Aphasiology 26 (9), 1153–1168. http://dx.doi.org/10.1080/02687038.2012.71031623280015.
Meinzer, M., Beeson, P.M., Cappa, S., Crinion, J., Kiran, S., Saur, D., Parrish, T., Crosson, B., Thompson, C.K., Neuroimaging in Aphasia Treatment Research Workshop, 2013. Neuroimaging in aphasia treatment research: consensus and practical guidelines for data analysis. Neuroimage 73, 215–224.http://dx.doi.org/10.1016/j.neuroimage. 2012.02.05822387474.
Meinzer, M., Elbert, T., Wienbruch, C., Djundja, D., Barthel, G., Rockstroh, B., 2004. Inten-sive language training enhances brain plasticity in chronic aphasia. B.M.C. Biol. 2, 20. http://dx.doi.org/10.1186/1741-7007-2-2015331014.
Meinzer, M., Flaisch, T., Breitenstein, C., Wienbruch, C., Elbert, T., Rockstroh, B., 2008. Functional re-recruitment of dysfunctional brain areas predicts language recovery in chronic aphasia. Neuroimage 39 (4), 2038–2046.http://dx.doi.org/10.1016/j. neuroimage.2007.10.00818096407.
Meltzer, J.A., Braun, A.R., 2011. An EEG–MEG dissociation between online syntactic com-prehension and post hoc reanalysis. Front. Hum. Neurosci. 5, 10.http://dx.doi.org/10. 3389/fnhum.2011.0001021331355.
Meltzer, J.A., Wagage, S., Ryder, J., Solomon, B., Braun, A.R., 2013. Adaptive significance of right hemisphere activation in aphasic language comprehension. Neuropsychologia 51 (7), 1248–1259.http://dx.doi.org/10.1016/j.neuropsychologia.2013.03.00723566891. Mühlau, M., Wohlschläger, A.M., Gaser, C., Valet, M., Weindl, A., Nunnemann, S.,
Peinemann, A., Etgen, T., Ilg, R., 2009. Voxel-based morphometry in individual pa-tients: a pilot study in early Huntington disease. A.J.N.R. Am. J. Neuroradiol. 30 (3), 539–543.http://dx.doi.org/10.3174/ajnr.A139019074546.
Musso, M., Weiller, C., Kiebel, S., Müller, S.P., Bülau, P., Rijntjes, M., 1999. Training-induced brain plasticity in aphasia. Brain 122 (9), 1781–1790.http://dx.doi.org/10.1093/ brain/122.9.178110468516.
Naeser, M.A., Martin, P.I., Nicholas, M., Baker, E.H., Seekins, H., Helm-Estabrooks, N., Cayer-Meade, C., Kobayashi, M., Theoret, H., Fregni, F., Tormos, J.M., Kurland, J., Doron, K.W., Pascual-Leone, A., 2005a. Improved naming after TMS treatments in a chronic, global aphasia patient—case report. Neurocase 11 (3), 182–193.http://dx.doi.org/10.1080/ 1355479059094466316006338.
Naeser, M.A., Martin, P.I., Nicholas, M., Baker, E.H., Seekins, H., Kobayashi, M., Theoret, H., Fregni, F., Maria-Tormos, J., Kurland, J., Doron, K.W., Pascual-Leone, A., 2005b. Im-proved picture naming in chronic aphasia after TMS to part of right Broca3s area: an open-protocol study. Brain Lang. 93 (1), 95–105.http://dx.doi.org/10.1016/j. bandl.2004.08.00415766771.
Naeser, M.A., Martin, P.I., Treglia, E., Ho, M., Kaplan, E., Bashir, S., Hamilton, R., Coslett, H.B., Pascual-Leone, A., 2010. Research with rTMS in the treatment of aphasia. Restor. Neurol. Neurosci. 28 (4), 511–529. http://dx.doi.org/10.3233/RNN-2010-055920714075.
Park, J., Kim, S., Kim, C., Cichocki, A., Kim, K., 2007. Multiscale entropy analysis of EEG from patients under different pathological conditions. Fractals 15 (04), 399–404. http://dx.doi.org/10.1142/S0218348X07003691.
Phan, T.G., Donnan, G.A., Wright, P.M., Reutens, D.C., 2005. A digital map of middle cere-bral artery infarcts associated with middle cerecere-bral artery trunk and branch occlu-sion. Stroke 36 (5), 986–991.http://dx.doi.org/10.1161/01.STR.0000163087.66828. e915817891.
Pincus, S.M., 1991.Approximate entropy as a measure of system complexity. Proc. Natl. Acad. Sci. U. S. A. 88 (6), 2297–2301.
Raja Beharelle, A., Kovačević, N., McIntosh, A.R., Levine, B., 2012. Brain signal variability relates to stability of behavior after recovery from diffuse brain injury. Neuroimage 60 (2), 1528–1537.http://dx.doi.org/10.1016/j.neuroimage.2012.01.03722261371. Richman, J.S., Moorman, J.R., 2000.Physiological time-series analysis using approximate
entropy and sample entropy. Am. J. Physiol. Heart Circ. Physiol. 278 (6), H2039–H2049.
Ritter, P., Moosmann, M., Villringer, A., 2009. Rolandic alpha and beta EEG rhythms3 strengths are inversely related to fMRI-BOLD signal in primary somatosensory and motor cortex. Hum. Brain Mapp. 30 (4), 1168–1187.http://dx.doi.org/10.1002/hbm. 2058518465747.
Rossini, P.M., Rossi, S., Babiloni, C., Polich, J., 2007. Clinical neurophysiology of aging brain: from normal aging to neurodegeneration. Prog. Neurobiol. 83 (6), 375–400.http://dx. doi.org/10.1016/j.pneurobio.2007.07.01017870229.
Saur, D., Lange, R., Baumgaertner, A., Schraknepper, V., Willmes, K., Rijntjes, M., Weiller, C., 2006. Dynamics of language reorganization after stroke. Brain 129 (6), 1371–1384. http://dx.doi.org/10.1093/brain/awl09016638796.