A Comparison of Some Test Statistics for Multivariate Analysis of
Variance Model With Non-Normal Responses
Babatunde Lateef Adeleke1 Waheed Babatunde Yahya11 Abubakar Usman2 1.Department of Statistics, Faculty of Physical Sciences, University of Ilorin, Ilorin, Nigeria 2.Department of Mathematics and Statistics, Federal University of Technology, Minna, Nigeria E-mail: [email protected]; [email protected]; [email protected]
ABSTRACT
The Multivariate analysis of variance (MANOVA) is often used to model responses from more than one response variable on a single factor or a set of factors of interest. The existing statistical methods for MANOVA modelling generally assume that the set of responses, and by extension the model error term have a Gaussian distribution. However, in many real life situations, the vector of responses are not normally distributed, thereby rendering some of the existing methods inefficient, especially under small sample size situations. This study therefore, investigates, through Monte-Carlo studies, the behaviours of three of the existing techniques for performing MANOVA tests when normality assumption on the error term is violated. Two truncated test statistics for MANOVA testing on data with non-normal responses were developed from the existing test methods. The Monte-Carlo results showed that the original Roy’s test method and the two proposed truncated
test statistics are relatively more efficient for MANOVA testing on data with inherent non-Gaussian responses under small sample sizes situations.
Keywords: MANOVA Tests, Non-normal error term, Wilks, Pillai, Roy’s statistics, Power
1. Introduction
The multivariate analysis of variance (MANOVA) technique is similar to univariate analysis of variance (ANOVA) but the main distinguishing feature is that we have multiple dependent variables for MANOVA while a single variable is want we have for univariate (Rencher, 1995; Stevens, 2002). This is used in situations where there are two or more dependent variables. Multivariate analysis of variance may also be thought of having the data layout as vector while the data layout of ANOVA is of the scalar form. Multivariate analysis consists of a collection of methods that can be use when several measurements are made on each individual or objects in one or more samples. The measurements are made on the basis of the response variable(s).
In this technique the vectors of observations are assumed to follow the multivariate normal populations having common covariance matrices (Everitt and Dunn, 2001; Brue et al., 2004). As a consequence of the foregoing, the response variables are expected to be uncorrelated or moderately correlated (between 0.4 to 0.7) if any relationship among them ever exist (Carey, 1998). If this were not so, there would be little use of many of the techniques of multivariate analysis. If they are highly correlated, one runs the risk of having a variable whose effect has already being explained by another variable(s) in the model, a scenario that is simply referred to as multicollinearity (Yahya et al., 2008; Yahya and Olaifa, 2014).
Data sets collected by most researchers in many diverse areas of specializations are multivariate in nature. In few cases, it may be sensible to isolate each variable and study it separately, but in most instances all the variables need to be examined simultaneously in order to fully grasp the structure and key features of the data.
The data with which we are primarily concerned consist of a series of measurements or observations made on a number of subjects, patients, objects or other entities of interest. The test statistics for MANOVA gives a measure of the overall likelihood of picking two or more random vectors of means (Chatfield and Collins, 1995). It is a technique for assessing group differences across multiple dependent variables simultaneously, based on a set of variables acting as independent variables.
MANOVA is statistical techniques that explore the relationship between several independent variables (usually referred to as treatments) and two or more dependent variables (Joseph, 2010; Tabachnick and Fidel, 2012). As such, it represents an extension of univariate analysis of variance. Multivariate analysis of covariance used in conjunction with MANOVA to remove (after the experiment) the effect of any uncontrolled independent variables (known as covariates) on the dependent variables. These uncontrolled independent variables are referred to as covariates. Researchers in the Biological, Physical and Social sciences are those that are frequently involved in taking measurements on several variables (Richard and Michael, 1987).
The need to understand the relationship between many response variables makes multivariate analysis inherently difficult, in that the human mind may undoubtedly be overwhelmed by the sheer bulk of the data. In particular, some concepts of the matrix algebra are required in the various multivariate statistical techniques than
1
in univariate settings.
In multivariate case, where we want to examine a group of variables simultaneously, it is necessary to extend the invariance principle to transformations, which include not only any rescaling but also any re-expression in terms of weighted sums of the raw variables. Unfortunately, in multivariate case there is no one uniformly most powerful test, which is invariant to all these transformations. This lack of a uniformly most powerful test is one of the reasons why several different test statistics have being proposed.
When the vector of response variables are distributed Gaussian with specified mean vector and variance-covariance matrix , suitable test statistics (Wilks, 1932; Hotelling, 1951; Pillai, 1955; and Roy, 1957) had been developed for testing the hypothesis of equality of the elements in the mean vector . However, in many classical real life cases, the vector of the observed responses and by extension the model’s error term often
failed to have the expected (multivariate) Gaussian distribution. One way that usually comes to mind to circumvent this problem is to transform the data until normality is achieved (Khatri, 1966). This step, if taken may however result into loss of some useful information in the original data couple with the problem encountered at interpreting the final results among other drawbacks. It is the realization of these facts that motivated the present work to evolve suitable alternative test procedure(s) that would be efficient at modelling data with inherent non-normal responses within the MANOVA context. The powers of the proposed test procedures are compared with those provided by three of the existing methods to determine their relative efficiency.
2.0 Methodology
As earlier remarked, the major task in MANOVA test is to examine whether the vectors of means for two or more groups could be said to have emanated from the same sampling distribution using appropriate test statistics. A test statistic is used to assess a particular hypothesis through the sample data obtained from one or more populations. The essential requirement of such a statistic is a known distribution when the null hypothesis is true. In testing the hypothesis of equality of vector of means of the form
H0: against H1: for , (1)
within the MANOVA context, the four popular test statistics that are often employed are the Wilks’ Lambda
(Wilks, 1932), Hotelling-Lawley's trace (Hotelling, 1951), Pillai-Bartlett trace (Pillai, 1955) and Roy’s greatest characteristic roots (Roy, 1957) test statistics.
In Multivariate test there is no one uniformly most powerful test which is invariant to all transformations. Which test is best in the sense of being the most powerful depends on the nature of the departure from the null hypothesis (Hand and Taylor. 1987). The lack of a uniformly most powerful test is one of the reasons why several different test statistics were been proposed. The power of multivariate test statistics depends largely on the way in which the group means vectors in the underlying population depart from the null hypothesis of equality of the vector of means. Nonetheless, all the test statistics are expected to give the same conclusion concerning the rejection of the null hypothesis or otherwise (French and Paulson, 2002)
One of the fundamental assumptions that underlying the use of any of the above test statistics for MANOVA modelling is that, the vector of response variables y must have a multivariate Gaussian density (Timm, 1975; Bray and Scott, 1985). If y has a multivariate normal distribution with mean vector µ and
covariance matrix ∑, then, its density function would be of the form
(2)
where k is the number of response variables in the data.
If the assumption normal distribution on the response vector is violated by the data, resulting into thick-tailed or heavily skewed distribution, the power of the MANOVA test may be reduced considerably and any inference based on such results might be misleading.
Apart from normality assumption on the response vector, other assumptions that are expected to be
met by the data for MANOVA modelling using any of the existing test methods are i.) Linearity– that all the
dependent variables should be moderately correlated, i.e. having correlation between 0.3 and 0.7 ii.) Homogeneity of variances - that the dependent variables should have apparently equal levels of variance across the range of the predictor variables (factors). iii.) Homogeneity of covariances – that inter-correlations (covariances) between pairs of dependent variable across all the levels of factors are approximately equal.
the above three test procedures for modelling MANOVA becomes a suspect. This paper therefore proposed alternative test statistics which essentially are modified form of the three of the original test statistics for MANOVA (Wilks lambda, Pillai trace, Roy’s characteristic roots) to model data sets with certain degrees of
departure from normality within MANOVA context. More emphasis is given to the powers of all the tests developed as a tool for determining the best out of them.
2.1 The Modified Test Statistics for MANOVA Under Non-Normal Responses
The section presents the methodologies of the three modified test statistics for MANOVA modelling of data set with inherent non-Gaussian responses. The three modified test statistics were developed by truncating the series expansions of each of the three original test statistics (Wilks lambda, Pillai trace, Roy’s characteristic roots)
considered.
The justification for this truncation arise from the fact that, the form of the original test statistics of
Wilks, Pillai and Roy suggested that full information in the binomial expansion as required in each
method was used in computation.
However, it is suspected that if partial information in this binomial expansion is used by truncating it at a particular power of , the distribution of the original test statistics would obviously be distorted. If this is so therefore, the resulting truncated test statistics might be suitable to capture data set with non-Gaussian structure as demonstrated in this work. Details on the development of the truncated test statistics are presented in what follows.
Wilks in 1932 developed the test statistic
(3)
which is the product of the unexplained variance of all the treatments. In 2.1, is the number of responses per treatment, N is the total number of elements in the sample data, represents the Eigen value of the
characteristic roots and . The Wilks statistic is a measure of the differences between
groups of the centroid (vector) of means on the independent variables (Stevens, 1980). The test statistic in (3) can be expressed as
(4)
and using binomial theorem and Taylor series expansion (Dani, 2012; Yahya et al., 2014) on (4), it becomes;
(5)
The form of the statistic in (5) would obviously yield numerical approximation of the test statistic in (4).
Therefore, it then follows that if the summation in the bracket of (5) is decomposed over the product ,
the following truncated Wilks statistics would be obtained;
(6) (7) (8)
and so on. These are the three truncated Wilks test statistics that are derived from its original form. The behaviours of all the above truncated test statistics on MANOVA tests at varying degrees of non-normal responses are examined.
The development of the modified test statistics from the original proposition of Pillai (1955) is similar to that of the Wilks (1932). The Pillai’s trace test statistic (Manly, 2001; Pillai, 1955) is given by
(9)
(10) and finally as (using binomial and Taylors series expansion);
(11)
Now, taken the summation in (11) over the first two terms, the first three terms and the first four terms yield the following respective truncated Pillai test statistics;
(12)
(13)
(14)
Finally, the modification of the Roy’s test statistic is as given below. The Roy’s greatest characteristic roots
(Manly, 2005; Roy, 1957) test statistic is given by
(15)
(16)
which finally becomes (after binomial and Tailors series expansion);
(17)
The first two terms, the first three terms and the first four terms of the expression in (17) yield the following
truncated Roy’s test statistics;
(18)
(19)
(20)
respectively. Thus, the expressions in (18) through 20 are the new test statistics from the original Roy’s test
statistic in (15).
The powers of all the above nine proposed truncated test statistics for modelling MANOVA data with non-normal responses are examined and the best among them are determined through extensive Monte-Carlo studies as discussed in later sections. The power of a statistical test is the ability of the test to detect the statement in the alternative hypothesis when such is true (Cohen, 1977; Muller and Peterson, 1984; Yahya and Adeleke, 2012).
3.0 Simulation Studies
The schemes for simulating data for the series of MANOVA tests perform in this study are as follow.
Two non-normal response groups , each at three factor levels were simulated from a mixture of
uniform and Gaussian densities with mixing parameter , of the form
(21)
The values of represent the fractions of the sample data that were simulated from Gaussian density, while
represents the fraction of that came from uniform distribution. The fraction of the sample data in
that were simulated from Gaussian density have the following mean structure over the three factor levels, =
(100, 105), = (115, 105), and = (100, 102). Also, the fraction ( of the response vector that
were simulated from the uniform distribution have the following parameter structure (100,120; 105,120),
and . Sample sizes between 10
were considered each for the mixing parameter values set at = 0.3, 0.4, 0.6, 0.7, 0.8 and 1.0. To ensure stable and consistent results, all the simulation exercises were replicated 2000 times.
4.0 Results
Various results from the Monte-Carlo studies regarding the behaviours of the nine proposed test statistics for performing MANOVA tests on data with varying degrees of departure from normality are presented in this section. The powers of the various tests were determined at varying sample sizes and at varying degrees of non-normal responses. For better comparison of the performances of the proposed tests with the existing ones, the results (in term of powers) of the three existing MANOVA tests considered in this work are equally reported. All the powers reported were those obtained at 5% Type I error level for all tests.
It is important to remark that, various results from the simulation studies in this work have shown that the best test statistics that is most suitable for modelling data with non-normal responses from each of the original MANOVA tests modified are obtained at the first four term of the series expansion (results not shown due to space). The results of these modified tests at higher order of the expansion (i.e. the first five, first six, first seven terms and so on) essentially yielded the same results as that of the first four terms, apparently showing convergence at the fourth power.
It then follows that, the proposed test statistics for modelling data with non-normal responses within
the MANOVA context are (modified Wilks),
(modified Pillais) and
(Modified Roy’s) as presented in equations (8), (14) and (20) respectively. Therefore, subsequent results and
discussions shall be based on these three modified test statistics.
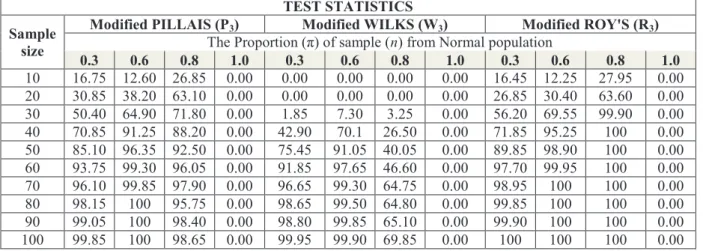
Table 1: The estimated Powers (in %) of the modified MANOVA test statistics arising from the truncated Pillais (P3), Wilks (W3) and Roy's (R3) for different proportion of samples that are from normal population at various sample sizes.
TEST STATISTICS Sample
size
Modified PILLAIS (P3) Modified WILKS (W3) Modified ROY'S (R3) The Proportion (π) of sample (n) from Normal population
0.3 0.6 0.8 1.0 0.3 0.6 0.8 1.0 0.3 0.6 0.8 1.0 10 16.75 12.60 26.85 0.00 0.00 0.00 0.00 0.00 16.45 12.25 27.95 0.00 20 30.85 38.20 63.10 0.00 0.00 0.00 0.00 0.00 26.85 30.40 63.60 0.00 30 50.40 64.90 71.80 0.00 1.85 7.30 3.25 0.00 56.20 69.55 99.90 0.00 40 70.85 91.25 88.20 0.00 42.90 70.1 26.50 0.00 71.85 95.25 100 0.00 50 85.10 96.35 92.50 0.00 75.45 91.05 40.05 0.00 89.85 98.90 100 0.00 60 93.75 99.30 96.05 0.00 91.85 97.65 46.60 0.00 97.70 99.95 100 0.00 70 96.10 99.85 97.90 0.00 96.65 99.30 64.75 0.00 98.95 100 100 0.00 80 98.15 100 95.75 0.00 98.65 99.50 64.80 0.00 99.85 100 100 0.00 90 99.05 100 98.40 0.00 98.80 99.85 65.10 0.00 99.90 100 100 0.00 100 99.85 100 98.65 0.00 99.95 99.90 69.85 0.00 100 100 100 0.00
In Table 1, the estimated powers of the three modified tests statistics (P3, W3, R3) for MANOVA
modelling of simulated data with varying degrees of non-normal responses, ( = 0.3, 0.6, 0.8 and 1.0) at
various sample sizes are presented.
Results from Table 1 revealed that the three modified test statistics are quite efficient, in term of their,
powers at modelling data with the worst (about 70%) departure from non-normal responses (at ). All
the three tests have appreciable power of about 80% at relatively small sample size as low as 50.
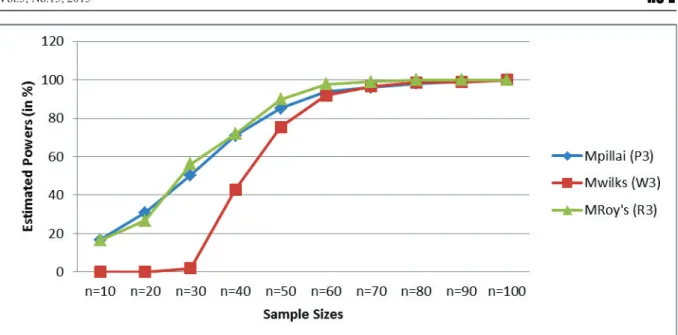
However, it can be observed from the results in Table 1 that both the modified Roy’s and modified
Pillai test statistics (R3 and P3) are competing with each other and more efficient than the modified Wilks test method (M3) in term of their powers at various sample sizes. These performance behaviours of these tests are clearly revealed by the plot of the powers of all the three modified test statistics at various sample sizes when the
Fig 1: Line graphs of the powers of the three modified MANOVA tests methods at various sample sizes on data
with 70% departure from Gaussian responses (at ).
Based on the results in Table 1 and the power graphs in Fig 1, it can be concluded that both the Modified Pillai (P3) and modified Roy’s (R3) statistics are the only efficient test methods for MANOVA testing with non-Gaussian data set. The competing performances of both the P3 and R3 as shown in Fig 1 simply
indicates that either the test statistic P3 or R3 could be employed for MANOVA testing with non-Gaussian data
sets.
Furthermore, as a way of comparing the goodness of the truncated test statistics with their original form, we present in Fig 2 the power plots of the modified Pillai statistic P3 and that of the original Pillai statistics
on data with 70% and 40% departure from Gaussian responses (with and 0.6 respectively) at various
sample sizes. Results displayed by the graphs showed that the modified Pillai trace statistic, P3 is more powerful than the original Pillai especially at small sample sizes under the two data conditions.
Also, the powers of the original MANOVA tests methods (Pillai, Wilks and Roy’s statistics) on
simulated data with the worst departure from normal responses (at ) as considered here are compared
with the powers of the modified Pillai (P3) and modified Roy’s (R3) statistics on the same data. This is intended to have a clear overview of the strength of some of the existing test methods at modelling data with inherent non-normal responses vis-à-vis the two proposed modified test methods.
20 40 60 80 100
0
40
80
plot of power at various sample sizes and 0.3
Sample sizes
E
st
im
at
ed
P
ow
er
(in
%
)
Pillai MPillai 20 40 60 80 1000
40
80
plot of power at various sample sizes and 0.6
Sample sizes
E
st
im
at
ed
P
ow
er
(in
%
)
Pillai MPillaiFig 2: The plot of the powers of original Pillai trace tests method and the modified Pillai statistic (P3) at various
sample sizes on data with 70% and 40% departures from Gaussian responses (at ). In the
two cases of non-normality, the power of the modified Pillai test method is higher than that of the classical test method especially at small sample sizes.
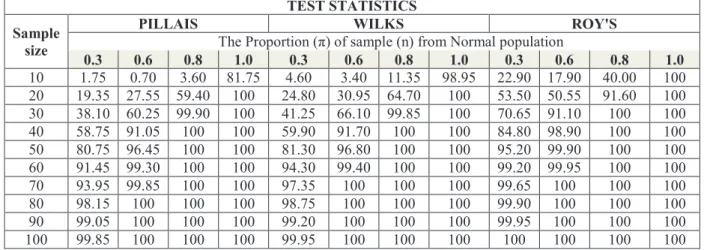
Table 2: The estimated Powers (in %) of the classical MANOVA test Statistics (Pillais, Wilk's and Roy's) under different proportion of samples that are from normal population at various sample sizes.
TEST STATISTICS Sample
size
PILLAIS WILKS ROY'S
The Proportion (π) of sample (n) from Normal population
0.3 0.6 0.8 1.0 0.3 0.6 0.8 1.0 0.3 0.6 0.8 1.0 10 1.75 0.70 3.60 81.75 4.60 3.40 11.35 98.95 22.90 17.90 40.00 100 20 19.35 27.55 59.40 100 24.80 30.95 64.70 100 53.50 50.55 91.60 100 30 38.10 60.25 99.90 100 41.25 66.10 99.85 100 70.65 91.10 100 100 40 58.75 91.05 100 100 59.90 91.70 100 100 84.80 98.90 100 100 50 80.75 96.45 100 100 81.30 96.80 100 100 95.20 99.90 100 100 60 91.45 99.30 100 100 94.30 99.40 100 100 99.20 99.95 100 100 70 93.95 99.85 100 100 97.35 100 100 100 99.65 100 100 100 80 98.15 100 100 100 98.75 100 100 100 99.90 100 100 100 90 99.05 100 100 100 99.20 100 100 100 99.95 100 100 100 100 99.85 100 100 100 99.95 100 100 100 100 100 100 100
In order to compare the three existing test methods with the new truncated test methods P3 and R3, we present in Table 2, the estimated powers of the original Wilks, Pillai and Roy’s tests on data sets with varying
degrees of departure from normality at various sample sizes.
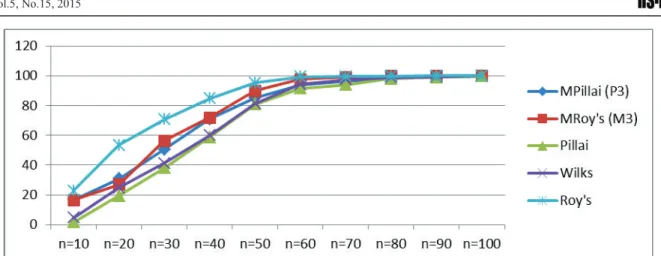
We obtain the plots of the powers of the original MANOVA test methods and that of the modified tests
P3 and R3 at various sample sizes on data with 70% departure from Gaussian responses (at ) as shown
in Fig 3. The estimated powers of P3 and R3 as provided in Table 1 at were used for the power plots
Fig 3: The graphs of the powers of the three existing MANOVA tests methods and that of the modified Pillai (P3) and Roy’s (R3) test statistics at various sample sizes on data with 70% departure from Gaussian responses
(at ).
An interesting result from our Monte-Carlo study is however revealed by the plots of powers of the various tests as shown in Fig 3. It could be observed from Fig 3 that the powers of the original Roy’s test method
are relatively higher than those provided by the modified tests P3 and R3 at small sample sizes on data with inherent non-normal responses. This performance of Roy’s statistic is not quite surprising because it has been
reported that the Roy’s test method is quite robust to some data requirements relative to its other counterparts (Timm, 1975). Thus, this result simply implies that the original Roy’s test method is a viable alternative for MANOVA testing on data with inherent non-normal responses.
Another feature that are observed in Table 2 is that the powers of the three original MANOVA tests
keep increasing as the proportion of the sample data that are from Gaussian population increases (as )
at all the sample sizes considered. In fact, all the existing test methods attained almost 100% power when the
data are purely from Gaussian population (at ).
5.0 Discussion and Conclusion
Situations that call for comparison of a set of mean responses using the instrument of MANOVA tests are often encountered on daily basis in the manufacturing industries, clinical trials, drug discovery, service industries and the like. The use of appropriate statistical tools for analysis in these diverse areas would enable appropriate decisions that would assist the policy makers to be made on the situation being investigated. However, if wrong statistical tools are employed, any inference based on the results that arise from the use of such tools might be misleading.
In statistical hypothesis testing, a number of assumptions and rules are often desirable to be met depending on type of statistical tools to be adopted (Yahya and Adeleke, 2012; Yahya et al., 2014). In multivariate tests of equality of mean vectors in particular, the statistical instrument of MANOVA tests require that the vector of sample mean responses should have a multivariate Gaussian density among other requirements. However, it has been established that many real life situation been investigated do not always yield data sets that possess this basic property. Therefore, it is quite necessary to evolve efficient statistical methods that would handle such data in order to yield dependable results. This is the task engaged in the present study.
Three of the basic statistical test methods for performing MANOVA tests are examined. Two alternative test statistics which are essentially the truncated forms of two of the existing test methods for MANOVA testing when the normality assumption on the response vector is relaxed are proposed. Power analysis of the various modified test methods and the existing ones are carried out to determine the relative
advantage one has over the other. Results from Monte-Carlo studies finally showed that the Pillai’s and Roy’s
truncated test methods (P3) and (R3) respectively are most efficient to model data with clear evidence of non-normal responses within the MANOVA context under small sample size situations.
Further results from this work equally revealed that the original Roy’s tests statistic (Roy, 1957) is also
a suitable test method for MANOVA testing with data having non-Gaussian responses due to its robustness to some basic data requirements and assumptions.
The truncated tests methods for MANOVA testing on data with inherent non-normal responses proposed in this work are suitable only when the sample data show evidence of deviation from normal density. Whenever the vector of responses have the required multivariate Gaussian density, any of the classical test methods should be employed. However, further results from this work revealed that whenever the vector of
tendency to yield higher statistical power than any of its existing counterparts.
References
[1] Bray J. H. and Scott, E. M. (1985): Multivariate analysis of Variance. Quantitative applications in the
social science. Sage Publications, Canada.
[2] Brue, L. B., Suzanne, B. H. and Kent, A. H. (2004): Performance properties of the four MANOVA Statistics. Joint statistical Meetings Section on Statistical Consulting, Brigham Young University, Provo, UT.
[3] Carey, G. (1998): Multivariate Analysis of Variance (MANOVA): I. Theory. URL:
http://ibgwww.colorado.edu/~carey/p7291dir/handouts/manova1.pdf (Accessed on 1st June, 2014)
[4] Chatfield C. and Collins A. J. (1995): Introduction to Multivariate Analysis: Text in Statistical Science.
Chapman and Hall, England.
[5] Cohen, J. (1977): Statistical power analysis for the behavioural sciences. Academic Press, New York;.
[6] Dani, S.G. (2012): Ancient Indian Mathematics-A conspectus. Resonance; 17(3): 236 - 46.
[7] Everitt, B.S. and Dunn, G. (2001): Applied Multivariate Data Analysis. 2ed., Oxford University Press
Inc, USA.
[8] French, A. and Paulson, J. (2002): Multivariate Analysis of Variance (MANOVA). McGraw-Hill: New
York.
[9] Hand, D. J. and Taylor, O. C. (1987): Multivariate Analysis of variance and Repeated Measures. A Practical Approach for Behavioural Scientist. Chapman and Hall, New York.
[10] Hotelling, H. (1951): A generalized T-test and Measure of Multivariate Dispersion. Proceedings of Second Berkely Symposium on Mathematics and Statistics, 23-41.
[11] Khatri, C. G. (1966): A note on a MANOVA model applied to problems in growth curve. Annals of
the Institute of Statistical Mathematics, 18 (1): 75-86.
[12] Manly, B. F. J. (2005): Multivariate Statistical Methods: A primer. 3rd ed., Chapman & Hall/CRC, USA.
[13] Manly, B. F. J: (2001): Statistics for Environmental Science and Management: Chapman and Hall/CRC,
USA.
[14] Muller K. E. and Peterson, B. L. (1984): Practical methods for computing Power in testing the Multivariate general linear hypothesis. Computational Statistics and Data Analysis, 2:143-158.
[15] Pillai, K. C. S. (1955): Some new test criteria in multivariate analysis, Ann. Math Statistic 19: 47-57
[16] Rencher, A. C. (1995): Methods of multivariate analysis. John Wiley and Sons, New York.
[17] Richard, F. H. and Michael V. E. (1987): Multivariate Analysis of Variance, Journal of Counselling Psychology, 34(4): 404-413
[18] Roy, S. N. (1957): Some aspect of multivariate analysis. John Wiley and Sons, New York.
[19] Stevens, J. P. (1980): Power of the multivariate analysis of variance tests, Psychological Bulletin, 88:
728-737.
[20] Stevens, J. P. (2002): Applied multivariate statistics for the social sciences. Mahwah, NJ.
[21] Tabachnick, B. G. and Fidel, L. S. (2012): Using Multivariate Statistics. 6th ed., Collins College Publishers, New York.
[22] Timm, H. N. (1975): Multivariate with Application in Education and Psychology. Books/Cole
Publishing Co., USA.
[23] Wilks. S. S. (1932): Certain generalizations in the analysis of variance, Biometrika, 24: 471-494.
[24] Yahya, W.B. and Adeleke, B. L. (2012): Concepts of hypothesis testing. In: Philosophy and Science,
163-176. Publications of General Studies Division, University of Ilorin, Ilorin, Nigeria.
[25] Yahya, W.B. and Olaifa, J.B. (2014): A note on Ridge Regression Modeling Techniques. Electronic Journal of Applied Statistical Analysis. http://siba-ese.unisalento.it/index.php/ejasa/index (Accepted). [26] Yahya, W.B., Adebayo, S.B., Jolayemi, E.T., Oyejola, B.A. and Sanni, O.O.M. (2008): Effects of
non-orthogonality on the efficiency of seemingly unrelated regression (SUR) models”. InterStat Journals, 1 -29. http://interstat.statjournals.net/.
[27] Yahya, W.B., Rosenberg, R. and Ulm, K. (2014): Microarray-based Classification of Histopathologic
Responses of Locally Advanced Rectal Carcinomas To Neoadjuvant Radiochemotherapy Treatment. Turkiye Klinikleri Journal of Biostatistics, 6(1):8-23.