FACOLTÀ DI INGEGNERIA CIVILE E INDUSTRIALE Dipartimento di Ingegneria Civile, Edile e Ambientale
Dottorato di Ricerca in Infrastrutture e Trasporti
Identification of Cost-Effective Pavement Management Systems Strategies
A Reliable Tool to Enhance Pavement Management Implementations
Tutor: Dottorando:
Prof. Ing. Giuseppe Loprencipe Antonio Pantuso Romero
Abstract
Modeling asset deterioration is a key business process within Transportation Asset Management. Road agencies should budget a large amount of public money to reduce the number of accidents and achieve a high level of service of the road system. Managing and preserving those investments is crucial, even more in the actual panorama of limiting funding. Therefore, roadway agencies have to increase their efforts on monitoring pavement networks and implementing data processing tools to promote cost-effective Pavement Management System (PMS) strategies. A comprehensive PMS database, in fact, ensures reliable decisions based on survey data, and sets rules and procedures to analyze data systematically. However, the development of adequate pavement deterioration prediction models has proven to be difficult, because of the high variability and uncertainty in data collection and interpretation, and because of the large quantity of data information from a wide variety of sources to be processed.
This research proposes a comprehensive methodology to design and implement pavement management strategies at the network level, based on road agency local conditions.
Such methodology includes the identification of suitable indexes for the pavement condition assessment, the design of strategies to collect pavement data for the agency maintenance systems, the development of data quality and data cleansing criteria to support data processing and, at last, the implementation spatial location procedures to integrate pavement data involved in the comprehensive PMS.
This work develops network level pavement deterioration models, and reviews road agency preservation policies, to evaluate the effectiveness of maintenance treatment, which is essential for a cost-effective PMS. It is expected that the resulting methodology and the developed applications, product of this research, will constitute a reliable tool to support agencies in their effort to implement their PMS.
Acknowledgments
First, I want to express my sincere gratitude to Professor Giuseppe Loprencipe and Professor Paola Di Mascio for your consistent guidance, your encouragement to reach new goals and for being trustful giving many opportunities for my professional growth during the Ph.D. I am grateful for your kindness, friendship, and sincerity which makes me feel confident and comfortable ready to face new challenges.
Secondly, I want to express my highest appreciation to Professor Dr. Gerardo W. Flinstch to invite me as a Visiting Research Scholar at the Center for Sustainable Transportation (CSTI) group at Virginia Tech Transportation Institute (VTTI) and let me to participate in working meetings, attend classes, help on testing campaigns, and meet international professors and researchers. Thank you for giving me a unique and valuable opportunity to improve the quality of my entire Ph.D. research. I appreciate your support, your kindness, guidance, consistent feedback, and help before, during, and after my stay. I extend my gratitude to Dr. Samer W. Katicha for helping me to increase my capacities in statistical data analysis and programming skills. My gratitude is special to Dr. Edgar de León Izeppi for your feedback and for your interest in my research offering me help when I was working after-hours, and more especially for those moments when I felt home with your family. Thank you for inviting me to celebrate Easter with you and your wife Bonnie, for inviting me to barbecues with your friends and to introduce me to the Hokie Nation. I appreciate all your kindness and your familiarness.
I am grateful to faculty members at Sapienza University of Rome, in special, to Professor Giuseppe Cantisani, Professor Laura Moretti, Professor Nicola Fiore, and Professor Antonio D’Andrea. Thank you for your sincere feedback and kind guidance what has helped me learn a lot during the Ph.D.
I want to thank all my Ph.D. Colleagues at Sapienza University of Rome, Pablo Zoccali, Lorenzo Puzzo and Giulia Del Serrone for your help, to suggest me new experimental approaches to enhance the quality of my research and for your friendship. Especially, I want to acknowledge my friend and colleague Claudio Mineo to share with me your culture, your kindness and your friendship in the last year of the Ph.D.
I extend my gratitude to my friends and colleagues in Blacksburg, VA, to be there always when I needed it, specially to Kenneth X. Velez to be like a brother and to Shivesh Shrestha for your friendship during my stay in Blacksburg. Thank you all for sharing with me breakfasts, lunches, dinners, at home and outside. Because of you all, I felt home in Virginia.
Furthermore, I want to express my gratitude to Dr. Guido Bonin to collaborate in my research, giving me useful and consistent feedback adding value to my research in practical terms. Thank you for your suggestions and encouragement to develop new applications. I appreciate your friendship and sincerity.
I want to express all my respect and appreciation to Professor Silvia Caro for giving enlightenment and new horizons to my research. You gave me valuable and useful tips that were an essential input for the critical lecture of the challenges of my research and their opportunities. You gave me a lot in a very short time during your stay as a Visiting Professor. Thank you for your sincerity, your natural happiness and your closeness, also after your departure.
I would also like to special thanks to Professor Germán Alfonso Ríos García, my Master’s Thesis director for your help, expertise, encouragement, and engineering judgment. You gave me input and engineering criteria. Your rigor and pragmatism fundamental to become me an engineer. Thank you for your friendship and generosity sharing with me your culture.
Finally, I want to thank my family who is responsible for who I am and because without your support I would not have been able to complete the Ph.D. To my parents and my sister because you are the perfect family somebody can have. To my uncles and cousins in Lebrija and Roma. To my Italian grandparents for sharing their love with me every day. To the memory of my grandmother Dolores for everything given to me. You all helped me every day heeding me with my work and worries, giving me something that cannot be explained with words but fills my life and my heart. I also want to thank you, Delia, my friend, my English teacher, for sharing with me your superlative taste in fine arts, humanities, and broad aspects of life. You gave me a learned perspective on life, and even now, you inspire me to learn more every day. Especially, I want to thank you, Angela, my friend and companion, to follow me in my adventures, helping me to be myself and to improve me every day. Your light, your support, and love made possible this work.
Table of Contents
Chapter 1. Introduction, objective and background ... 1
1. Introduction, objective and background ... 1
1.1 Introduction ... 1
1.2 Problem definition and research approach (problem statement) ... 2
1.3 Research Objective ... 3
1.4 Results and significance ... 3
1.5 Dissertation organization ... 3
Chapter 2. Literature review ... 7
2. Literature Review ... 7
2.1 Pavement Management Systems ... 7
2.2 Pavement Condition Data Collection ... 9
2.2.1 Roughness / Longitudinal profile ... 13
2.2.2 Transverse profile: rutting ... 16
2.2.3 Vehicle Road Interaction Surface Characteristics ... 17
2.2.3.1 Surface Texture ... 17
2.2.3.2 Skid Resistance ... 20
2.2.4 Pavement surface distresses ... 21
2.2.5 Pavement structure evaluation ... 25
2.2.6 Incorporating Structural Capacity Performance Measures ... 30
2.3 Pavement Condition Assessment ... 34
2.3.1 ASTM D6433 Standardized Procedure: Pavement Condition Index ... 34
2.3.2 Virginia DOT: Critical Condition Index (CCI) ... 37
2.3.3 National Park Services: Pavement Condition Rating (PCR) ... 38
2.3.4 Wisconsin DOT: Pavement Surface Evaluation and Rating (PASER) ... 40
2.3.5 Pavement Condition Assessment in the European Scene ... 41
2.3.6 Pavement Management Systems in Urban Networks ... 41
2.4 Pavement Deterioration Modeling at The Network Level ... 44
2.5 Pavement Preservation Strategies Experiences ... 46
2.6 Pavement Data Management Issues: Network Level Considerations ... 47
2.6.1 Linear Referencing Systems and Spatial Positioning Systems ... 48
2.6.2 Sampling Intervals and Sectioning, Survey Frequency ... 49
2.7 Summary of Literature Review ... 49
Chapter 3. Pavement Distress Identification Guidelines and Condition Assessment in Urban Areas ... 53
3. Pavement Distress Identification Guidelines and Condition Assessment in Urban Areas ... 53
3.1 Introduction ... 53
3.3 The PCI Method: Visual Survey on Valentano Road Network ... 55
3.4 Pavement Distress Distribution Analysis ... 56
3.5 Algorithm for the Computerization of PCI Calculation ... 59
3.5.1 VBA PCI Calculation Standardized Procedure ... 59
3.5.2 Deduct Value - Polynomial Interpolating Curve Hermite Procedure ... 60
3.6 Definition of New Distress Identification Catalogue for Asphalt Concrete Pavements in Urban Areas ... 66
3.7 Validation of the Computerization of PCI Calculation ... 70
3.8 Discussion ... 72
3.9 Conclusions ... 75
Chapter 4. Pavement Management System Considering the Vehicle Operating Costs: A Case of Study in Urban Areas ... 77
4. Pavement Management System Considering the Vehicle Operating Costs: A Case of Study in Urban Areas ... 77
4.1 Introduction ... 77
4.2 Methodology for PMS Implementation in Urban Areas ... 78
4.3 Results of a Pilot PMS Implemented in Urban Road Network ... 80
4.3.1 Repair and Maintenance Planning ... 80
4.3.2 Life-Cycle Cost Analysis—Vehicle Operating Costs Estimation ... 85
4.4 Discussion ... 88
4.5 Conclusions ... 89
Chapter 5. Pavement Management Data Strategies: Guidelines to Enhance Data Processing and Interpretation ... 91
5. Pavement Management Data Strategies: Guidelines to Enhance Data Processing and Interpretation ... 91
5.1 Pavement Data Management Methodologies Studied During the Ph.D. Program ... 91
5.2 Spatial Integration Tools ... 92
5.2.1 Implementation of LRS System from Pavement Survey Data ... 93
5.2.2 Enhancing Data Integration using Spatial GPS Matching Procedures ... 94
5.2.3 Pavement Database Integration – Merging Data From Different Sources... 96
5.3 Pavement Historical Data Management ... 98
5.4 Data Visualization Tools ... 100
5.5 Discussion and Conclusions ... 102
Chapter 6. Analysis of Pavement Condition Survey Data for Effective Implementation of a Network Level Pavement Management Program For a Developing Country ... 105
6. Analysis of Pavement Condition Survey Data for Effective Implementation of a Network Level Pavement Management Program For a Developing Country ... 105
6.1 Introduction ... 105
6.2 Pavement Survey Data Available ... 106
6.3 Pavement Data Analysis and Processing ... 107
6.3.2 Analysis of Traffic Data ... 108
6.3.3 Analysis of Deflection Data: Required Overlay Parameter ... 109
6.4 Methodology for Determining Homogeneous Sections and a Decision-Making Process Based on Survey Data 111 6.4.1 Definition of Pavement Homogeneous Section Criteria ... 111
6.4.2 Definition of the Decision-making Process ... 112
6.5 Conclusions ... 115
Chapter 7. Development of Pavement deterioration curves of flexible pavements using the Linear Empirical Bayesian Approach at the Network Level ... 117
7. Development of Pavement Deterioration Curves of Flexible Pavements using the Linear Empirical Bayesian Approach at the Network Level ... 117
7.1 Introduction ... 117
7.2 Overview Data Analysis and Methodology Used ... 118
7.2.1 Analysis of CCI data: data cleansing and filtering process considerations... 119
7.2.2 Data Cleansing and Filtering Process ... 119
7.2.3 The Empirical distribution of Pavement Condition: Negative Binomial (Poisson-Gamma model) 122 7.2.4 Negative Binomial model Development and Virginia DOT Pavement deterioration models 126 7.2.5 Empirical Bayesian Approach ... 126
7.3 Deterioration Model Development ... 130
7.4 Validation of modelling procedure ... 132
7.5 Discussion and Conclusions ... 137
Chapter 8. Design Pavement Management Strategies: Performance Assessment for Network Level Pavement Preservation ... 139
8. Design Pavement Management Strategies: Performance Assessment for Network Level Pavement Preservation ... 139
8.1 Introduction ... 139
8.2 Methodology ... 140
8.3 Results 142 8.3.1 Pavement Performance Models ... 142
8.3.2 VDOT Pavement Maintenance Policies Effectiveness ... 148
8.3.2.1 Performance Jump ... 149
8.3.2.2 Maintenance Treatment Service Life ... 151
8.3.2.3 Cost-Benefit Analysis ... 151
8.4 Discussion of Results ... 154
8.5 Recommendations for Future Research ... 155
Chapter 9. Conclusions, recommendations and Future Research ... 157
9. Conclusions, recommendations and Future Research ... 157
9.1 Summary of Dissertation ... 157
9.4 Recommendations for Future Research ... 160
Appendix A. Distress Identification Manual for Urban Road Pavements ... 169
Appendix B. Software calculation PCI documentation ... 179
Appendix C. Code used in Chapter 6 ... 181
Appendix D. Code used in Chapter 7 ... 185
List of Figures
Figure 2-1. Pavement Life Cycle: Consequences of Poor Maintenance Timing (after Shahin (2005)) . 8
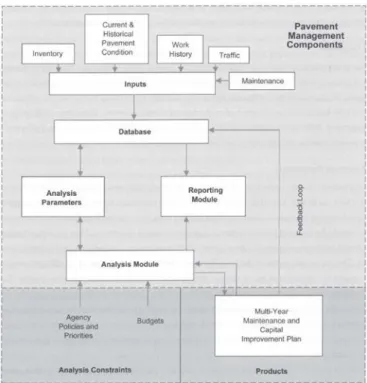
Figure 2-2. Components of pavement management systems (after (AASHTO 2012)) ... 9
Figure 2-3. Information Quality Level (after Bennett and Paterson (2003)) ... 10
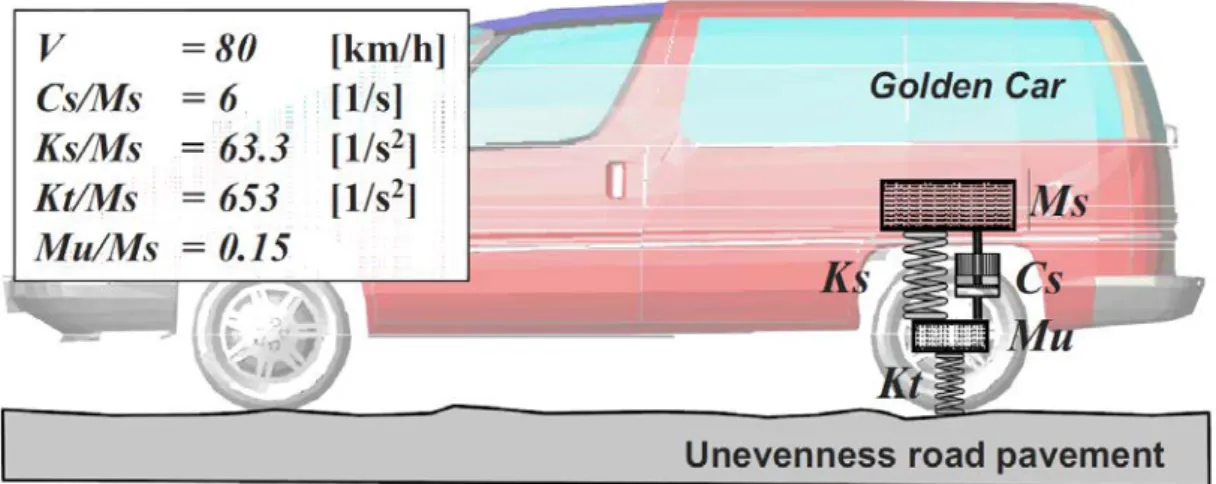
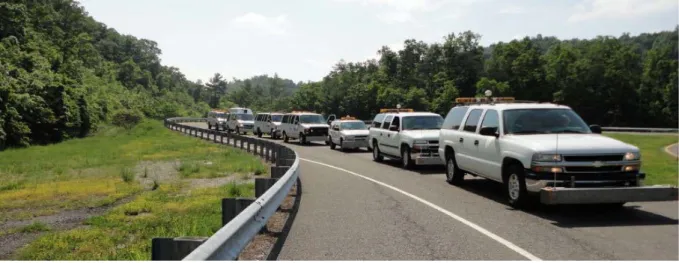
Figure 2-4. Quarter-car model for the calculation of the IRI (after Cantisani and Loprencipe (2010)) 14 Figure 2-5. High speed profiler participants at Surface Properties Round up (source: TPF-5(141) Final Report) ... 15
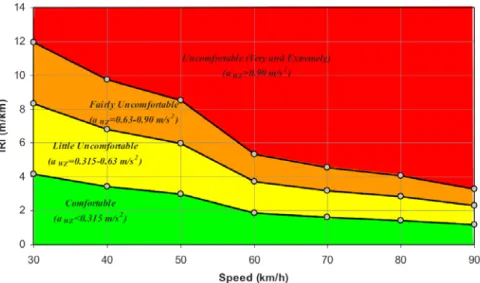
Figure 2-6. Proposal for new speed-related IRI thresholds, considering the aWZ limits established by technical standards (after Cantisani and Loprencipe (2010)) ... 16
Figure 2-7. Pavement Surface Characteristics Influence Wavelength (after Cantisani, D’Andrea et al. (2016)) ... 17
Figure 2-8. Surface Texture Key mechanisms of Pavement Friction (after Hall, Smith et al. (2009)) . 18 Figure 2-9. Paved Surface Frictional properties measurement apparatus: a) Circular Meter and b) Dynamic Friction Tester ... 19
Figure 2-10. Representation of the profile characteristics for the calculation of MPD (after Flintsch, de Leon et al. (2003)) ... 19
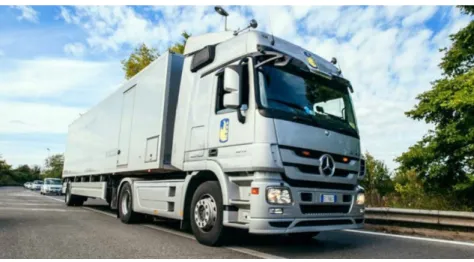
Figure 2-11. Virginia SCRIM truck at VTTI Smart Road Testing Facility (Source: www.wdm.co.uk) ... 21
Figure 2-12. ARAN instrumented vehicle (a) and WiseCrax automated crack detection software (b) (source: Fugro Roadware) ... 24
Figure 2-13. LCMS system imaging processing (a) and LCMS sensors mounted on an instrumented vehicle (b) (source: Pavemetrics) ... 24
Figure 2-14. FWD testing equipment surface deflection bowl (after Choi, Wu et al. (2009)) ... 25
Figure 2-15. Traffic Speed Deflectometer ANAS (Source: ANAS Gruppo FS Italiane) ... 30
Figure 2-16. Standard and customized PCI rating scale (after Loprencipe and Pantuso (2017))... 35
Figure 2-17. Distribution of road types on an Italian road network (Loprencipe, Pantuso et al. 2017) 41 Figure 3-1. Urban Pavement Distress Identification and Assessment Methodology based on the PCI (after Loprencipe and Pantuso (2017)) ... 54
Figure 3-2. Valentano’s Network characterization ... 55
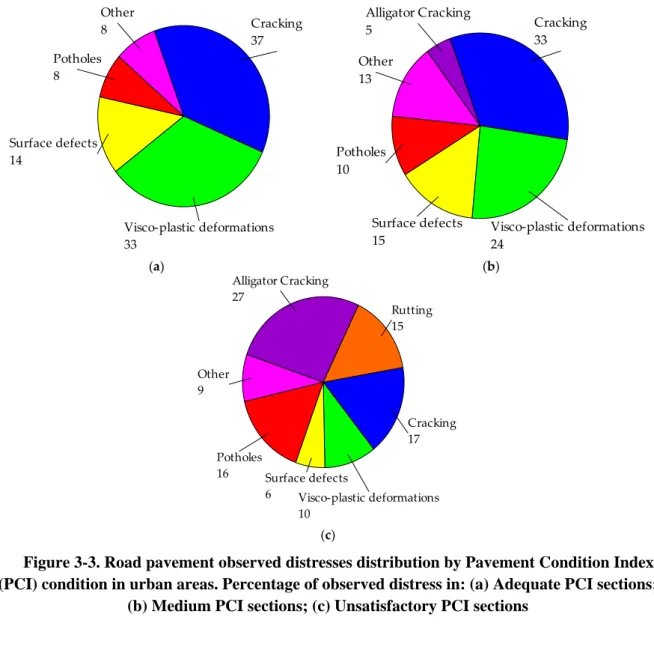
Figure 3-3. Road pavement observed distresses distribution by Pavement Condition Index (PCI) condition in urban areas. Percentage of observed distress in: (a) Adequate PCI sections; (b) Medium PCI sections; (c) Unsatisfactory PCI sections ... 58
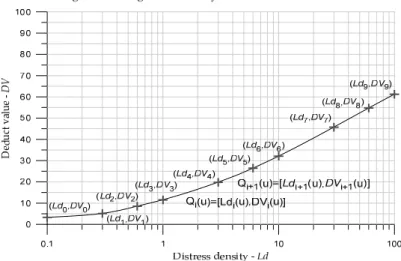
Figure 3-4. Logarithm Density- Deduct Value Polynomial Interpolating Curve Hermite Procedure ... 60
Figure 3-5. Parametric plane (u, DV) Polynomial Interpolating Curve Hermite procedure ... 61
Figure 3-6. ASTM D6433 Digitalized DV Curves ... 65
Figure 3-7. Regressions on 109 SU between PAVERTM PCI and calculated PCI using VBA program 71 Figure 3-8. Example of manhole distress identification guidelines, Manholes ... 73
Figure 4-1. Comparative of traffic influence on VOC ... 78
Figure 4-2. Framework of the proposed PMS ... 79
Figure 4-4. PCI condition calculated for each strategy ... 83
Figure 4-5. PCI section rating for each strategy at the considered period of study ... 85
Figure 4-6. Diagrams to evaluate the effect of roughness on VOC ... 87
Figure 4-7. Vehicle Operating Costs calculated for each strategy. ... 88
Figure 5-1. VDOT web-based comprehensive PMS database ... 92
Figure 5-2. Algorithm GPS procedure LRS implementation through GPS data ... 95
Figure 5-3. Results of the application of GPS matching procedure for the implementation of LRS .... 95
Figure 5-4. Algorithm Data Integration between tables within a PMS ... 96
Figure 5-5. LRS data integration algorithm; get the nearest milepost ... 98
Figure 5-6. Data Processing Analysis: Typical Pavement Performance Situations ... 99
Figure 5-7. Use of Geographical Information Systems to support pavement decision-making at the network level ... 101
Figure 5-8. Web-based API interface uploaded online to present the results of the study ... 102
Figure 6-1. Pavement Survey Equipment ... 107
Figure 6-2. Accumulated Difference Centered Deflection along road chainage. ... 111
Figure 6-3. Pavement Condition Rating obtained from Survey along road chainage. ... 112
Figure 6-4. Pavement Condition Rating and required overlay for Homogeneous Sections along Road Chainage. ... 114
Figure 7-1. Pavement CCI as function of pavement age of Interstate Network ... 120
Figure 7-2. Pavement CCI as function of pavement age of Primary Network ... 120
Figure 7-3. Pavement CCI as function of pavement age of Secondary Network ... 121
Figure 7-4. Distribution of Pavement Deterioration (DI) of the Interstate Network ... 122
Figure 7-5. Distribution of Pavement Deterioration (DI) of the Primary Network ... 122
Figure 7-6. Distribution of Pavement Deterioration (DI) of the Secondary Network ... 123
Figure 7-7. Empirical Distribution of pavement CCI and Negative Binomial Distribution fit along Pavement age for the Interstate System ... 124
Figure 7-8. Empirical Distribution of pavement CCI and Negative Binomial Distribution fit along Pavement age for the Primary System ... 124
Figure 7-9. Empirical Distribution of pavement CCI and Negative Binomial Distribution fit along Pavement age for the Secondary System ... 125
Figure 7-10. Example of application of the Empirical Bayesian Approach ... 128
Figure 7-11. Error in estimating the Pavement Condition with the EB Method as a Function of Estimated Error Variance ... 129
Figure 7-12. Comparison between CCI deterioration curves using Virginia DOT default models and Negative Binomial Regression model for the Interstate System ... 131
Figure 7-13. Comparison between CCI deterioration curves using Virginia DOT default models and Negative Binomial Regression model for the Primary System ... 131
Figure 7-14. Comparison between CCI deterioration curves using Virginia DOT default models and Negative Binomial Regression model for the Secondary System ... 132
Figure 7-15. Illustration of the Approaches to Calculate the Estimate of Future Pavement Condition ... 134
Figure 7-16. Color Map Plot of the Interstate Network Pavement Family; a) Raw observed pavement
condition data; b) Pavement condition modeled using the LEB approach ... 136
Figure 7-17. Color Map Plot of the Primary Network Pavement Family; a) Raw observed pavement condition data; b) Pavement condition modeled using the LEB approach ... 136
Figure 7-18. Color Map Plot of the Secondary Network Pavement Family; a) Raw observed pavement condition data; b) Pavement condition modeled using the LEB approach ... 136
Figure 8-1. Pavement Maintenance Treatment Effectiveness Calculation ... 141
Figure 8-2. Preventive Maintenance Post-Treatment Performance Model for Primary System. ... 143
Figure 8-3. Corrective Maintenance Post-Treatment Performance Model for Primary System. ... 143
Figure 8-4. Restorative Maintenance Post-Treatment Performance Model for Primary System. ... 143
Figure 8-5. Reconstruction Maintenance Post-Treatment Performance Model for Primary System. . 144
Figure 8-6. Post-Treatment Performance Curves Comparison ... 144
Figure 8-7. Enhanced Post-Treatment Piecewise Performance models ... 146
Figure 8-8. Enhanced Post-Treatment Corrective Maintenance Performance Model ... 147
Figure 8-9. Enhanced Post-Treatment Restorative Maintenance Performance Models ... 147
Figure 8-10. Enhanced Post-Treatment Reconstruction Performance Model ... 148
Figure 8-11. Pavement Preservation Policies (age, CCI) before M, R&R treatment (a) Marginal Histogram and (b) Boxplot ... 149
Figure 8-12. Pavement Condition CCI Empirical Distributions Before and After the Application of Maintenance Treatments for VDOT Primary System ... 150
Figure 8-13. Boxplot of Performance Jump by VDOT on the Primary System ... 150
Figure 8-14. Pavement Treatment Service Life for VDOT Primary System ... 151
Figure 8-15. Computation of Benefit Area and Do-Nothing Area of Preventive Maintenance Project ... 152
Figure 8-16. Computation of Benefit Area and Do-Nothing Area of Corrective Maintenance Project ... 152
Figure 8-17. Computation of Benefit Area and Do-Nothing Area of Restorative Maintenance Project ... 153
Figure 8-18. Computation of Benefit Area and Do-Nothing Area of Reconstruction Project ... 153
List of Tables
Table 2-1. Classification of Information Quality and Detail ... 10
Table 2-2. Summary of Data Collection Methodologies ... 12
Table 2-3. Classification Longitudinal Profile measurement devices ... 13
Table 2-4. Proposed ranges of structural parameters for flexible pavements (adapted from Rada, Nazarian et al. (2016)). ... 27
Table 2-5. SN required values as a function of Mr and ESAL categories (after Zhang, Manuel et al. (2003)) ... 32
Table 2-6. SSI Thresholds for Indiana Pavements (after Flora (2009)) ... 33
Table 2-7. American Society for Testing and Materials (ASTM) D6433 distress identification catalog asphalt concrete list of distresses. ... 36
Table 2-8. VDOT CCI Flexible Pavement Distresses (after McGhee (2002))... 38
Table 2-9. Roughness Condition Indicator, RCI (after FHWA (2009)) ... 39
Table 2-10. Single Distress Indicator Formulas, SCR (after FHWA (2009)) ... 39
Table 2-11. PASER Rating Scale Categories and Methodologies (after Walker, Entine et al. (2002) . 40 Table 2-12. Highway vs. Urban Network Configurations ... 42
Table 2-13. Urban Pavement Distresses considered Chilean Urban Pavement Condition Index (after Osorio, Chamorro et al. (2014)) ... 43
Table 3-1. Distress Distribution Analysis on Case of Study Urban Network ... 57
Table 3-2. Road pavement distress distribution by PCI condition in Urban Areas ... 59
Table 3-3. New distress identification catalogue asphalt concrete pavement for urban areas ... 67
Table 3-4. Severity levels definitions for urban pavement distresses identification catalogue (after Loprencipe and Pantuso (2017)) ... 69
Table 3-5. Statistical parameters of automated procedure PCI calculation (ANOVA F-test) ... 71
Table 3-6. Regression coefficient of the automated procedure for PCI calculation ... 72
Table 3-7. Comparative analysis between ASTM D6433 and New Distress Identification Manual for Urban Pavements: N_11 Manholes ... 74
Table 3-8. Comparative analysis between ASTM D6433 and New Distress Identification Manual for Urban Pavements: N_12 Tree roots ... 74
Table 4-1. Type of M, R & R minor and major treatments ... 81
Table 4-2. M, R&R strategies at the Project Level for Strategies 3, 4 and 5. ... 84
Table 4-3. Traffic distribution in network’s sections ... 87
Table 4-4. Vehicle Operating Costs calculated for each strategy. ... 88
Table 5-1. Sample data GPS stations from survey vehicle ... 94
Table 5-2. Example output LRS implementation table ... 95
Table 5-3. Pavement condition and pavement inventory datasets ... 96
Table 6-1. Correspondence between IRI and RCI rating scale ... 108
Table 6-2. ESAL per vehicle category group Kazakhstan full traffic spectrum ... 108
Table 6-3. Pavement Maintenance Activities under Different Categories ... 113
Table 6-4. Maintenance Decisions for the homogeneous sections along road chainage ... 114
Table 7-1. Sample Size of Pavement Families included in the study ... 121
Table 7-2. Descriptive Statistics and χ2 – test of Negative Binomial Distribution Fitting ... 125
Table 7-3. Goodness of fit pavement deterioration models for the defined pavement families ... 130
Table 7-4. Mean Square Error of prediction of the Estimate of Pavement Condition using different approaches ... 134
Table 8-1. Virginia Pavement Maintenance Central Office Cost Estimate (Wu, Flintsch et al. 2008) and CCI triggers for Maintenance Treatments (de León Izeppi, Morrison et al. 2015) ... 139
Table 8-2. Pavement sections used in this study ... 142
Table 8-3. Post-treatment performance models for VDOT representative preservation maintenance strategies ... 142
Table 8-4. Enhanced Piecewise Post-Treatment Performance Models Parameters ... 147
Table 8-5. Average, 25th Percentile, and 75th Percentile of CCI after, CCI before, CCI PJ ... 150
Table 8-6. Average, 25th Percentile, and 75th Percentile of Service Life After Maintenance Treatments ... 151
List of Acronyms
AASHTO American Association of State Highway and Transportation Officials AADT Annual Average Daily Traffic
ANAS Ente Nazionale per le Strade ARAN Automatic Road Analyzer
ASTM American Society for Testing and Materials BPN British Pendulum Number
CCD Continuous Deflection Devices CCI Critical Condition Index
CM Corrective Maintenance Treatment CDF Cummulative Distribution Function CDV Corrected Deduct Value
CSTI Center for Sustainable Transportation Infrastructure DBMS Database Management Systems
DCP Dynamic Cone Penetrometer DI Deterioration Index
DoD United States Department of Defence DOT Department of Transportation DV Deduct Value
EB Empirical Bayes
ESAL Equivalent Standard Axle Load Applications ETD Estimated Profile Depth
FHWA Federal Highway Administration FN Friction Number
FWD Falling Weight Deflectometer GIS Geographical Information Systems GLM Generalized Linear Model
GPR Ground Penetration Radar GPS Geographical Positioning Systems HPMS Highway Performance Monitoring System HIS Interstate Highway System
IFI International Friction Index IQL Information Quality Levels IRI International Roughness Index LCCA Life-Cycle Cost Analysis LDR Load Related Distress Index LEB Linear Empirical Bayes LRS Linear Referencing Systems LCMS 3D Laser Measuring Systems
LTPP Long-Term Pavement Performance Studies MAP-21 Moving Across Progress -21
MFV Multi-Functional Vehicle MPD Mean Profile Depth
M, R&R Maintenance, Repair and Rehabilitation MR Resilient Modulus
MSI Modified Structural Index MTD Mean Texture Depth NB Negative Binomial
NCHRP National Cooperative Highway Research Program NDE Non-Destructive Evaluation
NDR Non-Load Related Distress Index NHS US National Highway System NPS National Park Services OPI Overall Pavement Index
PASER Pavement Surface Evaluation and Rating Methodology PBM Performance-based Road Maintenance Contracts PCI Pavement Condition Index
PCR Pavement Condition Rating PJ Performance Jump
PM Preventive Maintenance Treatment PMS Pavement Management Systems PSI Present Serviceability Index
QA/QC Quality Assurance and Quality Control RAMS Road Assessment Management Systems RB Rehabilitation Maintenance Treatment RC Reconstruction Treatment
RCI Roughness Condition Indicator RL Remaining Life
RM Restorative Maintenance Treatment RMSE Root Mean Square Error
RTRRMS Response-Type Road Roughness Measuring Systems RWD Rolling Wheel Deflectometer
SCI Structural Capacity Index SCR Surface Condition Rating
SCRIM Sideway-Force-Coefficient Routine Investigation Machine SFC Sideway-Force Coefficient
SNeff Effective Structural Number SNreq Required Structural Number SS Sum of Squares
SSE Residual Sum of Squares SSI Structural Strength Index SU Sample Unit
TAM Transportation Asset Management TPM Transition Probability Matrices TSD Traffic Speed Deflectometer USACE U.S. Army Corps of Engineers
USDOT United States Department of Transportation VBA Visual Basic For Applications
VDOT Virginia Department of Transportation VOC Vehicle Operating Costs
CHAPTER 1.INTRODUCTION, OBJECTIVE AND BACKGROUND 1. INTRODUCTION, OBJECTIVE AND BACKGROUND
1.1 INTRODUCTION
Pavements are one of major asset of roadway infrastructure. Design maintenance and rehabilitation strategies to achieve and maintain an acceptable level of service of roadway pavements is a difficult challenge for pavement managers. Since the 1970s, state highway agencies in the United States and Canada have been applying the Pavement Management Systems (PMS) to manage their assets. Since then PMSs have evolved to be reliable tools for the effective management of interurban pavement networks and their use has been spreading worldwide.
But recently, due to the growing travel demand and the public’s expectations for safety, ride quality, and traffic flow, highway agencies are redefining their objectives to focus on activities and strategies to preserve and maintain existing highway systems, instead of on the typical strategy of fixing the “worst first”. This requires a change of the maintenance approach which have to be focused on preservation without exceeding budgetary limits and change the current reactive maintenance phylosophy to proactive maintenance. The proactive approach (pavement preservation) cuts the need for costly, time-consuming rehabilitation and reconstruction projects. Besides, it reduces associated traffic disruptions and, as a result, the public is seeing improved mobility, reduced congestion, and safer, longer lasting pavements.
The pavement management process provides a systematic and consistent method for the selection of maintenance and repair needs by evaluating the pavement performance at the network level.“The experience with pavement preservation in some States demonstrates this success: each dollar spent now on pavement preservation could save up to six dollars in the future” (ODoherty 2007)
The pavement preservation approach aims to extend a pavement’s service life by applying a series of low-cost preventive maintenance treatments. This approach closes the gap between pavement condition and users’ expectations introducing performance measures over time in the decision-making process. Therefore, a supporting tool is required to help managers to choose the right maintenance policies to achieve the desired levels of service respecting budget limits. PMSs are potentially a useful tool to reach these goals. However, there are still challenges in their implementation.
In the European scene, the main problems related with the use of PMSs are their low level of implementation in European road agencies, and the lack of a culture of infrastructure
maintenance; as only recently, sustainable transportation infrastructure models and policies are being developed in Europe.
Nevertheless, data collection activities are one of the key aspects of the pavement management process (Flintsch, Dymond et al. 2004), and to be effective they should be correctly integrated in a PMS. Data collected include road inventory, pavement structural and functional conditions, traffic, and maintenance and rehabilitation history. An adequate PMS should incorporate a set of tools able to provide a network-level inventory of pavement surface distress and conditions and network management tools, including the prediction of pavement condition, budget planning, inspection scheduling and economic analysis, for determining the most cost-effective maintenance and repair strategy considering the Life-Cycle Cost Analysis (LCCA) (Loprencipe and Pantuso 2017).
This dissertation assembles applications and stand-alone analysis tools studied during the Ph.D. providing knowledge for filling the gap between PMS collected information (input) and cost-effective PMS implementations (actions).
1.2 PROBLEM DEFINITION AND RESEARCH APPROACH (PROBLEM STATEMENT)
The discussion presented in the introduction of the dissertation outlines the main research topics studied during the Ph.D. presenting the limitations of the current-state-of-art which can be summarized as follows:
- There is an extensive number of studies and applications of highway state systems PMS developed by highway agencies in the USA. Most of these systems focus their effort on pavement distress identification guidelines, but still, there are limited applications in the European road agencies and, especially, they are even more limited on urban road agencies.
- Road agencies collect a large amount of pavement condition data through inspections performed along with their network. Pavement data comes from a large variety of sources, spatial integration tools are needed to provide consistency between the geographical positions of survey data and the road network inventory to effectively integrate them on a road agency PMS database.
- Because of uncertainties in the data collection methods and interpretation, and the inherent variability of individual sections, the pavement recorded condition can have a very high variance. Therefore, quality data investigation such as data mining and filtering criteria are needed to address the high variance of pavement data.
- Modeling the pavement deterioration process is essential for a successful PMS able to serve to road agencies in maintaining the managed network into a high level of service.
To achieve this goal, managers need accurate pavement deterioration models able to deal with the uncertainty of pavement condition data with the objective to achieve a more accurate estimate of pavement condition over time.
- Despite the advances in information technologies, there are still difficulties in integrating together the existing database and individual information management systems. Therefore, there is a need to develop guidelines for the implementation of the performance-based decision-making process including multiple variables and criteria at the network level, such as the pavement structural condition, repair and maintenance standards and benefits of pavement preservations.
1.3 RESEARCH OBJECTIVE
The objective of this dissertation is to provide guidelines for cost-effective pavement management implementations. Multiple research topics regarding PMS applications were studied during the Ph.D. Several methodologies covering key aspects in the implementation of pavement management solutions were developed as a kind of umbrella that would be useful to support managers efforts in applying pavement management solutions at the network level.
1.4 RESULTS AND SIGNIFICANCE
This dissertation proposes the development of a comprehensive set of tools to design and implement cost-effective pavement management strategies at the network level. Because of collaborations with road agencies transportation agencies worldwide, specific methodologies had been developed using real pavement condition data integrated into PMSs with different levels of implementation.
It is expected that the resulting methodology of this research will constitute a reliable tool to support agencies in their effort to implement PMS effective strategies in the European scene where there are still many shortcomings for their effective use.
1.5 DISSERTATION ORGANIZATION
The scope of the Ph.D. research widened the effective road pavement management for urban roads networks and interurban highway networks. The limitations of the state of the art and the opportunities for improvement are defined by the characteristics of both systems (see § Literature review 2.3.6), that delimitated the approaches and methodologies developed.
In particular, Ph.D. research activities were developed in three sequential steps:1) perform a wide literature review to provide background to identify the challenges for PMS effective implementation; 2) analyze the opportunities for the development of methodologies and applications for networks in European urban systems (small-mid size networks); 3) expand the
range of the research to the international/worldwide context characterized by mature PMS implementations in highway networks (high size networks), different analysis tools, and procurement and funding sources to gain knowledge for making an effective contribute into the European scene. Accordingly, the dissertation document is organized in the following chapters: 1. Introduction, Objective and background: In this first chapter, the background of the PMS implementation is presented. Furthermore, the problem definition and research approach, the research objectives and dissertation organization were described thoroughly.
2. Literature Review: This chapter presents the current state-of-the-art and practice. It includes a review of the PMS components, overall pavement condition indexes and data collection considerations; survey manual, semi-automatic, and automatic data methodologies; data filtering and cleaning procedures; pavement deterioration models; road agencies maintenance preservation strategies; and pavement data management issues are presented.
3. Pavement Distress Identification Guidelines and Condition Assessment in Urban Areas. This Chapter presents the results of a case of study for the development of a specified procedure for the assessment of pavement functional condition in Urban Areas. As a result, a methodology to include new distress definitions were developed to achieve a new distress identification manual and a customized pavement condition index for urban road pavements.
4. Pavement Management System Considering the Vehicle Operating Costs: A Case of Study in Urban Areas. This Chapter presents the results of a case study in which the candidate developed a PMS prototype for an Italian municipality using the PCI method considering the Vehicle Operating Costs (VOC) to perform priority analysis. This research includes the creation of database inventory (gathering and organizing pavement data provided by municipality staff) and pavement condition through a PCI inspection performed in the network. One of the results of this research was to give pavement managers affordable and flexible PMS tools to compare maintenance strategies with minimum costs of implementation.
5. Pavement Management Data Strategies: Guidelines to Enhance Data Processing and Interpretation. This Chapter presents a general overview of pavement management data processing strategies and specific analysis tools developed during the Ph.D. and provides knowledge in the processing of data collection data within extensive roadway networks involving spatial referencing tools and guidelines to get information from the data to support PMS implementations.
6. Analysis of Pavement Condition Survey Data for Effective Implementation of a Network Level Pavement Management Program For a Developing Country. This Chapter presents the result of completed research for the development of a methodology to analyze survey data for the implementation of network level pavement management program for the national highway system of a developing country. This Chapter adds to the state of knowledge a methodology that can be used to design mid-term maintenance strategies to support strategic investment in developing countries funding by International long-term lending institution.
7. Development of Pavement deterioration curves of flexible pavements using the Linear Empirical Bayesian Approach at the Network Level. This Chapter presents the results of a research performed during the stay of the candidate as a Visiting Scholar at the Center for Sustainable Transportation Infrastructure (CSTI) at Virginia Tech Transportation Institute (VTTI). This part of the Ph.D. research provides an innovative approach to model pavement deterioration at the network level accounting for the variance and uncertainties related with data collection using the Linear Empirical Bayesian (LEB) approach.
8. Design Pavement Management Strategies: Performance Assessment for Network Level Pavement Preservation. This Chapter reviews pavement preservation policies along time-series applied by Virginia DOT agency to evaluate the cost-effectiveness of maintenance treatments.
9. Conclusions, recommendations and Future Research. This Chapter overviews the main findings and presents the conclusions and recommendations of the dissertation to assist agencies in the implementation of Pavement Management Systems strategies focusing on the data collection and data processing.
a. Main Contribution of the Research
b. Recommendations
c. Future Research and Developments
Appendix A. Distress Identification Manual for Urban Road Pavements. Appendix B. Software calculation PCI documentation.
Appendix C. Code used in Chapter 6. Appendix D. Code used in Chapter 7. Appendix E. Empirical Bayes Application.
CHAPTER 2.LITERATURE REVIEW 2. LITERATURE REVIEW
Highway agencies have started to go through the benefits of having a decision support system that assists them in finding cost-effective strategies for their pavement management program (Flintsch, Dymond et al. 2004). For this, PMSs have been extensively used as standard tools in most highway state agencies in the USA (Zimmerman 2017).
A comprehensive literature review was conducted to provide background and knowledge about the current state of the practice with a focus on main aspects influencing pavement management decisions, such as (1) Pavement Management Systems, (2) Data Inventory/collection techniques, (3) Pavement Condition Assessment, (4) Pavement structural evaluation and indicators of remaining pavement life, (5) Pavement deterioration models, (6) Pavement Preservation Strategies, and (7) Pavement Data Management Issues: considerations at the network level.
2.1 PAVEMENT MANAGEMENT SYSTEMS
Transportation asset management (TAM) practices are looking to optimize the performance and cost-effective of transportation facilities with the aim of maintaining a high level of service and get the best value of an investment with a limited budget. Pavements are one of the primary assets of transportation systems, so pavement management is a key business process within pavement road agencies. A PMS includes several steps: pavement distress survey, pavement evaluation, Life-Cycle Cost Analysis (LCCA) and, finally, the definition of maintenance strategies (Moretti, Di Mascio et al. 2013, Moretti 2014, Moretti, Cantisani et al. 2016, Bonin, Folino et al. 2017, Moretti, Cantisani et al. 2017, Moretti, Mandrone et al. 2017). A proper definition of PMS allows the reduction of overall road costs (construction and maintenance) as well as traffic disruptions.
Therefore, PMSs should include reliable and sufficient data and tools that can help managers to visualize and govern the use of pavement data and evaluate the impact of the possible solutions considered (Flintsch and McGhee 2009).
PMS have demonstrated to be a reliable tool to help road agencies in the decision-making process providing a systematic and consistent method for selecting Maintenance, Repair and Rehabilitation (M, R&R) needs, determining priorities and the optimal time for repair by predicting the future pavement condition (Tavakoli, Lapin et al. 1992, Shahin 2005, Han and Kobayashi 2013).
From its first applications, the main objective of PMSs was to provide an indicator of the present pavement condition regarding the integrity and surface operational condition, as well as a warning system for the early identification or projection of significant repair needs’.. Shahin (2005) settled the basis of the importance of the optimal timing in the selection of M, R&R (interventions at early stages of deterioration will save a 50 % of repair costs). Figure 2-1 illustrated the consequences of poor maintenance timing of M, R&R.
Figure 2-1. Pavement Life Cycle: Consequences of Poor Maintenance Timing (after Shahin (2005))
In the literature available, there are a high level of understanding about different PMS level of analysis and details that can be distinguished as strategic level, network level, and project level. Therefore, PMS methodologies and tools are used to support decisions based on those levels of analysis. They can be defined as:
1. The Strategic analysis is done on the entire road network for long-term budget planning to optimize the maintenance strategies across different networks based on pavement performance.
2. Network-level analysis tools support planning and programming decisions. This kind of analysis considers the entire network for inspecting, planning, budgeting, scheduling and selection of M, R&R works.
3. Project-level analysis. Singular projects/works are considered in more detail for the selection of alternatives/final project considering the in-site specific conditions. In particular, it involves pavement type selection, LCCA, pavement analysis and structural design.
Accordingly, the structure of the PMS implemented in each agency would vary depending on the type of analysis and the intended use of the data. In general, PMS components are depicted in Figure 2-2 and are composed of different modules/standalone tools developed for different purposes which are interrelated between them.
However, pavement data involves a high variety of data sources such as inventory data, traffic, structural condition, pavement condition, and M, R&R events. Therefore, their cost-effective use requires databases to support pavement management, that may range from spreadsheets and tabular data (appropriate for small – mid-size agencies) to comprehensive and well-structured database with specific retrieval procedures integrated on it (appropiate for big size agencies). The evolution and level of use of supporting databases would depend on multiple factors related to the network extension, survey collection methodologies available, software used, and previous staff experience in the use of PMS. Nevertheless, PMS implementations support different types of analyses through the data, analysis, and reporting components.
Figure 2-2. Components of pavement management systems (after (AASHTO 2012))
2.2 PAVEMENT CONDITION DATA COLLECTION
As introduced before, PMSs are defined regarding the use of the data and the level of decisions being supported, so pavement agency data collection practices should be designed according to the final use of collected data. However, PMS data collection requirements can be very costly for the agency. For this reason, agencies should design their data collection practices to collect only the data that they need (Bennett, De Solminihac et al. 2006).
Paterson and Scullion (1990) introduced the concept “Information Quality Levels” (IQL) for road management to assess the data collection practices and use. IQL methodology provides an objective reference to help agencies in making appropriate choices about the information needed for decision making, and the appropriate methods for collecting and processing it. Following this guide, the information can be classified into 4 levels of quality and detail (Table 2-1).
Bennett and Paterson (2003) defined this approach for the development and calibration of the HDM-4 system, and it became known and used worldwide, ranged from level IQL-5 (high level data) appropriate for executive decision making to very detailed and project detail of data - IQL-1 (low-level data). Pavement performance measurements at the network level can be associated with the level IQL-3, see Figure 2-3.
Table 2-1. Classification of Information Quality and Detail IQL
Level Amount of Detail
1
Most comprehensive level of detail, such as that which would be used as a reference benchmark for other measurement methods or in fundamental research. Would also be used in detailed field investigations for an indepth diagnosis of problems and for high-class project design. Normally used at project level in special cases; unlikely to be used for network monitoring. Requires high-level skill and institutional resources to support and utilize collection methods.
2
A level of detail sufficient for comprehensive programming models and for standard design methods. For planning, would be used only on sample coverage. Sufficient to distinguish the performance and economic returns of different technical options with practical differences in dimensions or materials. Standard acquisition methods for project level data collection. Would usually require automated acquisition methods for network surveys and use for network level programming. Requires reliable institutional support and resources.
3
Sufficient detail for planning models and standard programming models for full network coverage. For project design, it would suit elementary methods such as catalog type with manager data needs and low-volume road/bridge design methods. Can be collected in network surveys by semi-automated methods or combined automated and manual methods.
4
The basic summary statistics of inventory, performance, and utilization that are of interest to providers and users. Suitable for the simplest planning and programming models, but for projects is suitable only for standardized designs of very low-volume roads. The simplest, most basic collection methods, either entirely manual or entirely semiautomated, provide direct but approximate measures and suit small or resource– poor agencies. Alternatively, the statistics may be computed from more detailed data.
Source: Paterson and Scullion (1990)
Data quality and data collection methodologies depend on the type of analysis to be performed:
• Network-level data collection includes large quantities of pavement condition data, affected by the high variance of data. It is composed by data belonging of different sources with different levels of detail. These levels of detail should be able to have a level of detail sufficient to distinguish the performance and economic returns of different M, R&R covering the entire network, (sample coverage and inventory). Network-level data collection survey requires automated pavement condition acquisition methods and windshield surveys at highway speed to minimize traffic disruptions.
• Project-level requires a more comprehensive level of detail, and specific inspection data which are typically collected using semi-automated or even manually. These techniques involve data collection of structural condition, friction data, and specific measures of distress quantity and severity, even from data collection methodologies based on walking surveys. This detailed information would be used to support the decision-making process about pavement preservation and repair treatments including the design of pavement treatment and the estimation the project level cost estimate.
The collected data have itself a significant impact both on the level of investment and on the choice of M, R&R treatments. Therefore, they must be reliable (Pierce, McGovern et al. 2013). Besides, data collection methodologies can be very expensive and can have a high impact on the usability of data and quality of data. Therefore, the definition of adequate data collection campaigns and the use of the stored data are essential for a cost-effective PMS. Pavement data collection methodologies should fit the agency required use of the data and data collection equipment available (Flintsch and McGhee 2009).
Table 2-2 aims to summarize data collection methodologies currently in use in the state-of-art and would serve as a guide for the entire chapter. The characteristics of data collection methodologies and pavement agencies use of data have been analyzed. A comprehensive review of pavement condition indicators and pavement performance issues have been performed, focusing the study on the identification of pavement surface distresses and agency data processing at the network level.
Table 2-2. Summary of Data Collection Methodologies Pavement Survey Type Pavement Characteristic observed Equipment used Most common Pavement Condition Indicators Profiling Evenness Longitudinal Profile/Smoothness
ASTM Class I precision profilers:
Manually operated profilers Walking Dipstick
ASTM Class II: Non-contact Laser Profilers
ASTM Class III: Response-Type Road Roughness Measuring Systems (RTRRMS), accelerometers International Roughness Index (IRI) Evenness Transverse Profile/Rutting
Profilometers: Laser Rut Depth Measurement - Non-contact sensors Straight Edge Rut-Depth Static Measurement and Dynamic Measurements of Pavement Surface Characteristics Vehicle Road Interaction Surface Characteristics: Surface texture (macrotexture and microtexture) Skid resistance Surface texture:
Static: Volumetric patch/sand patch method, Circular Track (CT) meter and imaging technologies used to assess road surface texture
Dynamic Measurements: profilometer method and WDM High-Speed Texture System. Skid Resistance: Dynamic Measurements (GripTester – Trailer system locked/partially locked wheel and Scrim- Vehicle mounted system) and Static Measurements (British Pendulum Tester)
Mean Profile Depth (MPD), Estimated Profile Depth (ETD)
Friction Number (FN) or Skid Number (SN), British Pendulum Number (BPN) and International Friction Index (IFI) Manual Data Collection: Visual Survey and/or Windshield Pavement Survey. Automated Data Collection using imaging technologies and/or other sensor equipment.
Surface Distresses
Walking metric ruler, straightedge
Distress Identification manual and paper forms; manual or computerized (Tablet, Smartphone)
3D Laser Measuring Systems (LCMS) and digital Processing of pavement images
Pavement Condition Index (PCI), Critical Condition Index (CCI),
Pavement Condition Rating (PCR), Overall Pavement Index (OPI),
Pavement Structural
Evaluation Structural Capacity
Non-Destructive Evaluation (NDE): Falling Weight Deflectometer (FWD), Rolling Wheel Deflectometer (RWD), Traffic Speed Deflectometer (TSD), Ground Penetration Radar (GPR).
Destructive Evaluation: Pavement Coring/Boring, Dynamic Cone Penetrometer (DCP)
Deflections, Resilient Modulus, Structural Condition Index (SCI), Structural Number (SN)
2.2.1 ROUGHNESS /LONGITUDINAL PROFILE
According to ASTM E867-06 (ASTM 2012), pavement roughness can be defined as “the deviation of a pavement surface from a true planar surface with characteristic dimensions that affect vehicle dynamics, ride quality, dynamic loads and pavement drainage. (Sayers and Karamihas 1998)”
Table 2-3. Classification Longitudinal Profile measurement devices
Equipment Class Longitudinal Sampling
Vertical Measurements Resolution
Precision (1 SD) Bias
Class I less than or equal to
25 mm (1 in.)
less than or equal to
0.1 mm (0.005 in.) 0.38 mm (0.015 in.)
1.25 mm (0.050 in.)
Class II greater than 25 mm
(1 in.) to 150 mm (6 in.) greater than 0.1 mm (0.005 in.) to 0.2 mm (0.010 in.) 0.76 mm (0.030 in.) 2.50 mm (0.100 in.)
Class III greater than 150 mm
(6 in.) to 300 mm (12 in.) greater than 0.2 mm (0.010 in.) to 0.5 mm (0.020 in.) 2.50 mm (0.100 in.) 6.25 mm (0.250 in.)
Class IV greater than 300 mm
(12 in.)
greater than 0.5 mm (0.020 in.)
Pavement roughness measuring devices can be classified by the ASTM (2018) E 950-94 (Table 2-3) in different groups according to their accuracy and methodology to calculate the pavement roughness:
- Class I profilometers measure the true profile or absolute profile. Dipstick Road Profiler (ASTM 2015), contact device that is operated manually walking along the pavement section, belongs to this group. Dipstick data collection operation was developed by Long-Term Pavement Performance Studies (LTPP) in the USA (Perera, Kohn et al. 2008). The Dipstick succeeds in measuring the highest wavelengths of the road and in the detection of the longitudinal and / or transversal slope of the road. Class I Dipstick profile measurements are affected by low speed of measurements (150 m/h), traffic disruption and operator safety hazards because should be operated manually walking along the surface.
- Class II profilometers consider the dynamic profile. These measuring methods can determine profile elevations by summarizing statistics calculated from elevation data. This kind of profilometers can measure the relative profile and requires the calibration with Class I profilometer. Class II non-contact laser profilers are usually mounted on vehicles able to measure the distance between the road surface and a reference on the vehicle, coupled with an accelerometer to correct the profile for the inertial movement of the vehicle. Therefore, the measurement results are independent of the dynamics of the measuring vehicle, and can be measured at higher speed (30-40 km/h), minimizing
the traffic disruption and operator safety hazards. The difference between the true profile and the related profile consists, as mentioned previously, in the ability or otherwise of the profilometer used for the measurement of keeping an absolute reference to the planar surface. Therefore, in the case of use of a Class II instrumentation, it is not possible to detect the highest wavelengths.
- Class III equipments include mechanical or electronic devices that indirectly evaluate pavement profiles; these are usually denominated Response-Type Road Roughness Measuring Systems (RTRRMS). The most common of these are vertical acceleration profile accelerometers. Measures obtained using these devices require calibration though correlations with standardized roughness thresholds (Cantisani and Loprencipe 2010, Loprencipe and Zoccali 2017, Loprencipe and Zoccali 2017).
- Class IV is the least accurate of them, and the roughness profile is calculated based on subjective evaluation produced by traveling along the pavement section or conducting a visual inspection.
The most worldwide used index for the measurement of road roughness is the International Roughness Index (IRI), presented by the World Bank (Hall, Smith et al. 2009). IRI is a standardized calculated response of a mathematical model of a quarter of a passenger car or full car (Figure 2-4) driving over a longitudinal profile, the mechanical parameters of the mathematical model have been standardized by the ASTM E1926-08 (ASTM 2015) . IRI is calculated as the cumulated vertical suspension movement divided by the distance travelled, and it is expressed in m/km or in/mi.
Figure 2-4. Quarter-car model for the calculation of the IRI (after Cantisani and Loprencipe (2010))
Although IRI is the most used worldwide pavement roughness index, there are not fully understanding about the limit of applicability of IRI worldwide, and there is different threshold of acceptability varying significantly from one country to another. There is still work to be done to improve the measurement accuracy and repeatability.
For this purpose, Federal Highway Administration (FHWA) promoted the development of the Long-Term Pavement Performance Studies (LTPP) which constitutes a large research program that includes several specific pavements related researches that are critical to pavement performance. LTPP program consisted on the collection and maintenance of pavement information database of more of 2500 sections located on in-service highways throughout USA. The objective of this research project was to compare the results on different US State DOT agencies performance regarding pavement roughness for the calibration and repeatability analysis of current in use data collection practices. Likewise, FHWA is founding other projects involving US State DOT Agencies for the measurements of pavement surface properties that organized a yearly round-up for testing measurement equipment to evaluate the repeatability and reproducibility of these. One of these is the Pavement Surface Properties Consortium that hosts an annual event at the Virginia Smart Road at Virginia Tech Transportation Institute (VTTI) in Blacksburg, VA, USA, in order to evaluate and compare various types of highway friction and profile measuring equipment, the event is called “the Surface Properties Round up” (Figure 2-5), (Flintsch, McGhee et al. 2012).
Figure 2-5. High speed profiler participants at Surface Properties Round up (source: TPF-5(141) Final Report)
Another worldwide accepted use of the IRI is the quality control of new roads. This application is being widely used by establishing incentives or sanctions to the construction and/or motorway concession companies if they are meeting roughness IRI thresholds requirements. Nevertheless, IRI has become one of the primary indicators of pavement
performance for the Highway Performance Monitoring System (HPMS) which contains administrative and extent of system information on all public road as a result of Moving Across Progress -21 (MAP-21) act which is transforming the US Federal-aid highway program by establishing new requirements for performance management (USDOT 2017).
Figure 2-6. Proposal for new speed-related IRI thresholds, considering the aWZ limits established by technical standards (after Cantisani and Loprencipe (2010))
Recently, some researchers were working to develop correlations with IRI and acceptability limits of frequency-weighted vertical acceleration awz according to ISO 2631 (1997) using low-cost technologies (Cantisani and Loprencipe 2010).
2.2.2 TRANSVERSE PROFILE: RUTTING
The transverse evenness is a measure of the variation within a transverse profile along pavement tested. The leading indicator for express the transverse evenness is the rut depth, defined as “Maximum perpendicular distance between the bottom surface of a straightedge and the contact area of the gauge with the road surface at a specified location, usually measured in the wheel tracks.” (Puzzo, Loprencipe et al. 2017). The Rut-depth is expressed in mm or inches. Rut depth can be measured manually using a 6 ft to 12 ft (1.80 m to 3.60 m) straightedge and a gauge graduated to 1 mm (ASTM 2015). This procedure is very time consuming and, for this reason, only a small number of the section on the roadway can be evaluated. Besides, manual rut-depth measurement causes traffic disruption, and operators are exposed to hazard traffic. For this reason, many agencies in the USA use automated procedures to measure rut-depth at the network level, eliminating traffic exposure to operators, traffic disruption. As a consequence, higher number of sections are being measured in the shorter amount of time.
Automated transverse profile measurements are done by a vehicle traveling over the pavement at highway speeds, using different the measurements of sensors mounted on the
profilometric bar. According to ASTM (2013), the transverse profile “is determined on the basis of the vertical distance between an imaginary string line run across the traffic lane from the shoulder to the lane line”. Recently, pavement data collection vendors have developed technologies with high-powered pulse lasers mounted on the back of the van to project a line across the pavement providing “a lateral resolution of more than 1280 points across the width of the pavement (4 m)” at normal traffic speed.
2.2.3 VEHICLE ROAD INTERACTION SURFACE CHARACTERISTICS 2.2.3.1 SURFACE TEXTURE
Pavement surface characteristics are essential for the safety and the comfort of drivers because they affect vehicle/road interaction processes such as rolling resistance, tire friction, and pavement noise levels significantly. Pavement surfaces should provide adequate friction and maintain a good level of ride quality to ensure satisfaction of driving public (Najafi, Flintsch et al. 2017).
Pavement texture has been categorized into three categories or subgroups based on the wavelength of the irregularities: microtexture, macrotexture, and mega texture (Flintsch, McGhee et al. 2012). Wavelength greater than the upper limit of megatexture are defined as roughness, smoothness, or evenness (Cantisani, D’Andrea et al. 2016), see Figure 2-7.
Figure 2-7. Pavement Surface Characteristics Influence Wavelength (after Cantisani, D’Andrea et al. (2016))
Pavement microtexture and macrotexture affect mostly the resistance to skidding. Pavement macrotexture provides the hysteresis component of the friction and allows for the rapid drainage of water from the pavement (Hall, Smith et al. 2009). Microtexture offers direct tire-pavement contact and contributes to the adhesion component of friction (Hall, Smith et al. 2009), see Figure 2-8. Enhanced drainage improves the contact between the tire and the pavement surface helping to reduce the probability of hydroplaning (Najafi, Flintsch et al. 2017). This increased texture may sometimes increase the level of discomfort for exterior noise, vibration, fuel consumption, and tire wear. However, the decreasing of surface texture has as negative aspect the potential increase of the number of accidents due to inadequate levels of pavement friction (Flintsch, McGhee et al. 2012, Najafi, Flintsch et al. 2013, Fernandes and Neves 2014, Najafi, Flintsch et al. 2017)
Figure 2-8. Surface Texture Key mechanisms of Pavement Friction (after Hall, Smith et al. (2009))
The macrotexture of a pavement surface results from the large aggregate particles in the mixture. NCHRP synthesis (Flintsch, McGhee et al. 2012) gathered up a list of different devices for measuring pavement surface texture. Macrotexture measurements can be divided into two main classes: static analysis and dynamic measurements.
The most common static measurements is the sand patch and Circular Texture Meter. Sand patch is standardized manual method ASTM E-965 (ASTM 2015), to measure the Mean Texture Depth (MPD) consisting on pouring a known volume of sand on a cleaned road surface and
spread out to form a circular patch, the diameter of this patch is measured and the MPD is calculated using a mathematical formula, so with low-cost equipment a direct measure of surface texture is provided with good accuracy and repeatability. CTMeter (Figure 2-9a) has a laser displacement sensor mounted on a circumference with a 142-mm radius and measures the texture with a sampling interval of approximately 0.9 mm. The Dynamic Friction Tester (Figure 2-9b) consists of a horizontal spinning disk fitted with three spring loaded rubber sliders which contact the paved surface as the disk rotational speed decreases due to the friction generated between the sliders and the paved surface. A water supply unit delivers water to the paved surface being tested. The torque generated by the slider forces measured during the spin down is then used to calculate the friction as a function of speed (ASTM 2009).
(a) (b)
Figure 2-9. Paved Surface Frictional properties measurement apparatus: a) Circular Meter and b) Dynamic Friction Tester
Vehicle-mounted laser devices used to measure macrotexture without traffic disruption (dynamic measurements). ASTM standard E-1845 (ASTM 2015) provides a method to calculate the mean profile depth (MPD) of pavement texture.
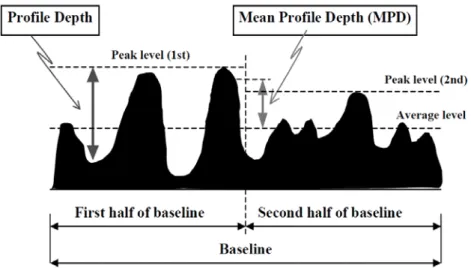
Figure 2-10. Representation of the profile characteristics for the calculation of MPD (after Flintsch, de Leon et al. (2003))
According to ASTM E-1845, the measured profile of the pavement macrotexture is divided for the analysis purposes into segments, having a base length of 100 mm. The segment is splited in half, and the highest peak in each half-segment is found. MPD is calculated as the difference between the resulting height and the average level of the segment and the average of both halves computed, see Figure 2-10. When MPD is used to estimate the Mean Texture Depth (MTD) using a transformation equation, the calculated value is called the estimated texture depth (ETD). ETD=0.2+0.8*MPD, both measures expressed in mm. Recently, some researchers have presented a method to estimate MTD measurements from digital images, taking photos from different angles of a pavement surface (Puzzo, Loprencipe et al. 2017).
2.2.3.2 SKID RESISTANCE
Surface texture influence on water drainage into the pavement-tire contact and its effect on skid resistance and partial or total hydroplaning have been discussed extensively in the literature review (Cairney 1997). In the context of roadway safety management, skid resistance measurement and assessment are essential to analyze the risk of wet crash and the potentially chances of hydroplaning (de León Izeppi, Katicha et al. 2015).
The measurement methods of skid resistance can be grouped into two categories: high-speed equipment and low high-speed or stationary equipment. The decision of which method to use may depend on the size of the network, the availability of material and the purpose of the measurement.
The most known static device for measuring skid resistance is the British Pendulum Tester, standardized by ASTM E303 (ASTM 2013). The British Pendulum test is based on the slid of a known weight pendulum over wet pavement. As a result of the energy loss caused by the arm friction with the pavement, the British Pendulum Number (BPN) is obtained. The BPN is correlated with a skid resistance coefficient. This static measurement does not require higher cost of implementation but the result accomplished can vary from the operator and operation is very slow. The high-speed pavement friction measurements can be divided into four groups: locked-wheel longitudinal friction force), fixed-slip (longitudinal friction force), sideway-force (sideway “lateral” friction factor), and variable slip (Hall, Smith et al. 2009). Most of the US DOT State agencies used the locked-wheel skid tester, standardized by ASTM E274 (ASTM 2015).
Locked-wheel devices are installed on a trailer which is towed at a typical speed of 60 km/h. A water film, typically of 0.5 mm thickness, is applied in front of the test tire during the measurement, test tire is towed if necessary and a braking system is forced to lock the tire. The resistance drag is measured and average for 1 to 3 second after the wheel is fully locked. These