Policy Research Working Paper
5780
Firm Location and the Determinants
of Exporting in Developing Countries
Thomas Farole
Deborah Winkler
The World Bank
Poverty Reduction and Economic Management Network
International Trade Department
August 2011
WPS5780
Public Disclosure Authorized
Public Disclosure Authorized
Public Disclosure Authorized
Produced by the Research Support Team
Abstract
The Policy Research Working Paper Series disseminates the findings of work in progress to encourage the exchange of ideas about development issues. An objective of the series is to get the findings out quickly, even if the presentations are less than fully polished. The papers carry the names of the authors and should be cited accordingly. The findings, interpretations, and conclusions expressed in this paper are entirely those of the authors. They do not necessarily represent the views of the International Bank for Reconstruction and Development/World Bank and its affiliated organizations, or those of the Executive Directors of the World Bank or the governments they represent.
Policy Research Working Paper 5780
Using a cross-section of more than 40,000 manufacturing and services firms in 79 developing countries from the World Bank’s Enterprise Surveys Database, this paper assesses how firm location determines the likelihood and extent of exporting in developing countries. Descriptive statistics confirm higher export participation (but not intensity) for firms in core versus non-core regions, despite the finding that firms in the core assess many aspects of the investment climate more negatively. Results from a probit model show that, in addition to firm-specific characteristics, both regional investment climate and agglomeration factors have a significant impact on export participation. Specifically, customs clearance and electricity quality matter for export participation for manufacturing firms. Although localization economies and export spillovers are
associated with increased exporting, the opposite is found
This paper is a product of the International Trade Department, Poverty Reduction and Economic Management Network. It is part of a larger effort by the World Bank to provide open access to its research and make a contribution to development policy discussions around the world. Policy Research Working Papers are also posted on the Web at http://econ.worldbank. org. The authors may be contacted at [email protected] and [email protected].
for urbanization economies for both manufacturing and services firms. The analysis finds that firm-level determinants of exporting matter more for firms located in non-core regions, while regional determinants and agglomeration economies play a larger role in core regions.
The findings point to the presence of congestion costs in the core, and suggest that policy interventions to target export participation are likely to have a greater impact if they are focused on core regions over non-core regions, where firm-specific factors predominate. Moreover, the importance of export spillovers and localization economies highlights the potential value of efforts to remove barriers to natural agglomeration both in core and non-core regions, for example through investments in infrastructure, the provision of social services, and regional integration arrangements.
1
Firm Location and the Determinants of Exporting
in Developing Countries
Thomas Farole
*and Deborah Winkler
†Key words: export, agglomeration, localization, urbanization, spillovers, location JEL: F1, F2, R1
*
Senior Trade Specialist, International Trade Department, The World Bank.
† Consultant, International Trade Department, The World Bank.
This paper is part of a wider study on the regional determinants of trade competitiveness conducted by the International Trade Department of the World Bank. The authors would like to thank Bernard Hoekman and Daniel Lederman from the International Trade Department for valuable comments and Minh Cong Nguyen, Federica Saliola, and Murat Seker from the Enterprise Analysis Unit of the World Bank for help with the data.
2
1
Theoretical Background
While there has been a fairly strong convergence in national incomes over the past 20 years, within many countries the opposite has been the case, with output and wealth increasingly being concentrated in core regions, and other areas lagging further behind. Such patterns of regional divergence can be seen across most upper and middle income and many low income economies. From a macro efficiency perspective, this is not necessarily a bad thing. Most evidence points to a positive association between the spatial concentration of economic activity and overall economic growth (Bourguignon and Morrison 2002), and innovation and agglomeration appear to be self-reinforcing processes (Feldman 1994, Verspagen, 1997).
In most countries the benefits of agglomeration are reaped by major metropolitan regions, which have the advantages of large consumer markets, deep labor pools, links to international markets, and clusters of diverse suppliers and institutions which combine to produce strong externalities (urbanization economies, or ‘Jacobs” externalities) and promote innovation. This supports internationally competitive domestic producers and creates an attractive investment environment for FDI. However, spillovers from the core, both in terms of economic multipliers and knowledge, tend to fall off sharply with distance (Audretsch and Feldman 2004; Moreno, Paci, and Usai 2005), confining most benefits to regions immediately surrounding cutting-edge metropolitan areas. On the downside, agglomerations are characterized by congestion costs, which act as centrifugal forces on a firm’s location decision (Krugman 1991).
Regions outside the core often face significant challenges to becoming competitive locations for trade and investment. Regions that are truly “lagging” – particularly those that are cursed both in terms of “distance” (remote) and “density” (sparsely populated) (World Bank 2008) –remain largely cut off from the opportunities available from integration in global markets as they lack local markets of significant size to facilitate scale economies which might condition them to compete globally; they face higher costs and time to reach export markets; they are often underserved by public goods (including both hard and soft infrastructure) which underpin competitiveness; and they tend to have less access or exposure to knowledge being produced at the technology frontier, resulting in less competitive human capital and institutions. But not all regions outside the core are prevented from sustaining exporters because of geography. In terms of first-order geography, regions with access to key trade gateway infrastructure or endowed with key resources may be in a position to take advantage of trade opportunities. Moreover, non-core regions may still benefit
3
from agglomeration in the form of localization economies – these are the (Marshallian) externalities that arise from a geographical concentration of identical or similar industries due to sharing of knowledge, specific inputs, labor pools, and technology (Malmberg, Malmberg, and Lundequist 2000, World Bank 2008).
This paper combines two strands of literature that have been particularly vibrant in recent years, namely on spatial agglomeration and on the firm-level determinants of exporting. While a large number of studies have analyzed firm-level determinants of exporting, location has typically been reduced to a control dummy (see, e.g. Aitken, Hanson, and Harrison 1997, Roberts and Tybout 1998, Clerides, Lach, and Tybout 1998, Bernard and Jensen 1999, Greenaway and Kneller 2004). Similarly, while the agglomeration literature has explored the relationship with exporting, most focus on the agglomeration–export relationship, without also taking into account how both of these are shaped by geographical location and regional characteristics (see, e.g. Aitken, Hanson, and Harrison 1997, Malmberg et al. 2000, Bernard and Jensen 2004, Lovely, Rosenthal, and Sharma 2005, Mittelstaedt, Ward, and Nowlin 2006, Greenaway and Kneller 2008, Antonietti and Cainelli 2009, Koenig 2009, Koenig, Mayneris, and Poncet 2010).
1.1
Firm-level and Regional Determinants of Exporting
In this paper, we address the following three research questions: (i) Are there significant differences in export participation and performance and in the perceived investment climate for exporting in core versus non-core regions? (ii) What is the effect of regional determinants, including the investment climate – and agglomeration economies on exporting behavior? (iii) Do the determinants of exporting have a differential effect if firms are located in core versus non-core regions?
There has been a growing body of trade literature on the determinants of exporting at the firm-level. Econometrically, exporting in such studies is modeled as a dummy variable equal to one if there is some exporting and zero otherwise. At the latest since the seminal paper by Bernard and Jensen (1995), researchers have recognized that exporters outperform non-exporters in the same sector and country in terms of skills, wages, productivity, technology and capital intensity (see literature review in Wagner 2007). Consequently, researchers started to ask whether exporters perform better because of self-selection into the exporting market and because of learning-by-exporting. Self-selection refers to ex-ante differences across firms, while learning-by-exporting refers to ex-post gains of exporters versus non-exporters. Self-selection refers to the fact that
4
exporting involves additional costs of exporting, including transportation, marketing, and distribution costs, employees with specific skills, and production costs for necessary adjustment which only more productive firms are able to absorb. Learning-by-exporting refers to knowledge flows that exporting firms absorb from international buyers and competitors which renders them more productive (Wagner 2007).
Researchers in the field of international marketing have identified several internal and external determinants that increase the probability of exporting at the firm level. Zho and Stan (1998), for instance, review 50 studies on the determinants of export performance between 1987 and 1997. In a more recent paper, Sousa, Martinez-Lopez, and Coelho (2008) review 52 studies in the international marketing literature between 1998 and 2005. Export market characteristics, domestic market characteristics, and industry characteristics were the most frequently examined external determinants. Internal determinants include controllable factors, such as export marketing strategy and management perception, and uncontrollable factors, such as management and firm characteristics.
Firm-level determinants of exporting in the international trade literature generally include firm size, firm age, productivity, ownership, worker skills, and sunk entry costs of exporting (see, e.g. Aitken et al. 1997, Roberts and Tybout 1998, Clerides et al. 1998, Bernard and Jensen 1999, Greenaway and Kneller 2004). This strand of literature typically adds regional dummies along with industry dummies to the firm-level determinants of exporting, since location might account for most of the differences between exporters and non-exporters.
While such regional dummies might indicate regional differences, they do not reveal which specific characteristics determine the propensity of exporting. From a policy perspective, identifying such regional determinants is very important, since regional characteristics influence the costs of exporting and, thus, self-selection into exporting, e.g. through the availability of skills, transport costs, infrastructure, or institutions in the region. Regional characteristics might also have an indirect effect on learning-by-exporting. The lower the regional skills level, the less likely a firm will absorb knowledge flows from international buyers and competitors. Institutions might also influence absorption capabilities of firms across regions.
While several studies have examined regional determinants of firm-level foreign direct investment (e.g. Deichmann, Karidis, and Sayek, 2003, for Turkey, and Amiti and Javorcik, 2008, for China), there are no international trade studies to our knowledge that explicitly integrate regional determinants of exporting. Note that in this study regional determinants do not refer to
5
agglomeration economies which we focus on in the next section. Even in the field of international marketing, only four out of 50 studies reviewed by Zho and Stan (1998) and only six out of 52 studies reviewed by Sousa et al. (2008) address domestic market characteristics, which are measured at the national rather than regional level. This study aims to contribute to this lack of studies by incorporating regional determinants of exporting.
1.2
Agglomeration Economies and Exporting
Our study includes three measures of regional agglomeration economies, namely (i) a region’s number of firms as percentage of a country’s total number of firms (urbanization effects), (ii) a region’s number of exporters3 as percentage of a country’s total number of exporters (export
spillovers), and (iii) a region’s number of firms within the same industry as percentage of a country’s total number of firms within the same industry (localization effects).
Agglomeration economies can have a particularly favorable influence on a firm’s propensity to export as they can reduce the sunk entry costs of exporting (Aitken et al. 1997). Agglomeration economies can lower (i) production costs through sharing of resources, mainly social and physical infrastructure, and (ii) transportation and transaction costs through increased interaction between suppliers and customers on site (Malmberg et al. 2000). Hence, an agglomeration can increase the probability of self-selection into exporting.
On the other hand, agglomerations may be characterized by congestion costs (Krugman, 1991) which can increase (i) production costs through the sharing of resources (e.g. power outages), and (ii) transportation and transaction costs through increased waiting times (e.g. for intermediate inputs or licenses). These effects can counterbalance the gains from agglomerations as described above. The net effect may therefore be ambiguous.
Studies in the field of international marketing have long acknowledged the role of agglomeration economies on exporting, and international trade studies have followed to recognize their importance. Malmberg et al. (2000) analyze the impact of localization and urbanization economies on export performance for Swedish firms in 1994. The authors find that traditional scale economies combined with urbanization economies have a much larger positive effect on export performance than localization economies. Mittelstaedt et al. (2006) confirm that urbanization and localization economies increase the probability of exporting for small manufacturing firms in the
3 Exporters include direct exporters and “indirect exporters”, defined as exporters who sell domestically to
third parties that then export the products or services without modification. Goods sold domestically as intermediates to an exported product are not considered indirect exports.
6
South-Eastern USA. In a recent study, Antonietti and Cainelli (2009) show a positive effect of local knowledge spillovers on export propensity and export share for Italian manufacturing firms between 1998 and 2003 using several measures of urbanization and localization economies.
Other studies have focused on the role of export spillovers for the likelihood of exporting. Atiken et al. (1997) find that while the presence of multinational firms in a region is beneficial for a Mexican firm’s export decision between 1986 and 1990, the proximity to other exporters in a region is not. Bernard and Jensen (2004) find that the presence of exporters (outside a firm’s industry) and the presence of exporters within the same industry (outside a firm’s region) have no impact on US manufacturing firms’ exporting behavior between 1984 and 1992. Surprisingly, the number of exporters within the same region and industry show a negative effect on a firm’s entry into exporting.
While the studies above reject the existence of positive export spillovers, other studies find evidence for a positive impact of export spillovers on exporting. Lovely et al. (2005) focus on the perspective of US firms’ headquarters in 2000. The authors find that the spatial concentration of headquarter activity of exporters relative to that of non-exporters at different regional levels rises with the industry share of exports to countries with a difficult trading environment. The explanation is that exporting requires specialized knowledge of foreign markets which contributes to a spatial concentration among exporters. Greenaway and Kneller (2008) find for a sample of manufacturing firms in the UK between 1988 and 2002 that the presence of exporters in the same region or industry is favorable for exporting. Koenig (2009) also confirms that a higher share of local exporters exporting to the same destination increases the probability of exporting for French manufacturers between 1986 and 1992, but this effect is destination-specific. Koenig et al. (2010) show evidence that the presence of local product and/or destination-specific exporters encourage the probability of exporting for French manufacturers between 1998 and 2003. However, the authors do not find export spillovers on the firms’ export volume.
1.3
The Role of Firm Location for the Determinants of Exporting
So far, our focus has been on how location characteristics (such as regional determinants and agglomeration economies) can influence export performance. Another important question is how firm location influences the determinants of exporting? In the second part of this paper, we apply regression analysis to evaluate whether firm-level and regional determinants of exporting and agglomeration economies have a differential effect if firms are located in core versus non-core
7
regions of a country. We use a cross-section of more than 40,000 manufacturing and services firms in 79 developing countries. We hypothesize that traditional firm-level characteristics matter less for firms located in core regions, since a firm’s business environment will explain a larger share of a firm’s export behavior.
This paper is structured as followed. In the next section, we compare firms located in the core with firms located in non-core regions to detect significant differences in export performance. We also analyze other performance indicators related to a firm’s business and business environment. In section three, we perform an econometric exercise where we first study the impact of firm-level and regional determinants as well as agglomeration economies on exporting. We also examine the role of location, assessing whether the determinants of exporting are different if firms are located in core versus non-core regions. Based on the results of the empirical analysis, we derive some policy conclusions in section four.
2
Descriptive Analysis: Core versus Non-core Regions
2.1
Data
The World Bank Enterprise Analysis Unit recently published the Enterprise Surveys Indicator Database.4 This publication is based on enterprise surveys for over 100 countries, over the period
2002 to 2010. Enterprise surveys represent a comprehensive source of firm-level data in emerging markets and developing economies. One major advantage of the enterprise surveys is that the survey questions are the same across all countries. Moreover, the Enterprise Surveys represent a stratified random sample of firms using three levels of stratification: sector, firm size, and region.
The Enterprise Surveys Indicator Database covers a wide range of indicators on firm characteristics and indicators of business environment, innovation and technology, workforce and skills, permits and licenses, infrastructure, finance, and corruption among others. In making use of this dataset, we apply the following rules: (i) We included only the most recent Enterprise Surveys for each country into the analysis. (ii) We dropped high-income countries to cover only emerging or
4
See http://enterprisesurveys.org/Methodology/Indicator-Descriptions.aspx for a description of the
8
developing countries.5 (iii) In order to be able to detect differences between a country’s core and its
non-core regions, we considered countries with at least three regions.6
As a second next step, we had to determine which regions to consider as core regions. We defined these as follows:
We determined a region’s relative size, defined as the number of firms in a region divided by the total number of firms in the country. This exercise is representative for each country, since Enterprise Surveys represent a stratified random sample with regard to regions. Note that this procedure includes both manufacturing and services firms. We set the core dummy CORE = 1 for the region with the largest relative size.
In some cases, the Enterprise Surveys defined regions around the country’s capital very narrowly, resulting in a relatively small relative size of such regions. In such cases we bypass the first rule and define these as core regions.
We set CORE = 0 for all other regions. The procedure above results in 79 countries covering 467 regions, 92 of which are core regions. One downside of database is that the definition of regions is not harmonized across countries. The list of countries, year of most recent survey, number of regions by country as well as the number of firms (total and for manufacturing and services firms separately) can be found in Appendix 1. Appendix 2 shows the names of the core regions for each of these countries.
2.2
Manufacturing Firms
In a next step, we calculate weighted averages of selected indicators per firm in the core and compare these averages with non-core regions. We use sampling weights as provided by the Enterprise Survey Indicator Database. We also perform a t-test which tests for the null hypothesis that there is no significant difference between the core and non-core regions for a given indicator.7
We do this separately for manufacturing and services firms. Our analysis covers 33,113 manufacturing firms which represent more than 80 percent of the overall sample (see Appendix 3).
5 We dropped these, since the database only included nine high-income countries which were not
representative of high-income countries (some OECD countries, some non-OECD countries, and one oil exporter).
6 We applied a threshold of three and not two regions, because in many countries with only two regions these
had similar relative sizes rendering the determination of core regions very difficult.
7
Since some strata only had one observation, we did not use stratification. This affects the standard errors, which in general should be larger than when the strata is specified, or in other words, this should result in a more conservative test.
9
The sectoral distribution in Appendix 3 shows that food, garments, and metals and machinery alone make up 47 percent of all manufacturing firms. On average, around 44 percent of all manufacturing firms are located in core regions as defined above. However, the extent of concentration in the core varies across the sectors. For example, over 60 percent of firms in the leather sector are located in core regions, only 30 percent for firms in the wood and furniture sector are in core regions.
Table 1 summarizes the indicators for manufacturing firms. Regarding firm characteristics, manufacturing firms in the core are on average three years older and have an average foreign ownership share of almost 8 percent, which is more than twice as high as their incumbents in non-core regions. While there seems to be no significant difference between non-core and non-non-core regions with regards to their average export shares, the percentage of manufacturing firms that export is 40 percent higher in the core. This finding is important as it suggests that the difference lies in export participation, but once the threshold of export participation is reached, there is no difference in export intensity. Other trade-related indicators show that on average firms in the core are more strongly involved in offshoring (i.e. use material inputs and/or supplies of foreign origin) and more often identify customs and trade regulations as a major constraint, but this is more likely a function of them being exporters than of their location.
Regarding technology, the percentage of manufacturing firms with internationally-recognized quality certification, that use their own website and that use email to communicate with clients and/or suppliers is between a quarter and 50 percent higher in the core. In terms of workforce, the average share of skilled production workers in total production workers is unexpectedly smaller in the core, while managers have on average two years more of sector experience. More than a third of all manufacturing firms in the core identify labor regulations and labor skill levels as a major constraint, compared to a fifth and a quarter in non-core regions, respectively.
One of the biggest surprises is that almost across the board, firms in the core perceive a worse business climate than those in non-core regions. Infrastructure-related indicators reveal the existence of congestion costs in agglomerations, especially with regards to electricity. The number of power outages, value lost due to the latter, and the average electricity from a generator are all higher in the core compared to non-core regions.
10
Table 1: Manufacturing Firms in Core versus Non-core Regions
Core Non-core p-value+
Core/
Non-core Export and trade outcomes
Direct exports (% of sales) 5.1 4.6 0.232 1.12
% of firms that export directly 18.3 13.1 0.042** 1.40
% of firms that use material inputs and/or supplies of foreign origin 44.1 33.4 0.009*** 1.32
Firm characteristics Age and ownership
Average age (years) 20.5 17.5 0.002**** 1.17
Private domestic ownership (%) 91.1 89.0 0.420 1.02
Private foreign ownership (%) 7.9 3.3 0.051* 2.42
Technology
% of firms with internationally-recognized quality certification 23.5 17.1 0.062* 1.37
% of firms using technology licensed from foreign companies 13.2 8.6 0.108 1.53
% of firms using their own website 54.7 36.3 0.000*** 1.51
% of firms using email to communicate with clients/suppliers 72.1 57.1 0.000*** 1.26
Workforce
% of firms offering formal training 35.9 31.9 0.299 1.13
Average number of seasonal/temporary, full-time employees 5.7 5.1 0.396 1.12
Average number of permanent, full time employees 95.3 66.8 0.127 1.43
Average share of skilled production workers (% of production workers) 66.1 74.6 0.004*** 0.89
Average experience of the top manager working in the firm's sector
(years) 19.9 17.7 0.024** 1.13
% of firms identifying labor regulations as a major constraint 32.4 18.5 0.000*** 1.75
% of firms identifying labor skill level as a major constraint 37.9 26.9 0.003*** 1.41
Investment climate
Infrastructure
Number of power outages in a typical month 10.3 6.8 0.001*** 1.51
Duration of power outages (hours) 3.4 3.0 0.355 1.14
Value lost due to power outages (% of sales) 4.2 3.3 0.038** 1.28
Delay in obtaining an electrical connection (days) 37.6 29.1 0.488 1.29
Average electricity from a generator (%) 2.6 1.3 0.000*** 1.93
Average number of incidents of water insufficiency in a typical month 7.5 5.9 0.228 1.28
Delay in obtaining a water connection (days) 19.9 16.6 0.666 1.20
11
Table 1, continued: Manufacturing Firms in Core versus Non-core Regions
Core Non-core p-value+
Core/
Non-core Investment climate, continued
Transport and trade facilitation
Average time to clear direct exports through customs (days) 8.9 8.1 0.668 1.10
Average time to clear imports from customs (days) 13.2 10.0 0.142 1.32
Average time of inventory of most important input (days) 26.8 21.0 0.039** 1.27
% of firms identifying customs & trade regulations as a major constraint 18.5 11.4 0.043** 1.63
% of firms identifying transportation as a major constraint 18.6 19.1 0.907 0.98
Regulations and Tax
Senior management time spent in dealing with requirements of government regulation (%)
14.4 8.1 0.000*** 1.78
Average number of visits or required meetings with tax officials 1.3 1.1 0.066* 1.19
% of firms identifying tax rates as major constraint 49.4 40.3 0.019** 1.23
% of firms identifying tax administration as major constraint 42.0 29.7 0.003*** 1.41
Permits and Licenses
Average time to obtain operating license (days) 55.0 49.4 0.652 1.11
Average time to obtain import license (days) 41.0 27.1 0.312 1.51
Average time to obtain construction-related permit (days) 147.0 61.1 0.119 2.41
% of firms identifying business licensing and permits as major constraint 29.3 20.2 0.035** 1.45
Corruption
% of firms expected to pay informal payment to public officials 23.5 11.0 0.000*** 2.13
% of firms expected to give gifts to get an operating license 19.2 8.9 0.008*** 2.16
% of firms expected to give gifts in meetings with tax officials 21.0 11.7 0.041** 1.79
% of firms expected to give gifts to secure a government contract 19.9 21.6 0.732 0.92
% of firms identifying corruption as a major constraint 46.8 38.8 0.041** 1.21
Access to Finance
Finance from internal sources (%) 59.4 56.4 0.570 1.05
Finance from banks (%) 24.4 26.6 0.664 0.92
Finance from trade credit (%) 10.6 9.1 0.707 1.16
% of firms with line of credit or loans from financial institutions 46.7 39.2 0.043** 1.19
% of firms using banks to finance investments 32.7 37.4 0.383 0.87
% of firms using banks to finance expenses 40.9 31.2 0.026** 1.31
% of firms identifying access to finance as a major constraint 41.6 26.0 0.000*** 1.60
Source: Own calculations. Data: Enterprise Survey Indicators. NB: +t-test of difference in means. p*<0.1, p**<0.05, p***<0.01.
The percentage of manufacturing firms in the core identifying business licensing and permits as major constraints is 45 percent higher. On average, senior management has to spend more time in dealing with requirements of government regulation and the average number of visits or required meetings with tax officials is also higher. The percentage of manufacturing firms identifying taxes and tax administration as a major constraint is more than 20 and 40 percent
12
higher in the core, respectively. There is also a stronger perception of corruption in the core, measured as the percentage of manufacturing firms expected to pay informal payments or gifts to public officials or tax officials and to give gifts to obtain an operating license. All these indicators are about twice as high as in non-core regions. The perception of corruption is also higher in the core, but to a lesser extent. Regarding finance, the percentage of manufacturing firms in the core with a line of credit or loans in the core is 20 percent higher. In addition, the share of manufacturing firms using banks to finance investments is more than 30 percent higher. Nevertheless, the perception of manufacturing firms regarding access to finance is more pessimistic in the core.
2.3
Services Firms
The analysis of services covers 7,847 firms which represent 19 percent of the overall sample (see Appendix 3). We dropped retail or wholesale trade firms and hotels and restaurants as these do not represent typical firms for which cross-border trade would be significant. Two-thirds of the remaining services firms focus on business services including IT services, telecommunications, accounting & finance, advertising & marketing, and other business services. Another third of the firms is in construction or transportation. On average, 48 percent of services firms are located in the core. Table 2 shows the indicators for services firms. Fewer indicators show a statistically significant difference between core and non-core regions, which might be due to the low number of observations for some indicators.
Regarding firm characteristics, services firms in the core have a higher share of exports in sales than services firms in non-core regions. Export participation, on the other hand, does not show a significant difference. Contrary to the findings in manufacturing, this implies that the threshold of export participation might be lower, but differences in export intensity are more difficult to achieve in non-core regions. Other trade-related indicators show that the average time of inventory of the most important input is more than 20 days in the core compared to 12 days in non-core regions. While ownership variables show no significant difference, it is worth to point out the generally lower FDI share of services versus manufacturing firms.
Unlike manufacturing firms, there seem to be no significant differences between core and non-core regions with regard to technology. Regarding the workforce, the average number of permanent full-time employees is 70 percent in core-regions than non-core regions. The percentage of firms identifying labor regulations and labor skill levels as a major constraint is lower in the core for services firms.
13
Table 2: Services Firms in Core versus Non-core Regions
Core Non-core p-value+
Core/
Non-core Export and trade outcomes
Direct exports (% of sales) 4.7 3.2 0.156 1.49
% of firms that export directly 11.3 9.0 0.338 1.25
% of firms that use material inputs and/or supplies of foreign origin 36.6 25.2 0.470 1.45
Firm characteristics
Age and ownership
Average age (years) 14.6 14.3 0.831 1.02
Private domestic ownership (%) 92.4 92.3 0.953 1.00
Private foreign ownership (%) 1.5 1.2 0.549 1.24
Technology
% of firms with internationally-recognized quality certification 14.4 16.7 0.553 0.86
% of firms using technology licensed from foreign companies 4.1 4.1 0.974 1.02
% of firms using their own website 48.6 51.6 0.668 0.94
% of firms using email to communicate with clients/suppliers 72.3 74.5 0.710 0.97
Workforce
% of firms offering formal training 24.2 27.0 0.830 0.90
Average number of seasonal/temporary, full-time employees 4.5 4.8 0.826 0.93
Average number of permanent, full time employees 72.5 42.4 0.045** 1.71
Average experience of the top manager working in the firm's sector
(years) 15.1 15.6 0.644 0.97
% of firms identifying labor regulations as a major constraint 19.7 27.1 0.282 0.73
% of firms identifying labor skill level as a major constraint 31.5 49.3 0.009*** 0.64
Investment Climate
Infrastructure
Number of power outages in a typical month 6.6 3.9 0.006*** 1.68
Duration of power outages (hours) 2.9 2.0 0.068* 1.42
Value lost due to power outages (% of sales) 4.2 5.2 0.433 0.80
Delay in obtaining an electrical connection (days) 71.5 17.4 0.073* 4.10
Average electricity from a generator (%) 2.8 0.3 0.002*** 8.80
Average number of incidents of water insufficiency in a typical month 4.4 4.9 0.674 0.89
Delay in obtaining a water connection (days) 46.1 12.1 0.075* 3.80
14
Table 2, continued: Services Firms in Core versus Non-core Regions
Core Non-core p-value+
Core/
Non-core Investment Climate, continued
Transport and trade facilitation
Average time to clear direct exports through customs (days) 5.4 7.3 0.316 0.74
Average time to clear imports from customs (days) 12.0 17.2 0.301 0.70
Average time of inventory of most important input (days) 20.1 11.5 0.027** 1.75
% of firms identifying customs & trade regulations as a major constraint 15.0 18.5 0.510 0.81
% of firms identifying transportation as a major constraint 19.0 19.8 0.847 0.96
Regulations and Tax
Senior management time spent in dealing with requirements of government regulation (%)
13.4 13.1 0.870 1.03
Average number of visits or required meetings with tax officials 1.1 1.3 0.344 0.85
% of firms identifying tax rates as major constraint 39.4 53.9 0.033** 0.73
% of firms identifying tax administration as major constraint 28.1 43.9 0.025** 0.64
Permits and Licenses
Average time to obtain operating license (days) 31.2 41.9 0.336 0.74
Average time to obtain import license (days) 14.3 22.2 0.123 0.65
Average time to obtain construction-related permit (days) 104.4 75.1 0.194 1.39
% of firms identifying business licensing and permits as major constraint 19.6 28.9 0.148 0.68
Corruption
% of firms expected to pay informal payment to public officials 18.7 14.3 0.309 1.31
% of firms expected to give gifts to get an operating license 16.0 16.2 0.979 0.99
% of firms expected to give gifts in meetings with tax officials 11.6 13.0 0.767 0.89
% of firms expected to give gifts to secure a government contract 13.0 18.2 0.342 0.72
% of firms identifying corruption as a major constraint 41.4 55.7 0.031** 0.74
Access to Finance
Finance from internal sources (%) 69.9 59.6 0.111 1.17
Finance from banks (%) 19.0 23.1 0.445 0.82
Finance from trade credit (%) 5.6 11.1 0.082* 0.51
% of firms with line of credit or loans from financial institutions 41.7 36.8 0.443 1.13
% of firms using banks to finance investments 24.1 27.7 0.581 0.87
% of firms using banks to finance expenses 31.0 37.5 0.502 0.83
% of firms identifying access to finance as a major constraint 26.8 32.6 0.405 0.82
Source: Own calculations. Data: Enterprise Survey Indicators. NB: +t-test of difference in means. p*<0.1, p**<0.05, p***<0.01.
Infrastructure-related indicators confirm the existence of congestion costs in agglomerations for services firms, especially with regards to electricity. The number and duration of power outages per month is higher in the core. Moreover, the time to obtain an electrical and water connection is almost four times as high for services firms in the core compared to firms in non-core regions. As a result, the percentage of services firms producing their electricity from a generator is almost 9
15
times higher for services in the core. Services firms show no significant locational differences with regard to permits.
Surprisingly, the percentage of firms identifying taxes and tax administration as a major constraint is lower in the core. There is also a stronger incidence of corruption in the core, which is only significant when measured as the percentage of services firms expected to pay informal payments to public officials. Regarding finance, a higher percentage of firms in non-core regions uses finance from trade credit, while services firm in the core tend to depend more strongly on internal sources, which seems surprising.
2.4
Conclusions
Overall, as expected we find that both manufacturing and services firms in the core have higher levels of export participation and higher shares of exported output than firms in non-core regions. For manufacturing firms, the differences in export participation are significant, while for services firms the significant results are for export intensity rather than participation. Manufacturing firms in core regions also make significantly greater use of imported inputs, a factor which may contribute to their productivity and thus export participation.
We also find significant differences in the regional investment climate reported by firms operating in core versus non-core region. In this respect, some of the findings were surprising. Results from both manufacturing and services firms indicate a generally poorer investment climate in the core, suggesting the possible existence of congestions costs. On the other hand, the finding of greater access to finance (at least for manufacturing firms) and the potential of technology spillovers in the core may offset some of these congestion costs.
The results suggest there may be different dynamics impacting export performance for firms in the core and firms outside it. Moreover, the fact that export performance is generally better in the core despite what is reported to be a worse investment climate indicates that other factors, such as first-order geography and the potential benefits of agglomeration, may play an important role.
16
3
Econometric Analysis
In the following section, we examine the role of location for export participation using regression analysis. In particular, we study whether the determinants of exporting are different if firms are located in core versus non-core regions.8
3.1
Econometric Model
We follow the theoretical model of exporting of Roberts and Tybout (1997). A firm i’s export propensity at time t depends on a firm’s expected revenues R and costs c plus sunk entry costs of exporting, S:
1
Pr(
ex
it
1)
Pr(
R
it
c
it
S
(1
ex
it)
(1)where ex denotes an export dummy at the firm-level. Sunk entry costs of exporting, S, are 1 if a firm exported in period t-1 and 0, otherwise. In other words, a firm exports if expected profits π > 0.
A firm’s expected profits π are affected by firm-level characteristics, regional characteristics, and agglomeration economies which can generate or lower revenues R and/or costs c. Equation (1) translates into:
1
Pr(
ex
it
1)
Pr(
it
firm
it
reg
rt
agg
rt
S
(1
ex
it)
0)
(2)where subscript r designates regions, firm firm-level determinants of exporting, reg regional determinants of exporting, and agg agglomeration economies.
Sunk entry costs of exporting S might explain a large part of export activity. Since our data sample only covers the most recent Enterprise Surveys for each country, we cannot capture sunk entry costs of exports by adding lagged exports as an explanatory firm-level variable. We propose an alternative way to account for sunk entry costs of exporting. We make the following assumptions:
(i) Exporters that haven’t exported in the previous period (new exporters) export a share of their output that is below threshold ζ. Ruhl and Willis (2008) show for a sample of Colombian manufacturing firms between 1982 and 1986 that new firms export on average 3 to 4% of sales upon entry into the export market, while export intensity increases with every additional year exporters stay on the export market. Ma and Zhang (2008) show the distribution of export
8
17
intensities for new Chinese manufacturing exporters between 1999 and 2005. In 2005, 58% of domestic new exporters reported an export intensity of between 0 and 10%, while this percentage was 36% for foreign new exporters. Although these percentages were somewhat lower in the preceding years, at least a third of domestic new exporters and at least a quarter of foreign new exporters export 10% or less in their first year. We assume that a similar distribution holds for our sample. Given that the average export intensity of all direct exporters in our sample is 48.3%, this reflects that old exporters usually export a larger share of their sales.
(ii) Firms that exported in the previous period and stop exporting now (exiting exporters) have an export intensity below threshold ζ. Using Colombian customs data from 1996 to 2005, Eaton, Eslava, Kugler, and Tybout (2007) find that almost half of all exporters did not export in the previous year, but their contribution to export revenues is extremely small and most new exporters leave the export market in the following year. While firms exiting the export market do not necessarily have to be new exporters, it is much more likely that firms with a smaller export intensity stop exporting as opposed to firms with a high export share.
(iii)We relax the assumption that new exporters have to carry the whole burden of sunk costs upon entry into the export market. This assumption is in line with Eaton et al. (2007) who suggest that new exporters and their buyers undergo a period of learning about one another before locking in major exporting contracts. Surviving exporters typically start to export into a single foreign market and gradually expand into additional markets, suggesting that “the costs of “testing the waters” may be substantially less than the cost of locking in major exporting contracts” (Eaton et al., p. 17).
We will attribute an export dummy to firms only that exceed a certain threshold ζ of export intensity. Assumptions (i) and (iii) ensure that applying a threshold ζ covers established exporters only that have paid the bulk of sunk entry costs, but not new exporters. Assumption (ii) makes sure that exiting exporters wouldn’t fall under the category exporter if their export intensity is below the threshold ζ. If all three assumptions hold, lagged exports – the measure for sunk entry costs – and the dependent variable would be identical. Since lagged exports would perfectly predict exports in such a case, lagged exports as a measure of sunk entry costs couldn’t be included into the regression analysis.
Equation (2) then translates into:
18
where
ex
it
1
if a firm’s export share >= ζ and 0 otherwise.3.2
Empirical Specification
We focus on the following equation:
0
i i r r c s i
ex
firm
reg
agg
D
D
(4) where
0 designates the constant,D
c country fixed effects,D
s sector fixed effects, and
i the idiosyncratic error term.Following the literature on the firm-level determinants of exporting described above, we include firm size, firm age, foreign ownership, as well as measures of workers’ skills and productivity. This leads to the following version of equation (4):
0 1
ln
2ln
3 4ln
5ln
6i i i i i i i
c r s i
ex
emp
age
fdi
comp
labprod
tech
D
D
D
(5)where
D
r denotes region fixed effects.The firm-level indicators from the Enterprise Surveys Indicator Database combined with data from the Enterprise Analysis Unit9 are defined as follows:
emp = total number of permanent and temporary employees in logarithms,
age = years of operation in logarithms,
fdi = 1 if foreign private ownership >= 10% and 0 otherwise,
comp = average real compensation per worker (including wages, salaries and bonuses) in logarithms,
labprod = labor productivity defined as real value added per worker in logarithms, and
tech = iso + tech_for + website + email ∈ {0, 1, 2, 3, 4 }, where iso = 1 if firm owns internationally-recognized quality certification and 0 otherwise, tech_for = 1 if firm uses technology licensed from foreign firms and 0 otherwise, website = 1 if firm uses
9 We obtained compensation and value added data from Frederica Saliola and Murat Seker from the
Enterprise Analysis Unit of the World Bank. Value added has been calculated by subtracting materials and energy costs from total value of sales. All local currencies have been converted into US dollars and deflated using a GDP deflator in USD (base year 2000). Exchange rates and GDP deflators have been obtained from the World Development Indicators.
19
own website to communicate with clients or suppliers, email = 1 if firm uses email to communicate with clients or suppliers. This technology indicator captures both worker skills and productivity.
In a second step, we substitute regional determinants of exporting and agglomeration economies for regional dummies. Following the economic geography literature, we include variables related to investment climate, which yields the following equation:
0 1 2 3 4 5 6 1 2 3 4 5
ln
ln
ln
ln
ln
ln
ln
i i i i i i i r r r r r c s iex
emp
age
fdi
comp
labprod
tech
customs
electr
license
credit
corrup
D
D
(6)where the regional determinants of exporting are defined as follows:
customs = average number of days to clear imports from customs in logarithms by region
electr = hours of power outages per month in logarithms by region
license = average number of days to obtain either operating license, import license or construction-related permit in logarithms by region
credit = the percentage of firms with a credit line by region, and
corrup is the percentage of firms expected to pay informal payment to public officials by region.
The calculation of these regional indicators is based on all firms in the sample, regardless of a firm’s specific industry. We used weights provided by the Enterprise Analysis Unit to calculate regional averages. Note that we only include some regional determinants of exporting due to data limitations of our available regional investment climate indicators (see Tables 1 and 2). Thus, we only use one variable to capture infrastructure (electr), transport and trade facilitation (customs), permits and licenses (license), corruption (corrup), and access to finance (credit), respectively. We don’t capture regulation and tax, and by focusing on regional investment climate, it might be possible that we omit other regional determinants of exporting, e.g., related to average skills and productivity. However, we believe that these are indirectly captured by agglomeration economies.
Finally, we include three types of regional agglomeration economies, namely (i) a region’s number of firms as percentage of a country’s total number of firms (agg_size), (ii) a region’s number of direct and indirect exporters as percentage of a country’s total number of direct and indirect
20
exporters (agg_ex), and (iii) a region’s number of firms within the same industry as percentage of a country’s total number of firms within the same industry (agg_ind).10
The first effect refers to urbanization economies that are not industry-specific and, thus, capture spillovers due to a geographical concentration of different economic activities.11 While the
second measure also covers different industries and, strictly speaking, can be considered an alternative measure of urbanization economies, we will refer to it as export spillovers in the following. The third measure captures localization economies due to a geographical concentration of firms in the same industry in an agglomeration.
This leads to the following equation:
0 1 2 3 4 5 6 1 2 3 4 5 1 2 3
ln
ln
ln
ln
ln
ln
ln
_
_
_
i i i i i i i r r r r r r r r c iex
emp
age
fdi
comp
labprod
tech
customs
electr
license
credit
corrup
agg
size
agg ex
agg ind
D
(7)We run three types of estimations: (i) on the whole sample, (ii) on core regions only as defined above, and (iii) on non-core regions only. This allows us to detect how the firm-level determinants of exporting change if firms are located in core versus non-core regions. We would hypothesize that traditional firm-level characteristics matter less for firms located in core regions, since a firm’s business environment will explain a larger share of a firm’s export behavior. That is, we expect smaller regression coefficients in the specifications where only core regions are included.
We apply a threshold ζ of export intensity to define exporters as follows: ex = 1 if a firm’s export share >= ζ =10% and 0 otherwise
where export share is defined as a firm’s direct exports as percentage of sales.
This threshold not only serves as an alternative way to deal with sunk entry costs due to the unavailability of lagged export data (see section 3.1), but also lowers the risk of occasional exporters biasing the results. Moreover, we include only direct exporters in our analysis.
Due to the different nature of manufacturing and services firms, we focus on manufacturing firms in section 3.3 and on services firms in section 3.4.
10
Using number of firms instead would only take into account absolute differences, whereas our study is concerned with relative differences in regional sizes. Moreover, the database has only stratified the survey sample across regions within a country, but not across countries.
11
21
3.3
Regression Results: Manufacturing Firms
In the following, we estimate a probit model as described in equation (5). All specifications are robust to heteroscedasticity and include sector and region fixed effects. We cluster standard errors at the regional level to allow for the possibility that εi are correlated across firms within regions.
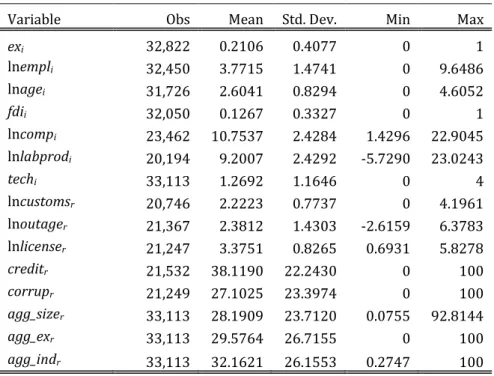
The summary statistics are shown in Table 3. The estimation results for manufacturing firms are shown in Table 4. Columns 1 to 4 show the results for all firms, columns 5 to 8 for firms in core regions only, and columns 9 to 12 for firms in non-core regions only.
For each of these three groups we run four specifications: (i) firm-level determinants of exporting plus country, region and sector fixed effects as specified in equation (5); (ii) firm-level and regional determinants of exporting plus country and sector fixed effects as specified in equation (6); (iii) firm-level determinants of exporting and agglomeration economies only plus country fixed effects; and (iv) firm-level and regional determinants of exporting including agglomeration economies plus country fixed effects as specified in equation (7).
Table 3: Summary Statistics, Manufacturing Firms
Variable Obs Mean Std. Dev. Min Max
exi 32,822 0.2106 0.4077 0 1 lnempli 32,450 3.7715 1.4741 0 9.6486 lnagei 31,726 2.6041 0.8294 0 4.6052 fdii 32,050 0.1267 0.3327 0 1 lncompi 23,462 10.7537 2.4284 1.4296 22.9045 lnlabprodi 20,194 9.2007 2.4292 -5.7290 23.0243 techi 33,113 1.2692 1.1646 0 4 lncustomsr 20,746 2.2223 0.7737 0 4.1961 lnoutager 21,367 2.3812 1.4303 -2.6159 6.3783 lnlicenser 21,247 3.3751 0.8265 0.6931 5.8278 creditr 21,532 38.1190 22.2430 0 100 corrupr 21,249 27.1025 23.3974 0 100 agg_sizer 33,113 28.1909 23.7120 0.0755 92.8144 agg_exr 33,113 29.5764 26.7155 0 100 agg_indr 33,113 32.1621 26.1553 0.2747 100
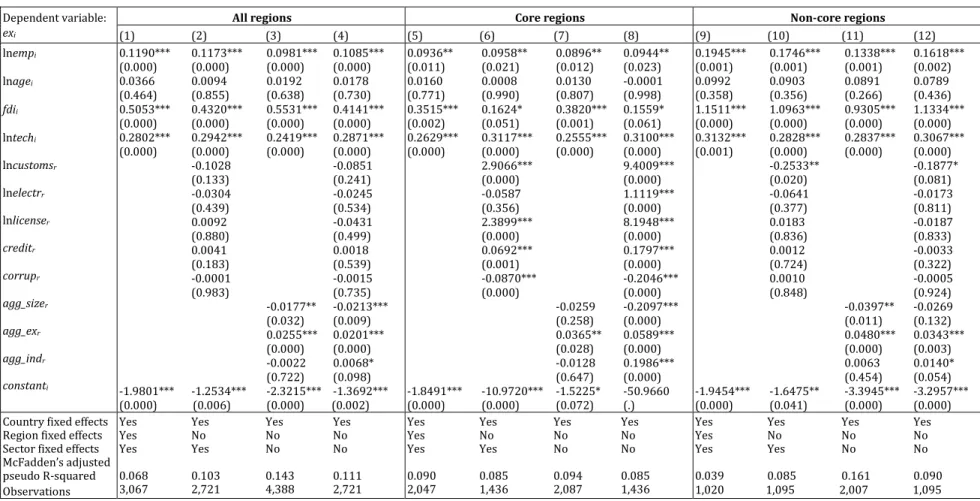
In a first step, we focus on the overall sample, regardless of firm location (columns 1 to 4). Regarding firm-level determinants of exporting, employment, FDI, labor productivity and technology increase a firm’s propensity of exporting, which is significant across all specifications. Age seems to have a negative effect on a firm’s propensity to export, but is only significant in one
22
specification. Compensation per worker has no significant effect. Regarding location, all firm-level determinants of exporting seem to matter more for firms located in non-core regions. This implies that other non-firm-level determinants of exporting, e.g. related to the investment climate, explain a bigger share of export behavior in the core.
Regarding the regional determinants of exporting (columns 2 and 4), all variables show the expected signs. A region’s longer waiting time to clear imports at customs, a longer monthly duration of power outages, a longer waiting time to obtain licenses and corruption have a negative coefficient sign, while a region’s percentage of firms with a credit line shows a positive one. However, only the customs and electricity variables are significant.
Finally, we focus on the agglomeration economies (columns 3 and 4). Urbanization economies (i.e. an agglomeration of firms of all types) appear to hamper the probability of exporting, while localization economies (i.e. an agglomeration of firms in the same industry) as well as an agglomeration of others exporters encourages exporting. The negative effect of general agglomeration may indicate the presence of congestion costs, while the positive results on other types of agglomeration suggests the possibility of industry and export spillovers.
In a second step, we focus on the effect of firm location on the determinants of exporting. Columns 5 to 8 report the results for firms located in core regions, while columns 9 to 12 show the results for firms located in non-core regions. Firm-level determinants, agglomeration economies and some regional determinants confirm the results for the whole sample. Some firm-level coefficients tend to be larger in non-core regions, especially FDI, but also firm size and labor productivity.
Interestingly and in line with these findings, the coefficients of regional determinants are larger and more significant for firms located in core regions. That is, the investment climate has a stronger influence on a firm’s propensity of exporting for firms located in the core as opposed to non-core regions (columns 6 and 10). In fact, only access to finance plays a role in non-core regions. Analogously, urbanization economies and export spillovers are larger in the core than in non-core regions.
23
Table 4: Probit Regressions, Manufacturing Firms
Dependent variable:
exi
All regions Core regions Non-core regions
(1) (2) (3) (4) (5) (6) (7) (8) (9) (10) (11) (12) lnempi lnagei fdii lncompi lnlabprodi lntechi lncustomsr lnelectrr lnlicenser creditr corrupr agg_sizer agg_exr agg_indr constanti 0.3147*** 0.3322*** 0.3084*** 0.3260*** (0.000) (0.000) (0.000) (0.000) -0.0247 -0.0210 -0.0379* -0.0203 (0.217) (0.303) (0.060) (0.348) 0.4475*** 0.4971*** 0.4208*** 0.4669*** (0.000) (0.000) (0.000) (0.000) 0.0231 0.0130 0.0217 0.0176 (0.138) (0.476) (0.181) (0.332) 0.0770*** 0.0642*** 0.0512*** 0.0397** (0.000) (0.000) (0.000) (0.015) 0.3033*** 0.2389*** 0.2731*** 0.2266*** (0.000) (0.000) (0.000) (0.000) -0.1209** -0.0498 (0.040) (0.341) -0.0327 -0.0482* (0.364) (0.096) -0.0401 -0.0283 (0.358) (0.477) 0.0035 -0.0002 (0.103) (0.908) -0.0020 -0.0015 (0.439) (0.490) -0.0333*** -0.0265*** (0.000) (0.000) 0.0268*** 0.0220*** (0.000) (0.000) 0.0042* 0.0018 (0.075) (0.482) -2.4532*** -2.8536*** -3.3211*** -2.8582*** (0.000) (0.000) (0.000) (0.000) 0.3093*** 0.3200*** 0.3090*** 0.3184*** (0.000) (0.000) (0.000) (0.000) 0.0037 0.0205 -0.0087 0.0069 (0.891) (0.458) (0.775) (0.830) 0.3461*** 0.4148*** 0.3334*** 0.3807*** (0.000) (0.000) (0.000) (0.000) 0.0163 0.0049 0.0168 0.0155 (0.470) (0.844) (0.486) (0.545) 0.0613*** 0.0677*** 0.0384* 0.0379 (0.006) (0.009) (0.090) (0.155) 0.2777*** 0.2503*** 0.2631*** 0.2383*** (0.000) (0.000) (0.000) (0.000) -0.6810*** -3.6014*** (0.005) (0.000) -0.0415 1.0238*** (0.137) (0.000) -1.3078*** 1.1352*** (0.000) (0.000) 0.0342*** 0.0407*** (0.000) (0.000) -0.0106** 0.0506*** (0.013) (0.000) -0.0301 -0.2386*** (0.125) (0.000) 0.0157 0.1323*** (0.294) (0.000) 0.0045 0.0027 (0.182) (0.483) -3.0385*** 1.9384* -2.2711** 3.1224*** (0.000) (0.061) (0.019) (0.000) 0.3187*** 0.3353*** 0.3094*** 0.3388*** (0.000) (0.000) (0.000) (0.000) -0.0509* -0.0368 -0.0564** -0.0342 (0.079) (0.198) (0.039) (0.247) 0.5957*** 0.5921*** 0.5338*** 0.5911*** (0.000) (0.000) (0.000) (0.000) 0.0312 0.0281 0.0275 0.0302 (0.137) (0.265) (0.160) (0.220) 0.0903*** 0.0617*** 0.0582*** 0.0410* (0.000) (0.003) (0.000) (0.055) 0.3265*** 0.2426*** 0.2833*** 0.2279*** (0.000) (0.000) (0.000) (0.000) -0.0361 0.0058 (0.578) (0.897) -0.0215 0.0102 (0.622) (0.801) 0.0130 -0.0092 (0.795) (0.810) 0.0037* -0.0015 (0.059) (0.451) -0.0031 -0.0000 (0.315) (0.990) -0.0604*** -0.0540*** (0.000) (0.000) 0.0483*** 0.0314*** (0.000) (0.000) 0.0061* 0.0027 (0.078) (0.379) -3.9357*** -3.2019*** -1.9198*** -2.5363*** (0.000) (0.000) (0.005) (0.000) Country fixed effects
Region fixed effects Sector fixed effects McFadden’s adjusted pseudo R-squared
Yes Yes Yes Yes
Yes No No No
Yes Yes No No
0.291 0.268 0.297 0.262 16,976 12,056 18,353 12,056
Yes Yes Yes Yes
Yes No No No
Yes Yes No No
0.272 0.264 0.261 0.249 7,868 6,046 7,868 6,046
Yes Yes Yes Yes
Yes No No No
Yes Yes No No
0.306 0.275 0.323 0.273 9,108 5,981 10,312 5,981 Observations
24
Appendices 5 to 7 report the regression results by firm size, where large firms are firms with at least 100 employees, medium firms are firms with 20 to 99 employees, and small firms are firms with less than 20 employees. We will not go into detail here, but simply point out some interesting findings. (i) Firm-level determinants seem to matter more for smaller firms. That is, the coefficient signs of firm-level determinants of exporting are larger for medium and small firms and smaller for large firms. This is in line with observations of greater variation in productivity performance across small firms. (ii) Most firm-level determinants are more important in non-core regions, in particular FDI ownership. (iii) Urbanization economies show a significant negative association with exporting across all firm sizes in all locations, except for medium-sized firms in the core. This negative effect is stronger for large firms. (iv) We detect positive export spillovers across all firm sizes in all locations, except for sized firms in the core. This positive effect is strongest for medium-sized firms. (v) Localization economies no longer matter for exporting when we control for firm size. (vi) Regional determinants do not appear to have any clear impact related to firm size.
3.4
Regression Results: Services Firms
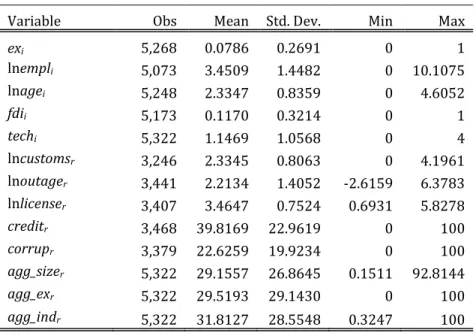
We repeat the exercise above for services firms only. As compensation per worker and labor productivity are only available for manufacturing firms, we cannot include these measures. Summary statistics are shown in Table 5, with the regression results shown in Table 6. First, we focus on the overall sample in columns 1 to 4. As expected, employment, FDI, and technology increase a firm’s propensity to export, which is significant across all specifications. Age shows no effect on a firm’s propensity to export. Again, all firm-level determinants of exporting seem to matter more for firms located in non-core regions, which is particularly strong for FDI.
Regarding the regional determinants of exporting (columns 2 and 4), the coefficient signs are mostly as expected, but none of these effects is significant. That is, regional determinants seem to matter less for services firms than they do for manufacturing firms. Finally, we focus on agglomeration economies (columns 3 and 4). Urbanization economies reduce the likelihood of exporting, whereas export spillovers increase it, confirming the results for manufacturing firms. Localization economies show a positive impact in column 4.
In a second step, we focus on the role of firm location on the determinants of exporting. Firm-level determinants and agglomeration economies confirm the results of the overall sample in terms of coefficient sign and significance. The coefficients of firm-level determinants are larger for services firms located in non-core regions, and this difference is larger compared to the
25
manufacturing firm sample. As in the manufacturing sample, agglomeration economies seem to be larger in the core.
Table 5: Summary Statistics, Services Firms
Variable Obs Mean Std. Dev. Min Max
exi 5,268 0.0786 0.2691 0 1 lnempli 5,073 3.4509 1.4482 0 10.1075 lnagei 5,248 2.3347 0.8359 0 4.6052 fdii 5,173 0.1170 0.3214 0 1 techi 5,322 1.1469 1.0568 0 4 lncustomsr 3,246 2.3345 0.8063 0 4.1961 lnoutager 3,441 2.2134 1.4052 -2.6159 6.3783 lnlicenser 3,407 3.4647 0.7524 0.6931 5.8278 creditr 3,468 39.8169 22.9619 0 100 corrupr 3,379 22.6259 19.9234 0 100 agg_sizer 5,322 29.1557 26.8645 0.1511 92.8144 agg_exr 5,322 29.5193 29.1430 0 100 agg_indr 5,322 31.8127 28.5548 0.3247 100
Regarding regional determinants, the coefficient signs are somewhat ambiguous. Almost none of these effects are significant in non-core regions. In core regions, only credit and corruption show the expected coefficient signs, while customs, electricity and license show inverse effects. We believe that these inverse signs reflect an endogeneity problem – that is, services firms that are located in regions with higher congestion costs (urban agglomerations) are more likely to export. As in the manufacturing sample, regional determinants matter more for firms in core regions.
Appendices 8 to 10 report the regression results by firm size. Many variables now show ambiguous results. Due to the low number of observations, the results should be interpreted with caution.