October 2012
Center for Benefit-Cost Studies of Education
Teachers College, Columbia University
This research was funded by the U.S. Department of Education, Institute of Education Sciences Award Number R305U120001
Cost-Effectiveness Analysis
of Interventions that Improve
High School Completion
Henry M. Levin
Clive Belfield
Fiona Hollands
A. Brooks Bowden
Henan Cheng
Robert Shand
Yilin Pan
Barbara Hanisch-Cerda
Summary 1
1. Introduction 4
The Value of Cost-effectiveness Analysis for Decision-makers 4 Dropping out of High School as a Policy Problem 5
Our Approach 6
Structure of this Report 6
2. Method and Practice 8
Collection of Cost Data 8
Using Cost Analysis in a Decision-oriented Framework 11
Cost-Effectiveness Analysis 12
Principles and Practices for Cost-Effectiveness Analysis 13
Application to Dropout Prevention 16
3. Cost-Effectiveness Analysis of Talent Search 20
Talent Search Program 20
The Effectiveness of Talent Search 21
Cost-Effectiveness of Talent Search 25
Conclusions about Talent Search 29
4. Cost-Effectiveness Analysis of Other Interventions
that Increase High School Completion 30
National Guard Youth ChalleNGe 30
Job Corps 33
JOBSTART 35
New Chance 39
Early Childhood Interventions 43
Sensitivity Testing 45
5. Summary of Evidence and Conclusions 48
Conclusions 49
References 52
Appendices 56
Appendix 1 Prices of Ingredients 56
Appendix 2 Interview Protocol – Talent Search 60
C O N T E N T S
S U M M A R Y
W
ith 6% of GDP being spent on education in the United States, it is important to evaluate which educational strategies are both effective in eliciting desirable outcomes and in using available resources most judiciously. Evaluating productivity of educational programs, while rarely done, is especially critical as many states continue to cut education budgets and government agencies are pressed for adequate resources. In this report we describe the tool of cost-effectiveness analysis, identify method-ological challenges in its application, and present cost-effectiveness analyses of several programs, each of which has been shown to be effective in helping students complete high school. We also demonstrate how cost-effectiveness comparisons can be used to inform decision-makers in allocating resources to meet their policy goals.Completion of high school is a desirable educational outcome socially and economically from the per-spectives of both the student and society, but more than 12 percent of American citizens (i.e. 28 million) age 18 or over are high school dropouts (Institute of Education Sciences, 2011; Rumberger, 2011b). Belfield, Levin, and Rosen (2012) estimated the cost of lost economic opportunities as well as fiscal costs from foregone tax revenues, and additional public costs such as crime and higher public health and welfare costs of called “opportunity youth,” at $258,240 per youth, over a lifetime in present value, and the cost to so-ciety at $755,900. Rumberger (2001, 2011b) emphasizes that the causes of dropping out are not purely academic but also depend on factors such as family background, community and peers. Consequently, pro-grams that address the problem successfully must address multiple factors and may need to be delivered both in school and out-of-school settings.
Based on a review of evidence from the What Works Clearinghouse’s Dropout Prevention topic area, we identified five programs that have been found to be effective at helping students complete high school. The programs are: JOBSTART, New Chance, National Guard Youth ChalleNGe (NGYC), Job Corps and Talent Search. We demonstrate cost-effectiveness analysis for each program. Effectiveness data for each of the programs were extracted from rigorous prior evaluations. In four cases cost data, in some form, were also available from prior studies that we could match to the effectiveness data, after some adjustments. In the fifth case, Talent Search, we collected cost data using the well-established ingredients method (Levin & McEwan, 2001).
Ideally both cost and effectiveness data would be collected simultaneously for an intervention at the time of the evaluation. In order to provide a fair comparison of programs, assessments of effectiveness and costs need to address the same outcome for similar populations of students in similar settings. Ad-ditionally, the costs should be collected using the same methods across studies and adjusted to a uniform set of prices to establish a level playing field. We describe the methodological challenges we encountered in combining pre-existing cost and effectiveness data collected using different methods, often at different points in time, and in trying to compare programs that vary from each other along important dimensions.
Notwithstanding the challenges we encountered, we present cost-effectiveness estimates, summarized in Table S1, for the five programs from the social perspective, i.e., accounting for resources used regardless of which agency provided the funds for them.
Four of the programs reviewed, NGYC, JOBSTART, New Chance and Job Corps, shared several sim-ilarities: they targeted youth who had already dropped out of school; provided a comprehensive array of services including education, vocational training, life skills training and health services; and the cost data available represent “gross” costs in that costs of similar services generally available in the community for non-participants were not subtracted. While not perfectly aligned in terms of program goals or methods used for costing, we are able to demonstrate how cost-effectiveness comparisons can be made across similar programs to help decision-makers assess which programs are more efficient from a funding perspective. However, given differences among the four programs in the methods used to obtain cost and effectiveness data, we emphasize that ranking these programs in terms of relative cost-effectiveness is not reliable under the current analysis. To allow such a ranking, we recommend employing comprehensive and consistent methods for collecting both costs and impact data simultaneously. Sensitivity analyses are used to check the robustness of the cost-effectiveness analyses.
Talent Search, also a national program, serves a different population – low-income youth whose parents did not attend college, who are still in school, and who appear to be on track to graduate and attend college. Consistent with our recommended approach to costing programs, but in contrast to the gross costs ob-tained for the four programs above, we present the costs of Talent Search as incremental costs, i.e., the costs of the program over and above the underlying costs of schooling. Given the differences in target pop-ulation, delivery setting and method of calculating costs, the results we present for Talent Search are not di-rectly comparable with results for the four programs targeted at dropouts.
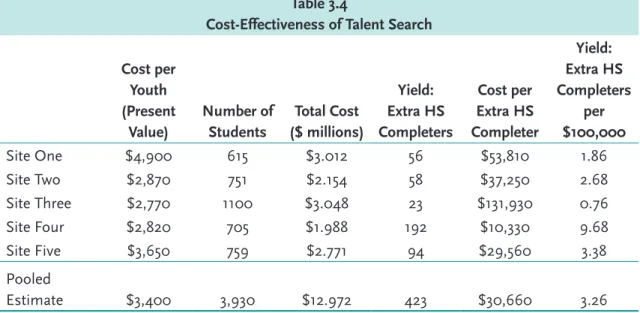
Our data for Talent Search are from five sites in Texas and Florida. We followed the ingredients method to obtain the cost data for each site, interviewing site directors and key personnel using a detailed protocol and compiling a database of national prices for all relevant resources. This compilation of ingredients took place many years after the evaluation and may not reflect the exact use of resources at that time. While in-terview responses indicated stability in the program over time, the accuracy of retrospection may not be ideal. However, given the consistency in method of costing each site, we are able to compare the five sites against each other to demonstrate how different implementations of the same program, each of which has been shown to increase the rate of high school completion for at least one cohort of students (Constantine, Seftor, Martin, Silva, & Myers, 2006), can result in dramatically different cost structures and relative cost-ef-fectiveness. Such a site-level comparison within a single program can help program administrators identify the most efficient sites in order to investigate which factors lead to greater productivity. These practices may then be recommended for adoption at less efficient sites.
The results indicate that, for high school dropouts, the cost to produce each extra high school completer through the interventions studied here are very high, ranging from about $70,000 to $195,000 per com-pleter. These high costs may reflect the difficulty for education reforms alone to overcome barriers to edu-cational success deriving from both academic and out-of-school influences (Rumberger, 2001), or the fact that these programs address multiple outcomes in addition to high school completion. Two of these inter-ventions look more cost-effective at increasing high school completion – NGYC and JOBSTART – with the other two programs, New Chance and Job Corps, having similar (but lower) cost-effectiveness.
The pooled estimate of the cost-effectiveness ratio for Talent Search is considerably lower than for the other interventions: the cost to produce an extra high school completer is only $30,660. Its cost-effectiveness ratio is more than two times lower than the most cost-effective out-of-school programs. The results for
Talent Search are, however, not directly comparable to the other four programs presented because Talent Search is an incremental program, providing resources to students over and above what they already receive in school. Additionally, a program targeting promising students, as opposed to dropouts, can be expected to result in greater effectiveness and cost-effectiveness in improving high school completion.
For three of the interventions studied, JOBSTART, New Chance and Talent Search, site-level data were available. We found that cost-effectiveness ratios varied significantly across sites in each program and con-sequently we caution evaluators against generalizing from cost-effectiveness results without evidence on site-specific variation. We conclude that site-level analyses are far more informative than overall program estimates that can mask a very wide range of results.
Table S1
Cost-Effectiveness Ratios across Interventions that Raise the High School (HS) Completion Rate
Cost per student
Cost per Extra HS Completer
Yield: Extra HS Completers per
$100,000 Gross costs of programs
targeting dropouts
NGYC $14,100 $71,370 1.40
Job Corps $22,290 $131,140 0.76
JOBSTART $10,460 $69,510 1.44
New Chance $17,820 $194,640 0.51
Incremental costs of program targeting promising students
Talent Search (five sites) $3, 400 $30,660 3.26
Given the difficulties of collecting cost data retrospectively to match with effectiveness data and of com-paring programs evaluated and costed using different methods, we recommend that cost data should be col-lected at the same time as impact data, using consistent methods of data collection. In addition, collection of detailed implementation data can help explain variations in both costs and effectiveness and allow prac-tices at the most cost-effective sites to be adopted elsewhere.
1. INTRODUCTION
Almost one trillion dollars of public funding, or 6% of Gross Domestic Product, is spent on education in the United States (U.S. Government Spending, 2012) with results that are relatively mediocre on average. Edu-cational costs have risen historically at a much faster rate than the consumer price index. At the same time, state education budgets have been falling during the recent economic recession. The Center on Budget and Policy Priorities (2012) reports that for the 2012-2013 school year, 35 states are providing less funding for education than they did five years ago. Cuts at the state level often disproportionately affect school districts with high levels of low-income students. Yet, little attention has been focused on issues of cost and produc-tivity of education and how we can improve outcomes relative to the costs. The purpose of this report is to incorporate a productivity dimension into the analysis of education, that is, to identify ways of improving education that are the most effective and that confer the highest benefits relative to the resources devoted to education. This effort requires consideration of both the effectiveness and costs of different alternatives for educational improvement.
Much more attention has been given in both the research literature and policy to the effectiveness of ed-ucational alternatives than to their costs. Although strong arguments have been made that cost also needs to be taken into account (Harris, 2009), the criterion of cost-effectiveness is rarely used in education and is largely unknown among evaluation specialists (Levin, 2002; Hummel-Rossi & Ashdown, 2002; Clune, 2002). This contradiction stands despite the method of cost-effectiveness analysis having been developed for educational applications almost four decades ago (Levin, 1975; and summarized in Levin & McEwan, 2001). The omission of cost considerations risks the promotion of educational interventions that have only small positive effects, but high costs that exceed those of equally effective alternatives. This report aims to demonstrate how effectiveness data can be combined with cost data to present cost-effectiveness compar-isons that decision-makers can use for optimizing the efficiency of resource allocation. Specifically, this report generates cost-effectiveness results for interventions that increase the rate of high school completion.
The Value of Cost-effectiveness Analysis for Decision-makers
Despite limited attention to cost-effectiveness analysis in education, there do exist examples where the same educational result has been obtained for a fraction of the cost of an existing practice or policy. For example, an early study of teacher selection found that, in order to raise student achievement, it was five to ten times more cost-effective to select teachers with higher verbal test scores than to invest in teachers with additional teaching experience (Levin, 1970). Levin, Glass, and Meister (1987) found that, for raising the achievement of elementary students in mathematics and reading, peer tutoring was twice as cost-effective as computer-assisted instruction and almost four times as cost-effective as reducing class size or increasing instructional time.
In more recent work, Levin and Belfield (2007) compared the cost-effectiveness of five different pro-grams for reducing the number of high school dropouts: two different preschool interventions, class size reduction, higher teacher salaries to obtain and retain higher quality teachers, and high school reform. All of the interventions had been found effective using sophisticated evaluation methods by independent eval-uation organizations. As is often the case, the most effective of the five, Perry Preschool, was not the most cost-effective for this particular outcome (First Things First, a high school reform, ranked first and Perry Preschool was fourth). Indeed, the most cost-effective option was three times as effective per dollar as the
least effective, even though all programs were deemed “effective”. While all the programs met the “effec-tiveness” criterion, policymakers should consider that adoption of some of them costs 3-10 times as much as others to obtain the same educational result. It is this concern that is the focus of this report, demon-strating how educational decision-makers can scrutinize not only the effectiveness of a strategy, but also its burden upon resources. We are not arguing that this should be the only criterion for making a choice, but that it should be given heavy – and certainly greater – consideration than at present. In this respect, cost-ef-fectiveness is information provided to the decision-maker that can be combined with other information in the decision-making process.
Dropping out of High School as a Policy Problem
Increasing the high school graduation rate should be a national priority in education reform (Rumberger, 2011a & 2011b). As described in detail by Duncan and Murnane (2011), the high school graduation rate in the U.S. has stagnated since the 1970s, such that the U.S. rate ranks 19th across the OECD. According to recent estimates, more than 12 percent of American citizens (i.e. 28 million) age 18 or over is a high school dropout (Institute of Education Sciences, 2011; Rumberger, 2011b). There are large racial, ethnic and gender gaps in graduation, with many dropouts clustered in so-called ‘dropout factories’, and there is significant variation across states, both in levels and trends of the graduation rate (Duncan & Murnane, 2011).
The economic and social consequences of dropping out of school have long-term negative effects both for dropouts themselves and for society as a whole. Belfield et al. (2012) estimated the cost of lost economic opportunities as well as fiscal costs from foregone tax revenues, and additional public costs such as crime and higher public health and welfare costs of so-called “opportunity youth,” at $258,240 per youth, over a lifetime in present value, and the cost to society at $755,900. These can be viewed as the amount of a certif-icate of deposit in 2011 that would generate these returns over a lifetime.
To be effective, programs intended to reduce dropouts must address the underlying cause of dropping out of school. According to Rumberger (2011b, p.7), dropping out of school is mainly induced by two sets of factors: first, “individual factors,” such as attitudes and behaviors of individual students, and their prior ed-ucational experience and academic performance; and second, “contextual factors,” including family back-ground, school characteristics, and community and peer factors. In particular, Rumberger emphasizes the critical role of school factors in influencing dropout behaviors. He makes the distinction between two ways of withdrawing from school: “voluntarily” dropping out due to poor grades and attendance, and “involun-tarily” dropping out due to school policies that directly lead to suspensions, transfers, and expulsions (Rum-berger, 2011b, p.10).
Over the past few decades, federal, state, and local governments have attempted to reduce dropout rates and raise graduation rates through targeted programmatic interventions to provide additional support to students at risk of dropping out, institutional interventions designed to strengthen schools and commu-nities, and broad-based efforts to increase instructional effectiveness of high schools and raise academic achievement across the board. These efforts have yielded mixed results, in part because they tend to be modest in scope (Rumberger, 2011a). Also, many initiatives are implemented in ways that do not allow for a rigorous evaluation, either because they are part of a suite of reforms or because they do not allow for students to be followed over a long enough time horizon (Duncan & Murnane, 2011). Even where existing studies on dropout prevention have examined the effectiveness of the interventions, very few have incorpo-rated cost-effectiveness analysis.
Our Approach
Our original goal for this report was to conduct cost-effectiveness analyses of effective “Dropout Prevention” programs with existing evaluations that have been reviewed by the What Works Clearinghouse (WWC) of the U.S. Department of Education’s Institute of Education Sciences (http://ies.ed.gov/ncee/wwc/). The WWC is a national database of research reviews on the effectiveness of rigorously evaluated interventions in 15 different topic areas. The WWC has established a protocol for evaluating research and it summarizes the evidence from studies that meet reasonable standards of validity, as per its WWC Procedures and Standards Handbook (2008). Thus, we can be confident that the estimates of effectiveness have high internal validity. Dropout Prevention is one of the 15 education topics covered by WWC and 13 of 28 reviewed dropout prevention interventions are listed as having positive or potentially positive impacts on at least one of three different outcomes: completing school, progressing in school and staying in school. As cost-effectiveness analysis is only possible when the alternatives being considered address the same outcome, we focused on the outcome of completing school. Five of the effective programs were found to help students complete school by obtaining a high school diploma or a GED (General Educational Development diploma, General Education/Equivalency Diploma, Graduate Equivalency Degree). These programs are: Talent Search, JOB-START, New Chance, National Guard Youth ChalleNGe (NGYC), and Job Corps. We demonstrate cost-ef-fectiveness analysis for each program.
We recognize that an evaluation of the cost-effectiveness, or indeed the effectiveness, of these five pro-grams is not strictly an apples-to-apples comparison. The goals and intended outcomes of these propro-grams are not identical, even within the class of dropout prevention programs. Ideally, a fair comparison of cost-ef-fectiveness would compare programs targeting similar populations of students in similar settings, yet these five programs vary across these dimensions. In addition, the cost data for each program are not available in a consistent form.
Notwithstanding these challenges, we present cost-effectiveness comparisons across the five programs. The actual estimates are useful as very approximate indicators of the resources required to yield extra high school graduates. But we caution against ranking these programs in terms of relative cost-effectiveness. The results are derived so as to illustrate the methodological issues for cost-effectiveness analysis. This pre-sentation of cost-effectiveness ratios allows us to perform a methodological critique of cost-effectiveness analysis within the context of a research field that has focused primarily on effectiveness.
Structure of this Report
We begin by describing the cost-effectiveness method and consider some key practical challenges in its application. Next, we review the educational interventions that have been identified by WWC under the domain ‘Dropout Prevention’. This review prompts us to focus on the one program that targets students still in school and for which no cost analysis exists – Talent Search. For this intervention we collect direct information on the ingredients used for this program at five different sites in Texas and Florida, assign costs based on national prices, and relate these to the pre-existing effectiveness evidence on Talent Search. We are able to compare the five sites in terms of cost-effectiveness.
For the other four programs that WWC identifies as improving school completion – JOBSTART, New Chance, NGYC and Job Corps – we draw on the extant data on costs and effectiveness to derive cost-effec-tiveness ratios. Because the cost data in each case is collected using different methods, none being the in-gredients method, and appear to be based on local prices rather than a common set of national prices, these ratios are only illustrative of the cost-effectiveness method and should not be used for ranking the
programs by efficiency. We also include two early childhood interventions with pre-existing costs and ef-fectiveness data, again for the purposes of illustration and comparison. Finally, we conclude our report by discussing the implications and applications of our research for policymakers, researchers, and education professionals.
2. METHOD AND PRACTICE
Cost-effectiveness analysis is a decision-oriented method of inquiry. The decision-maker’s first task is to determine which educational outcome is to be pursued. In the case of the interventions reviewed here, the outcome of interest is increasing the rate of high school completion. Reforms and interventions can then be evaluated insofar as they improve that outcome and at what cost. The purpose of this report is not to re-view how improvements in high school completion are identified (e.g., through a field trial or correlational study) but to focus on the cost analysis and how cost data can be combined with existing effectiveness data to yield cost-effectiveness metrics to be used in decision-making.
Collection of Cost Data
Many evaluators and educators believe, naively, that the best method of gathering cost information is to rely on available budgets. There are many reasons why budgets are inadequate, indeed inappropriate, for determining costs (Levin & McEwan, 2001, pp. 45-46). Beginning with the definition of cost, the accepted standard in the field of economics is the concept of “opportunity cost”, i.e., the value of what is sacrificed when a resource is directed to one use rather than its most valued alternative use. Educational interven-tions use personnel, facilities, materials, equipment, and other resources that we term “ingredients”. Each of these ingredients has value in some best alternative use, and that is what we are giving up or sacrific-ing. Educational accounting and school budgets are not predicated on measuring costs in this way. Harris (2009) provides clear examples of how budgetary costs in education settings can fail to account for both opportunity costs and benefits of programs: in his analysis of the cost-effectiveness of the Abecedarian early childhood program, he demonstrates that accounting or budgetary costs of the program do not consider the financial gains to parents who are able to work whilst their children attend the program. In another ex-ample, he notes that the increased demand on parental time to facilitate implementation of the Success for All program results in budgetary costs underestimating the true costs of that program.
In contrast to cost accounting, the overriding concern of budget reporting in education is to establish transparency in how money is spent, primarily for auditing purposes. Often, capital improvements that last many years are charged to the budget in the year that the improvement is made or over a fixed time period based upon the payment terms of a bond rather than being spread out over all the years of serviceability of the ingredient. For example, a school building may be paid for over a period of 10 years but may have a usable life of over 50 years. A costs analysis would spread the costs over the serviceable life while school ac-counting practices would spread them over a shorter period, typically the period of financing repayment. Also, resources that are received from non-school sources (such as volunteers, gifts, use of facilities be-longing to other agencies) are often not accounted for at all. In some states the pension system for schools is charged to the state and does not appear as a cost in local school budgets. There are many other such anom-alies as well as the difficulties in linking line-item budgets based upon “functions and objects” to particular educational programs and interventions. For these reasons and many others, we use a different approach, which we believe has been honed successfully since its introduction in 1975 (Levin, 1975) and developed more fully in subsequent publications (Levin, 1983; Levin & McEwan, 2001). This is known as the “ingre-dients” approach. Other researchers have adopted similar methods. For example, Chambers and Parrish (1994a, 1994b) describe the “resource cost model” which follows similar procedures. By accounting for the ingredients used in a program or intervention, most errors of omission or cost distortion can be avoided.
The Ingredients Approach
The purpose behind the ingredients (or resource) approach is to account for the cost of all of the resources required to implement the particular educational intervention being evaluated irrespective of their source. By focusing on ingredients, this approach begins not with a budget, but with the details of the intervention and its resource requirements. Only after establishing a systematic specification of the ingredients that are used to produce a particular educational outcome of interest, do we attempt to measure the costs of these ingredients. In general, market values are used to assess opportunity cost, although other methods may also be necessary such as estimation of “shadow” prices.1 This enables an overall measure of costs for the intervention that can be compared with the costs of other options by using common methods of estimating costs across different interventions.
The ingredients approach to cost estimation entails three distinct phases: (a) identification of ingre-dients; (b) determination of the value or cost of the ingreingre-dients; and (c) an analysis of the costs in an appro-priate decision-oriented framework, e.g., based on cost burden across various agencies; at different levels of scale; adapted for different geographical locations or modes of implementation. A detailed example of how the ingredients approach is used is given in Levin, Catlin, and Elson (2007).
Identification of Ingredients
The identification of ingredients refers to the delineation of all of the resources required to implement a particular intervention relative to an alternative (typically the status quo). For educational programs, the main ingredient is often labor services of which the largest component is that of the teacher. But, facilities, equipment, supplies, outside services, and many other ingredients may be used, and these must be identi-fied and measured. Educational interventions use not only these resources but also the time of the students who might otherwise be able to use their time productively in the workplace. If a student is required to spend four additional years in the educational system, those years could have been used for other produc-tive activities that, when foregone, have a cost to the individual and society. Also, students may be used as inputs in helping deliver interventions, such as peer tutoring, to other students. Hence, student time may be an important ingredient in economic analysis, particularly if it entails student participation beyond the years or daily schedule required of compulsory schooling.
Because the detailed ingredients provide the most fundamental units for ascertaining costs, an attempt is made to measure them as accurately as possible in terms of both quantity and quality. Thus, it is usually important to know not only the role or function of a personnel ingredient, but also the skill, education, and experience required to carry out the job in order to determine what such an input or ingredient will cost. This information may be collected from various sources. Reports, articles, Web sites, and narratives on im-plementation of the intervention may serve as an initial basis for constructing an ingredients spreadsheet listing type and quantity of every resource. In some cases, the developer’s program specifications may be used. This can be followed by conducting interviews and soliciting questionnaire responses from key per-sonnel implementing the interventions. The interview protocols or survey instruments must be designed for each specific intervention. Finally, direct observation of the intervention may be an appropriate way to identify ingredients or confirm that nothing has been missed.
1 Where a market does not exist for an ingredient, e.g., a unique facility or a staff member with unusual talents, a shadow price is developed on the basis of market or other assumptions. See Levin and McEwan (2001, Chapter 4).
If a program that is implemented in many sites is evaluated for effectiveness by choosing a limited sample of sites, ingredients and their costs should be determined for those particular sites. Despite the use of generic titles for interventions, implying that they are all identical, specific sites may implement them in different ways and using resources that vary in quality and quantity from site to site. To the degree that there are site differences in effectiveness, it should be possible to relate those disparities to differences in ingredients and costs. Sensitivity analyses can be performed to estimate how these costs and the resulting cost-effectiveness ratios might vary at other sites under given assumptions.
Costs of Ingredients
Once ingredients have been identified and stipulated, the next step is to ascertain their prices. All ingredi-ents are assumed to have prices, including donated or volunteer resources, because all have alternative uses that have value. A crucial requirement for costs analysis is that the cost estimates must be comparable. This is achieved by ensuring the cost estimates are based upon a uniform method of estimation, one of the pur-poses of using the ingredients approach. For example, different educational interventions that are evaluated are often initiated in different locations and in different years. Some parts of the country and some localities have lower prices than others for some ingredients and higher prices for others. For example, the average teacher salary in New York State is $57,354 compared with $38,284 in West Virginia (http://teacherportal. com/teacher-salaries-by-state). Moreover, prices can change over time with market shifts, e.g., depending on the supply of qualified teachers or principals, and general price level changes. These conditions are not intrinsic to the educational intervention. For this reason, cost-effectiveness comparisons of different inter-ventions should use a standard set of prices, usually a national average for each ingredient in a common year. This enables a comparative measure of costs that is not biased by location or timing. Standardized “national” prices for each ingredient can be obtained from recognized data sources or computed based upon multiple sources of information or shadow prices. Prices are often standardized to the latest year for which the major national databases provide data in order to account for inflation. Of course, the user of a report on cost-effectiveness can insert the prices that are pertinent to a particular location and year when doing a cost-effectiveness analysis for a state or locality because the method is transparent with respect to the ingredients required.
Ingredients can be divided into those that are purchased in reasonably competitive markets and those obtained through other types of transactions. In general, the value of an ingredient for costing purposes is its value in the competitive marketplace. For personnel, the market value may be ascertained by deter-mining the costs for hiring a particular type of person, including salary, fringe benefits, and other em-ployment costs. Many ingredients can be costed out from their respective market prices. In general, these will be market price averages for the nation taken from national data indices. Such data are available for per-sonnel from the periodic reports of the U.S. Department of Education, and especially the National Center for Educational Statistics, and publications of the American Federation of Teachers and the National Edu-cation Association. Materials and equipment can also be costed using market prices.
Cost data on facilities may be obtained from publications on school construction and on annual leasing costs for space with appropriate characteristics. Capital inputs are converted to annual costs by taking ac-count of depreciation and interest on the undepreciated portion of investment. Some capital resources are not purchased directly in competitive markets. For example, additional facilities may be obtained by using more space in an existing building which is “owned” by a school district or which is provided by another government agency. No financial transaction occurs, but this resource use must still be accounted for as if the space had to be rented in the private market. Finally, volunteer time or in-kind contributions are not
made via market transactions, so shadow prices are used. For volunteers, the shadow price is the oppor-tunity cost of their time, which is typically based on the value of the services that they provide.
The cost values of all identified ingredients are accounted for, regardless of their source of finance or in-kind support. It is important to cost out all the ingredients necessary for the intervention and to do so in a neutral way that does not favor interventions taking place in areas where prices are relatively low. The duration of the intervention must also be taken into account. Educational interventions vary significantly in length, from a few days (e.g., teacher professional development) to multiple years (e.g., leadership pro-grams). Yet, often the effectiveness measures are reported per intervention as if these are comparable. Thus, it is essential that costs analysis clarify the duration of each intervention and accounts for the cost burden over the entire period of the intervention.
Cost Metrics
The outcomes of the cost analysis are cost metrics for each intervention expressed as: a total cost for the intervention at the level of scale studied, i.e., across all sites; a cost per site when site-by-site data is available; and an average cost per student receiving the intervention. These costs should be calculated as incremental costs, i.e., taking into account resources utilized by the intervention beyond those utilized for “business-as-usual”. For some interventions, students who do not participate may still gain access to alternative educa-tional resources. If so, these alternatives need to be costed to allow determination of the incremental costs of the intervention.
Each of these metrics serves a particular purpose for comparing interventions. The total cost metric is used to inform decision-makers of the scale of the intervention, which may be particularly pertinent to de-cisions if there is a funding constraint. The average cost metric yields an easier comparison between in-terventions and may be useful when considering the equity of investments across subgroups of students.
Cost metrics per site are also very useful. Studies of effectiveness often report one effect size pooled across sites, despite the fact that implementation at different sites may result in different levels of effec-tiveness and costs. Pooling across sites is often performed in order to create a large enough sample to allow statistically significant effectiveness results to be shown or to allow analysis of sub-groups. In reality, however, the program might be better implemented and employ more resources at some sites, and these sites may have better outcomes. These differences are masked in the pooled estimate. Similarly, meta-analysis is often used to generalize about effects across different studies, sites, and versions of an inter-vention. Meta-analytic evaluations yield an “average” effect size across multiple studies that each relies on what appears to be a similar approach to evaluate a particular intervention. Both pooled and meta-analytic evidence is problematic for cost-effectiveness analysis because it does not allow for accurate matching of the costs of a specific implementation with the actual effectiveness at each site. A large effect size at one site might be due to the fact, unobserved in meta-analytic studies of effectiveness, that this particular site used considerably more resources for the same intervention than another site. Consequently we recommend, wherever possible, disaggregating effectiveness results to individual sites so that effect sizes for the indi-vidual sites can be matched with costs for each specific implementation of the intervention.
Using Cost Analysis in a Decision-oriented Framework
The initial aim of a cost analysis is to provide comparable cost estimates across different interventions, or across different sites implementing the “same” intervention. A later aim is to adapt the standardized find-ings to apply to situations encountered by different policymakers in varying educational jurisdictions. Most
educational decision-makers will be found at state and local levels so that the initial cost analysis should be adjustable to reflect local prices in the decision-maker’s geographical location. Ideally, the cost analysis should be designed to indicate how the cost burden is distributed, or “who pays”, among school districts, other government agencies, private entities, volunteers and other providers of in-kind resources, and clients or users of the program. This allows a decision-maker to assess the burden that will fall on his/her particu-lar budget, given the particuparticu-lars of education cost sharing in his/her jurisdiction. Different interventions may reflect different patterns of cost-sharing and different cost-effectiveness implications for each of the cost-bearing constituencies or decision-makers.
In some instances, the policymaker’s concern is with the costs of expanding the use of an existing inter-vention. For example, if a school district has already implemented a dropout prevention program for 11th- and 12th-grade students who had missed more than 30 days of school in the previous year but wanted to expand the program to include students missing more than 15 days of school, the district education agency would want to know the marginal or new costs involved in targeting these additional students, as opposed to the average cost per student. To address such questions involving a change in the scale of an intervention, costs must be distinguished as fixed or variable. In this situation, the marginal costs of the intervention can be determined by considering only the variable cost component of ingredients. In general, those inter-ventions with high fixed costs such as those with large investments in facilities and equipment (e.g., estab-lishing computer laboratories) will require a high enrollment or utilization to be most efficient. In contrast, interventions that are constituted largely of variable costs such as personnel (e.g., after-school tutoring) will have costs that are less sensitive to the scale of output. Thus, an economic evaluation of alternative inter-ventions that differ in terms of their intensities of fixed versus variable costs may produce very different av-erage and marginal cost results depending on the scale of enrollment or output. Therefore, it is advisable to compare interventions of similar scale.
A related analysis could estimate how many additional high school graduates or other units of educa-tional outcome can be expected for a fixed monetary investment in a program. This analysis would be useful when the budget is limited and decision-makers need to determine how to maximize their return on in-vestment. In this circumstance, decision-makers would choose the intervention that provides, for example, the greatest increase in high school completion but still falls within their budget limit.
Cost-Effectiveness Analysis
Once the cost metrics have been calculated, a cost-effectiveness ratio is derived. This ratio is calculated as the cost divided by the effectiveness. For example, if a program costs $2 million and yields 100 extra high school completers above and beyond what would be expected from a valid comparison group, the cost-effectiveness ratio is $20,000 per extra completer. This ratio shows the cost of “buying” an extra completer. Lower cost-effectiveness ratios are preferred - if the program yielded 200 extra completers the cost-effective-ness ratio would be $10,000. This ratio may be helpful because it can be easily related to the value of the program – specifically, whether it is worth spending $20,000 to “buy” an additional completer.
Alternatively, the ratio may be expressed by dividing the measure of effectiveness by the cost figure to provide a gain per dollar spent. For the above example, this ratio could be expressed as the yield of extra completers per $100,000 spent, which is 5. Therefore, the intervention generates 5 extra high school com-pleters for every $100,000 spent. This ratio is helpful when there is a financing constraint (e.g., if the dis-trict can only spend $1 million). In addition, when a program evaluation includes multiple sites some of which show negative effects, i.e., the treatment group actually yields a smaller percentage of completers than the control group, a traditional cost-effectiveness ratio may be impossible to interpret for these sites.
Indeed, it would not normally be worth calculating a cost-effectiveness ratio for an ineffective program as it should not remain a policy option. If, however, it is desirable to show a ratio for all sites in an evaluation for comparative purposes and to show the possible range, presenting the number of graduates “lost” for every additional $100,000 spent is a feasible strategy. Thus, this alternative metric is useful and can be presented alongside the cost-effectiveness ratio where appropriate.
Cost-effectiveness ratios should be tested for sensitivity to see how robust the results are to alternative modeling assumptions. Boardman, Greenberg, Vining, and Weimer (2011) recommend three types of sen-sitivity analysis: best and worst case sensen-sitivity testing, which places extreme bounds on the results; pa-rameter variation sensitivity testing, where the most influential variables in the model are changed; and Monte Carlo simulation, where the distributions of variables are incorporated into the model.
The primary purpose of cost-effectiveness ratios is to compare interventions. If there are implemen-tations at multiple sites, the cost-effectiveness of the intervention according to the version implemented at each site can be ranked for its efficiency in use of valuable resources. Where there is more than one in-tervention addressing a particular outcome, the ratios can be compared across all the inin-terventions. Con-tinuing the above example, imagine that a second intervention aiming to increase graduation has a total cost of $5 million and yields 200 extra graduates. This intervention is more effective, but the higher cost renders the comparable cost-effectiveness ratio less favorable ($25,000), i.e., it costs more to obtain an extra high school completer. Cost-effectiveness comparisons do not have to be limited to one type of approach or reform. For high school completion, for example, one can compare interventions based upon diverse ap-proaches such as coaching, curriculum, technologies, professional development, grouping practices, coun-seling, and extended time. It is, however, critical that outcome measures are comparable and that ideally they are measured at a similar point in time (e.g., earning a high school diploma by age 18).
Principles and Practices for Cost-Effectiveness Analysis
Although the method of cost-effectiveness analysis is straightforward, practical application may be chal-lenging, especially when “retrofitting” costs collected currently to pre-existing effectiveness estimates. Gath-ering cost data retrospectively to combine with pre-existing data on effectiveness for cost-effectiveness com-parisons is not the most accurate or parsimonious way of incorporating costs into the evaluation process. Many interventions are described generically based on the theory of action and what is intended to take place and provide little or no actual details on the resources that were used. Interviews of program person-nel may not yield an accurate record of ingredients if considerable time has passed since the evaluation. Even if the intervention continues to operate, it may have changed over time precluding the use of current observational data to determine the resources used at the time of evaluation. Substantial effort and multiple sources are likely to be needed to reconstruct the ingredients requirements of an intervention evaluated more than a few years in the past. We believe that by incorporating the ingredients method at the time of implementation of the intervention, the costs can be obtained with greater accuracy and less effort.
However, since most interventions do not provide accurate detail on ingredients, a second strategy is to attempt to reconstruct the resource base for interventions that were evaluated for effectiveness in the past and combine these with effect measures for comparison. In a few cases, costs have been estimated at the time of implementation, and reported with effectiveness measures. However, rarely is the methodology for estimating costs reported in adequate detail to know on what it was based or to know if it is comparable with costs of other alternatives. That is, we do not know if all ingredients were included or what prices were used or whether this is simply an “estimate” from a budget or a business manager who is not a cost accountant. In order to facilitate the ability of evaluators to take advantage of existing effectiveness data and existing cost
data, we review in this section challenges we have encountered in our own such attempts and how we ad-dressed them in order to conduct retrospective cost-effectiveness analyses.
Interventions may only be compared in a cost-effectiveness analysis if they measure at least one outcome in common. Of course, this is also true of effectiveness comparisons. Assumptions about the equivalency of outcomes need to be reviewed carefully. Indeed, many ‘dropout prevention’ programs have goals beyond completing high school such as increasing employability and earnings or improving health status and re-ducing crime. In these cases it is usually impossible to disentangle costs associated with one outcome from the costs associated with other outcomes. If performance on only one outcome, e.g., high school com-pletion, of such multi-outcome programs is singled out for comparison with performance of programs which target that single outcome only, the multiple goal programs may appear unduly expensive because they are devoting their resources to much more ambitious endeavors than the single goal. Such an analysis does not reflect the fact that other desirable outcomes may also be obtained by the multi-goal programs. In such instances, cost-benefit analysis may be the most effective way to compare the programs.
It is also important to consider whether the interventions serve similar populations of students in similar settings, are delivered at similar scale, and are funded at similar levels. Each of these factors may affect both costs and effectiveness of a program and they almost certainly influence the decision-making process. To make a viable comparison, similarity in each of these characteristics is desirable. Yet, it is often hard to find programs that are genuine alternatives to each other and so may be meaningfully compared. Note that these challenges arise for a proper comparison of effectiveness, not just cost-effectiveness.
There are also challenges in interpreting the effectiveness of a program and linking this effectiveness measure to the appropriate costs. We identify four main challenges, noting that these arise even where there is only one effectiveness outcome being measured.
First, some interventions may have been evaluated through multiple studies, each showing different re-sults and effect sizes. However, pooling rere-sults from multiple studies is problematic for cost-effectiveness analysis because it is likely that the cost of implementing the intervention has varied across studies. More resource-intensive implementations of the intervention are more likely to be more effective. Hence, the cost-effectiveness ratio from pooled results may be a biased estimate of the overall cost-effectiveness of the intervention. We recommend calculating cost-effectiveness only when individual effectiveness studies can be matched up with costs of the specific implementation(s) evaluated. We also suggest only using studies that employ randomized control trials or strong quasi-experimental designs, ideally conducted by researchers independent of the development and implementation of the intervention. In addition, only those studies with results that are statistically significant at the p<0.05 level should be considered. When more than one study is available that satisfies these criteria, the cost-effectiveness ratios calculated for each one can be used to present a range of cost-effectiveness values for the intervention in question, ideally ac-companied by some insights as to how variations in implementation or other factors account for variations in the ratio.
Second, some evaluation studies report on multiple sites implementing the same program. In these cases, some sites appear to be effective while others are ineffective. As with multiple studies, the question arises as to which sites best represent the impact of the program for a cost-effectiveness analysis. Cost-ef-fectiveness can be presented for the overall group and also for the subset of effective sites to show how the program in question compares with other programs when implemented optimally. Alternatively, if only some sites show statistically significant differences in outcomes for the treatment group compared with the comparison group (either positive or negative), another analysis can include only those sites as opposed to including all sites. We recommend presenting a number of different such analyses so that a policymaker can choose the analysis that makes most sense in his or her context.
A third challenge arises because effectiveness research typically distinguishes between study partici-pants who are assigned to the intervention and those who actually participate in the intervention. For exper-imental studies, it is important to determine whether the evaluation includes all participants assigned to the treatment group, regardless of whether they actually attended the program (the Intent to Treat or ITT obser-vations), or only those who actually participated in program activities (the Treatment on the Treated or TOT observations). Our preference is for cost-effectiveness analysis based on the TOT observations although the implications for ITT cost-effectiveness should also be explicitly considered.
Although interventions are typically allocated resources based on the ITT observations, these resources are actually used on the TOT observations. Where fewer students participate than expected (i.e. there are fewer TOT observations than ITT observations), resources are often not returned to the funding agency but instead are spread across the participants. The intervention is therefore more resource-intensive per partic-ipant. Critically, it is the actual resources used that will determine effectiveness.2 In contrast, it may be hard to know how many resources would have been spent on the ITT individuals (or at least the subgroup who did not participate).
It is unclear how the decision to use ITT vs. TOT observations will drive the cost-effectiveness results. Clearly, TOT effectiveness is likely to be greater than ITT effectiveness, as in the former case the impact is only measured for those students participating in program activities. But TOT estimates may introduce an upward bias in effectiveness because those individuals assigned to treatment who actually show up to par-ticipate in the program are likely to be more motivated than those who do not. An ITT comparison elimi-nates this bias. However, the per-participant costs for TOT will also be higher because the total cost of the program is divided by fewer observations so it is not clear which way the cost-effectiveness results will move as the analysis is changed from TOT to ITT.
The final challenge relates to the incremental nature of programs in generating outcomes. Most pro-grams assign resources to an intervention above and beyond some amount already being spent on the target population. For example, a dropout prevention program in high school uses incremental resources beyond regular instructional resources, but these regular instructional resources may also help prevent dropouts. Thus, the program is only an increment to what is already being spent. Another example is a boot camp: dropouts participate in the camp and receive all the resources of the boot camp but the costs should measure only the incremental resources beyond what the participants receive. Potentially, these non-participants may be enrolled in other training programs, receive welfare, or re-enroll in school. The cost-effectiveness of the boot camp depends on its incremental cost-effectiveness and its incremental costs – both effects and costs must be expressed incrementally. However, in most studies we find that the resource use of the non-participants is not calculated. Failure to measure incrementally is likely to bias interventions toward lower cost-effectiveness.
Each of these four challenges has implications for cost analysis: cost data should be collected in a way that is consistent with how effectiveness is measured. Thus, cost data should be collected based on the actual implementation of the intervention from which the effectiveness data is derived. Where there are multiple sites, cost data should be collected for the actual sites for which effectiveness data are presented in order to determine what resource use is required to obtain observed levels of impact. When trying to collect cost data retrospectively to match to pre-existing effectiveness data, this is possible only when sites
2 For example, if the ITT observations are 2,000 and the intervention has a budget of $1 million, then the unit cost is $500. If there are only 1,000 TOT observations, the unit cost is likely to be $1,000 because the agency will spend the entire $1 million. Therefore, the intervention’s effectiveness reflects $1,000 of resources per participant.
are identified by name. In evaluations where site identities are not provided in order to protect anonymity, this is not possible unless permission is obtained from the requisite authorities to identify the sites for the purposes of data collection. Cost data should be collected with cognizance as to what resources are allocated to participants who are actually treated, as distinct from the resources allocated to those whom the inter-vention is intended to treat. Finally, cost data should be calculated with respect to the incremental resources of the program relative to what would be allocated under the status quo.
All these practical considerations lead us to emphasize the need for cost data to be collected alongside and contemporaneously with the effectiveness evidence. Caution is required when trying to cost out pro-grams with effectiveness results older than around five years.3 If the program still exists today and therefore remains a viable policy option, significant changes in the way the program is delivered now from when it was evaluated would render those effectiveness results inapplicable to the current day. Conversely, any cost estimates based on current programming may be inapplicable to an evaluation conducted years ago. If, however, the program remains largely unchanged, costs collected today and matched with the older evalu-ation results may still yield useful cost-effectiveness data. Nevertheless, even if the program is unchanged, collecting cost data at a much later date is challenging because archival records showing the personnel, fa-cilities, material, equipment etc. employed in delivery are often not available or detailed enough and inter-viewing current personnel is likely to yield inaccurate memories of past program implementation. All these challenges heighten the need for sensitivity analysis to check the robustness of the results of a cost-effec-tiveness analysis.
While we recommend the use of the ingredients method as the basis for conducting a cost analysis, re-searchers use other methods, some of which are similar and some of which differ significantly. In all cases, the methods used for collecting this data should be presented as fully as for the methods employed for col-lecting effectiveness data so that the reliability of the data may be ascertained. In order to present a fair cost-effectiveness analysis of a group of alternative interventions addressing the same outcome, it is nec-essary for the costs to be collected in a consistent manner in each case, just as we would expect for the ef-fectiveness data.
Application to Dropout Prevention
Within the dropout prevention topic area, WWC has identified and fully reviewed 13 interventions with positive or potentially positive effects. These interventions, listed in Table 2.1, are categorized by WWC into three outcome areas: completing school (graduating from high school or earning a GED credential); progressing in school (moving up a grade); and staying in school across any grade. Our focus is on the first of these three outcomes: it is the strongest outcome (in terms of attainment) and accords with a general understanding of what dropout prevention programs should do. Improvements in the latter two outcomes – progressing and staying in school – are necessary but not sufficient for a student to complete high school. Also, it is not possible to equate the binary outcome of completing school directly with grade advancement in the progressing in school outcome. To do so would require assigning a probability to completing school conditional on progressing in school and that probability is uncertain.
3 For example, McConnell and Glazerman (2001, p.2) describe the operation of Job Corps as “complex, with multiple layers of administrative accountability, several distinct program components and numerous contractors and subcontractors.” Obtaining retro-spective data under these conditions, which are almost certainly not exclusive to Job Corps, is therefore extremely difficult.
Table 2.1
WWC Dropout Prevention Interventions with Positive or Potentially Positive Effects Completing School Progressing in School Staying in School Talent Search C New Chance C
National Guard Youth ChalleNGe
(NGYC) C
Job Corps C
JOBSTART C
Achievement for Latinos with
Academic Success P S
Career Academies P S
Check and Connect P S
High School Redirection P
Talent Development P
Accelerated Middle Schools P S
Twelve Together S
Financial Incentives for Teen
Parents S
Source: What Works Clearinghouse, retrieved June 2012 at http://ies.ed.gov/ncee/wwc/Topic.aspx?sid=3. Notes: C = positive effects for completing school outcome; P = positive effects for progressing in school
outcome; S = positive effects for staying in school outcome.
WWC identifies five interventions that have evaluations showing improvements in the completing high school outcome: Talent Search; JOBSTART; New Chance; NGYC; and Job Corps. These interven-tions differ in many ways such as scale, target population, duration, nature and intensity of services pro-vided, nature and timing of outcomes sought and definition of school completion. One is an extant national add-on program that complements existing schooling for students who are expected to finish high school and attend college (Talent Search); two were limited-period demonstration programs for youth who had dropped out of school and needed job training and other life skills (JOBSTART and New Chance); two more are extant, intensive residential programs also targeted at youth who have already dropped out of school and need significant additional services beyond educational interventions (NGYC and Job Corps).
In addition to varying program characteristics, the definition of school completion is not uniform: in some programs students are motivated to pass the GED; others help students graduate from high school while yet others do both. While the economic consequences of earning a GED are different from earning a high school diploma, most studies of these programs combined the two outcomes as if they were equiv-alent such that we could not analyze them separately. Treating GED receipt as equivequiv-alent to high school completion with a diploma is problematic because there is substantial evidence that the economic benefits from possessing a high school diploma far exceed those from possessing a GED (Tyler & Lofstrom, 2009; Cameron & Heckman, 1993; Heckman, Humphries, & Mader, 2010; Boesel, Alsalam, & Smith, 1998).
More fundamentally, the intended outcomes of the programs were not unidimensional: all programs had multiple goals beyond high school completion, for example to increase employability and earnings. These other outcomes are more effectively captured in cost-benefit analyses. The five programs also target different student groups. Talent Search is the only program targeting students still in school, starting in some cases as early as 6th grade, with the primary goal of helping students who appear to be on track to graduate apply to and attend college. The other four programs all target populations of youth who have al-ready dropped out of school, and New Chance more narrowly targets young mothers. Hence, Talent Search is not directly comparable with the other four interventions in two important respects. First, it is not di-rected at the same student population. Second, Talent Search is incremental, i.e., it is an add-on program beyond the services students receive from their high school, in contrast to the other stand-alone programs.
The programs also differ with respect to cost data. As explained previously, ideally costs for each of the programs would have been collected at the time of the effectiveness evaluations using the ingredients method (Levin & McEwan, 2001) and then combined with the effectiveness data to provide cost-effec-tiveness ratios. For four of the programs, JOBSTART, New Chance, Job Corps and NGYC, cost data were collected either during or after the impact evaluations. Although the availability of cost data is in itself laudable (and not typical), none of these four cost studies used the full ingredients method. Below we discuss how the methods used differ from our recommended method. In the case of Talent Search, no pre-existing cost analysis was identified, and so we undertook a full ingredients method approach to collect these data ourselves.
All these differences greatly restrict our ability to make comparisons across dropout prevention inter-ventions. Overall, for the topic of dropout prevention, two of our key assumptions for cost-effectiveness analysis have not been validated. These key assumptions were that we would find “families” of interven-tions addressing the same outcome and that the evaluainterven-tions were done recently enough that we could get information through archives and interviews to identify ingredients. In practice, we have not found terventions that show effects where we can make “apples-to-apples” comparisons, or studies of these in-terventions that allow determination of the ingredients with a reasonable degree of accuracy. It is worth emphasizing that, in conducting a cost-effectiveness analysis, often the problems arise in finding studies with comparable measures of effectiveness or detailed enough implementation data to identify ingredients. The many variations we identified among the five programs, their cost studies and effectiveness evaluations precludes the presentation of an array of fully comparable cost-effectiveness ratios.
Our analysis is therefore shaped by these methodological and practical considerations in two main ways. First, we have conducted a detailed site-by-site cost-effectiveness analysis of the Talent Search program, col-lecting ingredients data by interviewing directors of extant sites. This allows us to present cross-site cost-ef-fectiveness ratios that may reflect implementation differences at these sites or differences in populations being served such that some are more likely to benefit from the program services than others. Given Talent Search is a large-scale program with a long history, this cost analysis, which is the first to our knowledge, should be of interest in its own right. But our intent is to link costs with well-identified evidence on effec-tiveness. However, the impact evaluation of Talent Search reflects results of the program from 1995-2002. The collection of cost data in 2012 therefore presents significant challenges in providing an accurate costing of the implementations that produced the published effectiveness results. Site directors interviewed for this study, some of whom have worked with Talent Search for many years, indicate that the program has not changed significantly since the time of the evaluation. Our ingredients data may therefore reasonably reflect resource use at the time of the impact evaluations although subtle changes may have occurred which we are not able to capture given the time lapse. For example, while the same number of personnel may staff the
program, the level of competence may have increased or decreased over time as veterans gain knowledge of the program or as less experienced people replace personnel who move or retire.
Second, we present cost-effectiveness analyses for six other programs for comparative purposes. Four of these are listed by WWC as having positive or potentially positive effects on completing school– JOB-START, New Chance, Job Corps and NGYC – and cost data were extracted from existing reports. Two other programs are well-known preschool interventions - High/Scope Perry Preschool and Chicago Child-Parent Center - that have also been previously analyzed for costs and effects. The first four are broadly comparable amongst themselves, although quite different from Talent Search, while the latter two, well-known and much studied interventions, provide benchmark cost-effectiveness ratio comparisons. The goal of this pre-sentation is not so much to derive precise cost-effectiveness ratios for each intervention in order to rank them by efficiency, as to illustrate the many practical challenges of performing cost-effectiveness analysis within a decision-making framework.
For these cost-effectiveness analyses all money values are reported in 2010 dollars and are rounded to the nearest $10. For a price index we use the average across the CPI-U and CPI-W.4 The costs of the inter-ventions are not discounted with the exception of our analysis of preschool programs. Most of the interven-tions are less than one year or individuals participate for less than one year. Also, we do not discount the effects: new high school completers are all valued the same however long it takes them to complete. Thus, programs are not rewarded for being expeditious at getting students to complete high school, other than if this means their costs are lower. Finally, we reported cost-effectiveness from the social perspective, i.e., accounting for all resources identified regardless of which agency provided the funds for them, and we do not cost out the value of participants’ time in the program because participants are school age or have very limited income-earning opportunities.
4 Alternative indices for education prices, such as the Teacher Wage Index, the HEPI, and the HECA, yield very similar rates of inflation.