CEC Theses and Dissertations College of Engineering and Computing
2018
Novel Alert Visualization: The Development of a
Visual Analytics Prototype for Mitigation of
Malicious Insider Cyber Threats
Karla A. Clarke
Nova Southeastern University,[email protected]
This document is a product of extensive research conducted at the Nova Southeastern UniversityCollege of Engineering and Computing. For more information on research and degree programs at the NSU College of Engineering and Computing, please clickhere.
Follow this and additional works at:https://nsuworks.nova.edu/gscis_etd Part of theComputer Sciences Commons
Share Feedback About This Item
This Dissertation is brought to you by the College of Engineering and Computing at NSUWorks. It has been accepted for inclusion in CEC Theses and Dissertations by an authorized administrator of NSUWorks. For more information, please [email protected].
NSUWorks Citation
Karla A. Clarke. 2018.Novel Alert Visualization: The Development of a Visual Analytics Prototype for Mitigation of Malicious Insider Cyber Threats.Doctoral dissertation. Nova Southeastern University. Retrieved from NSUWorks, College of Engineering and Computing. (1049)
Novel Alert Visualization: The Development of a Visual Analytics
Prototype for Mitigation of Malicious Insider Cyber Threats
by
Karla A. Clarke
A dissertation submitted in partial fulfillment of the requirements for the degree of Doctor of Philosophy
in
Information Systems
College of Engineering and Computing Nova Southeastern University
ii
An Abstract of a Dissertation Submitted to Nova Southeastern University in Partial Fulfillment of the Requirements for the Degree of Doctor of Philosophy
Novel Alert Visualization: The Development of a Visual Analytics
Prototype for Mitigation of Malicious Insider Cyber Threats
byKarla A. Clarke June 2018
Cyber insider threat is one of the most difficult risks to mitigate in organizations. However, innovative validated visualizations for cyber analysts to better decipher and react to detected anomalies has not been reported in literature or in industry. Attacks caused by malicious insiders can cause millions of dollars in losses to an organization. Though there have been advances in Intrusion Detection Systems (IDSs) over the last three decades, traditional IDSs do not specialize in anomaly identification caused by insiders. There is also a profuse amount of data being presented to cyber analysts when deciphering big data and reacting to data breach incidents using complex information systems.
Information visualization is pertinent to the identification and mitigation of malicious cyber insider threats. The main goal of this study was to develop and validate, using Subject Matter Experts (SME), an executive insider threat dashboard visualization prototype. Using the developed prototype, an experimental study was conducted, which aimed to assess the perceived effectiveness in enhancing the analysts’ interface when complex data correlations are presented to mitigate malicious insiders cyber threats. Dashboard-based visualization techniques could be used to give full visibility of network progress and problems in real-time, especially within complex and stressful
environments. For instance, in an Emergency Room (ER), there are four main vital signs used for urgent patient triage. Cybersecurity vital signs can give cyber analysts clear focal points during high severity issues. Pilots must expeditiously reference the Heads Up Display (HUD), which presents only key indicators to make critical decisions during unwarranted deviations or an immediate threat.
Current dashboard-based visualization techniques have yet to be fully validated within the field of cybersecurity. This study developed a visualization prototype based on SME input utilizing the Delphi method. SMEs validated the perceived effectiveness of several different types of the developed visualization dashboard. Quantitative analysis of SME’s perceived effectiveness via self-reported value and satisfaction data as well as qualitative analysis of feedback provided during the experiments using the prototype developed were performed.
iii
This study identified critical cyber visualization variables and identified visualization techniques. The identifications were then used to develop QUICK.v™ a prototype to be used when mitigating potentially malicious cyber insider threats. The perceived
effectiveness of QUICK.v™ was then validated. Insights from this study can aid organizations in enhancing cybersecurity dashboard visualizations by depicting only critical cybersecurity vital signs.
iii
Table of Contents
Abstract ii List of Tables v List of Figures vi Chapters 1. Introduction 1 Background 1 Problem Statement 3 Dissertation Goal 9 Research Questions 15Relevance and Significance 16 Relevance 17
Significance 17 Barriers and Issues 18 Limitation 19 Delimitation 20 Definition of Terms 20 Summary 23 2. Review of Literature 25 Introduction 25 Cybersecurity 26 Cyber Analysts 31
Intrusion and Anomaly Detection 35
Anomaly Detection Techniques 40 Insider Threat Analytic Indicators 48
Information Visualization 54 IS Effectiveness 58
Summary of What is Known and Unknown 62 3. Methodology 64
Overview of Research Design 64
Instrument and Prototype Development 71
SMEs Identification of Cyber Visualization Variables 72
SMEs Identification of Visualization Technique for Cyber Variables 73 QUICK.v™ Prototype Development 74
Cybersecurity Analysts’ Effectiveness of the Prototype 75 Expert Panel 76
Reliability and Validity 77 Reliability 78
iv
Prototype Perceived Effectiveness 80 Population and Sample 81
Data Collection 82 Data Analysis 83 Resources 85 Summary 86 4. Results 92 Overview 92
Phase One – Expert Panel 92
Phase One - Data Collection 93
Phase One – Pre-Analysis Data Screening 93 Phase One - Expert Panel Characteristics 94 Phase One – Data Analysis 96
Critical cyber Visualization Variables Rank Order 103 Phase One – Comments 105
Phase Two – Expert Panel 106
Phase Two – Data Collection 106
Phase Two – Pre-Analysis Data Screening 107 Phase Two - Expert Panel Characteristics 107 Phase Two – Data Analysis 109
Phase Two – Comments 112 Phase Three – Expert Panel 113
Phase Three – Data Collection 113
Phase Three – Pre-Analysis Data Screening 114 Phase Three – Expert Panel Characteristics 114 Phase Three – Data Analysis 116
Phase Three – Comments 122 Summary of the Results 122
5. Conclusions, Implications, Recommendations, and Summary 132 Conclusions 132
Discussion 132 Implications 134
Recommendations and Future Research 135 Summary 136
Appendices
A. Qualitative Survey Instrument 1: Instrument for SMEs Identification of Cyber Visualization Variables (TEMPLATE): 142
B. Qualitative Survey Instrument 2 (TEMPLATE): Instrument for SME Identification of Visualization Technique for Cyber Variable 148
C. Quantitative Survey Instrument 3 (TEMPLATE): Instrument for Cybersecurity Analysts’ Perceived Effectiveness of the Prototype 155
v
E. Qualitative Survey Instrument 1 (FINAL): Instrument for SMEs Identification of
Cyber Visualization Variables 160
F. Qualitative Survey Instrument 2 (FINAL): Email to SMEs 165
G. Qualitative Survey Instrument 2 (FINAL): Instrument for SME Identification of Visualization Technique for Cyber Variables 166
H. Qualitative Survey Instrument 3 (FINAL): Email to SMEs 181
I. Quantitative Survey Instrument 3 (FINAL): Instrument for Cybersecurity Analysts’ Perceived Effectiveness of the Prototype 182
J. Developed Prototype QUICK.v™ (FINAL) 193 K. Institutional Review Board Exemption Letter 196 References 197
vi
List of Tables
Tables
1. Summary of Cybersecurity Literature 28 2. Summary of Cyber Analysts Literature 32
3. Summary of Intrusion and Anomaly Detection Literature 37 4. Summary of Anomaly Detection Techniques Literature 45 5. Insider Threat Analytic Indicators Literature 52
6. Summary of Information Visualization Literature 56 7. Summary of IS Effectiveness Literature 60
8. Modified SUS Statements 83
9. Mapping Adjectives Rating to StudyMean Quartiles 89 10.Demographic Distribution of the SMEs 95
11.Weight Allocations for the Two Relevant System Analytic Variables Selected 98
12.Weight Allocations for the Two Relevant Facility Analytic Variables Selected 99
13.Weight Allocations for the Two Relevant Business Capability Analytic Variables 100
14.Weight Allocations for the Two Relevant Social Analytic Variables 101 15.Weight Allocations for the Two Relevant Health Analytic Variables 101 16.Weight Allocations for the Two Relevant Human Resources Analytic Variables
102
17.Weight Allocations for the Two Relevant Financial Analytic Variables 103 18.Weight Allocations for the Two Relevant Security Analytic Variables 103
vii
19.Weight Allocations for the Two Relevant Criminal Analytic Variables 104 20.Final Weighted Rankings for all Analytic Variables Selected as the Top Five
Most Critical When Identifying Potentially Malicious Insider Threats 105 21.Demographic Distribution of the SMEs 109
22.Visualization Technique Rankings 112
23.Demographic Distribution of the SMEs 115
24.Descriptive Statistics for Critical Cyber Visualization Variables Level of Satisfaction 118
25.LeVIS Index Results for Perceived Effectiveness 119 26.SUS Scores 121
27.SUS Score by Quartile, Adjective Rating, and Acceptability 122 28.LeVIS Index Results for Perceived Effectiveness Summary 128
vi
List of Figures
Figures
1. Quality User Insider ChecKing visualization (QUICK.v™) interface Dashboard 13
2. QUICK.v™ Interface Detailed Analysis 14 3. Standard EKG Monitor 37
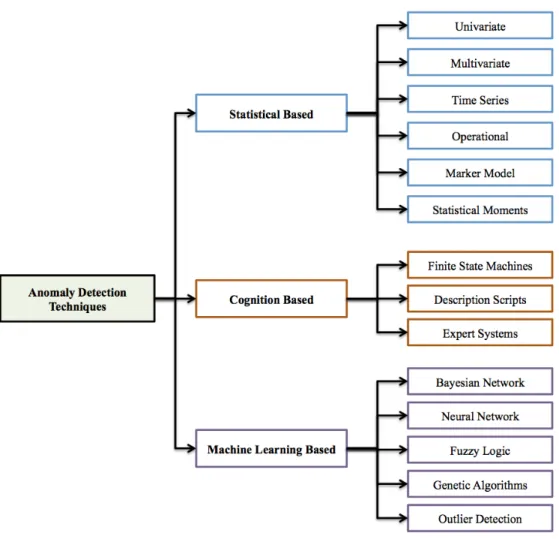
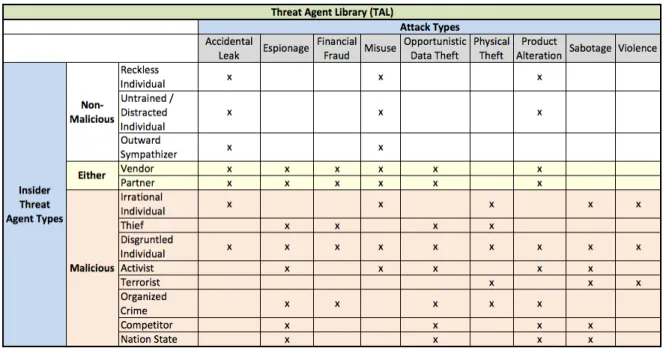
4. Anomaly Detection Techniques 41 5. Threat Agent Library (TAL) 50
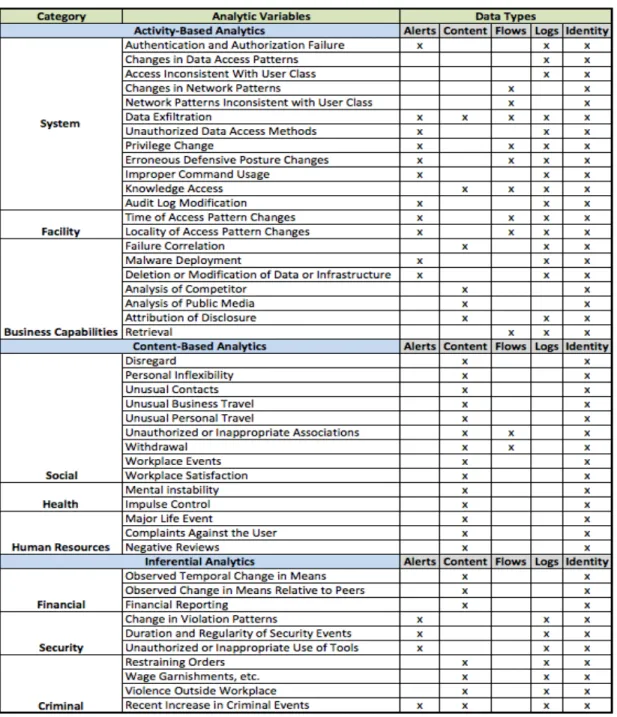
6. Initial Analytic Variables & Data Types 51
7. Research Design Process for the Development of a Cybersecurity Visualization Prototype 65
8. QUICK.v™ Development Process QUICK.v™ Development Process to Enhance Perceived Effectiveness by Assessing Satisfaction and Value 72
9. Conceptual Design for QUICK.v™ 74 10.Effectiveness Curves & Grid 85
11.SUS Score by Quartile, Adjective Rating, and Acceptability 88 12.Satisfaction and Value Distribution Summary 119
13.LeVIS Index Summary 119
14.Value-Satisfaction Dimension Grid Critical Cyber Visualization Variable 1: Workplace Satisfaction 129
15.Value-Satisfaction Dimension Grid Critical Cyber Visualization Variable 2: Change in Violation Patterns 130
16.Value-Satisfaction Dimension Grid Critical Cyber Visualization Variable 3: Audit Log Modification 130
vii
17.Value-Satisfaction Dimension Grid Critical Cyber Visualization Variable 4: Change in Data Access Patterns 131
18.Value-Satisfaction Dimension Grid Critical Cyber Visualization Variable 5: Data Exfiltration 131
19.Value-Satisfaction Dimension Grid Critical Cyber Visualization Variable 6: Privilege
Chapter 1
Introduction
BackgroundBig data analytics is altering cybersecurity in a potentially disruptive way by introducing profuse amounts of massively incomplete sets of data (Kott, Swami, & McDaniel, 2014). Big data is also used to detect the threat of a cyber attack or potentially cyberterrorism, hence, the need for data to be protected from unauthorized access, use, or manipulation (AlMutairi, Abdullah, AlBukhary, & Kar, 2015). Data is accelerating remarkably fast (Geer Jr., 2011). Data is defined as “a subset of information in electronic format that may be retrieved or transmitted” (NIST, 2013). “As information spaces expand in size and complexity, there is a growing need for visual representations that help us make better sense of diverse data relations and patterns” (Dork, Carpendale, & Williamson, 2011, p. 20). There are many challenges faced when deciphering large volumes and varieties of data within complex information systems (Shneiderman & Plaisant, 2015). A particularly complex challenge faced is dealing with malicious insider cyber threats (Pfleeger & Stolfo, 2009). Malicious cyber insiders may aim to
inconspicuously exfiltrate large volumes of data within an organization (Agrafiotis et al., 2015). Thus, cyber analysts are presented profuse amounts of alerts when using data visualizations to address the challenge of deciphering and reacting to big data within complex information systems, resulting in information overload (“Big Data Meets”, 2012).
Quickly analyzing overwhelming amounts of data and responding during a
malicious insider attack not only requires analytics tools but also human judgment (Gorg, Kang, Liu, & Stasko, 2013). According to Gorg et al. (2013), “the analysis process requires human judgment to make the best possible evaluation of incomplete, inconsistent, and potentially deceptive information in the face of rapidly changing situations” (p. 30). Cyber analysts have to perceptively determine how to react during an attack, while they may be inadequately equipped based on the visualization being used. Analytics tools are most useful if the cyber analyst can focus their attention by utilizing a systematic and focused visualization, which aided in sharpening the analytic focus, essentially allowing analysts to find patterns and anomalies of interest (Shneiderman & Plaisant, 2015). Staheli, Mancuso, Leahy, and Kalke (2016) addressed data visualization challenges faced within the Department of Defense (DoD) by developing a cyber
dashboard. They noted that within cybersecurity incorporating hundreds of data sources could be very difficult, requiring the need for this level of incorporation is a vital element for future designs. Future designs need to address the prevalent visual analytics challenge when examining data from multiple sources (Shneiderman & Plaisant, 2015). This study aims to develop and validate a visualization prototype that intends to enhance the
presentation of complex data correlations. The study addressed the need for further analysis of end-user specifications for the development of a cybersecurity visualization dashboard (Inibhunu et al., 2016; Agrafiotis et al., 2015; McKenna, Staheli, & Meter, 2015). The findings of this research add to the Information Systems (IS) and Information Security (InfoSec) body of knowledge by developing a novel and effective detection method for the identification of anomalous activities when mitigating malicious insider
cyber threats.
A visualization dashboard was also developed that presents cybersecurity ‘vital signs’, by assessing the perceived effectiveness of enhancing the presentation of complex data correlations when mitigating malicious insiders cyber threats. Using SMEs, the cyber insider threat dashboard visualization prototype was developed and validated. The remainder of this dissertation is organized as follows. First, the research problem was presented. Followed by the main dissertation goal, research questions, relevance, and significance. Then, the barriers and issues as well as the definition of terms are presented. Next, the literature review is presented, followed by the methodology. Next, the results, conclusions, implications, recommendations, and summary are presented. Lastly, the appendices are presented.
Problem Statement
The research problem that this study addressed was the prevalent challenge faced within the cybersecurity industry when detecting potentially malicious insider cyber threats, to enable visualization of those threats as they occur (Gorg et al., 2013; Inibhunu et al., 2016; Pfleeger & Stolfo, 2009; Patcha & Park, 2007). The nature of insider threats remains unchanged within cybersecurity research, and it remains a complicated threat to mitigate (Kumarmandal & Chatterjee, 2015). “Employees and contractors are the second greatest threat to an organization, exceeded only by hackers”, as such employees and contractors are considered insiders (Greitzer, Moore, Cappelli, Andrews, Carroll, & Hull, 2008, p. 61). A hacker is an unauthorized outsider who initiates a threat or attack (Sun, Srivastava, & Mock, 2006). An ‘insider’ has legitimate access to an organization
(Pfleeger & Stolfo, 2009). ‘Insider threat’ refers to, individuals with legitimate access whose behaviors put data, intellectual property, systems, organizations, and businesses at risk of being compromised (Pfleeger, Predd, Hunker, & Bulford, 2010; Predd, Pfleeger, Hunker, & Bulford, 2008). A malicious insider “is an insider who has malicious intent that acts against the best interests of the organization” (Santos et al., 2012, p. 331).
Malicious insiders within cyberspace are significant challenges that organizations face (Azaria, Richardson, Kraus, & Subrahmanian, 2014). In 2005, a United States (U.S.) Justice Department survey found that 74% of all cyber-theft within organizations were carried out by insiders and 40% of all cyber-incidents reported by 36,000 U.S. businesses involved insiders (Rantala, 2008).In 2013, there were over 117,000 cyber attacks per day costing firms over $28 million (Price Waterhouse Cooper, 2014). Current insider threat detection solutions inevitably trigger large volumes of false positive alerts. A false positive alert is a false alarm triggered when a detected vulnerability does not actually exist but is counted in a measurement as valid, requiring investigation of the incident and organizational resources (Mell, Bergeron, & Henning, 2005). According to Victor, Rao, and Venkaiah (2010), most intrusion detection systems (IDSs) have very high rates of false positives. This may lead to desensitized analysts ignoring possibly dangerous exploits that pose potentially detrimental financial and intellectual property damage to organizations (Spathoulas & Katsikas, 2010). An intrusion may be caused by “attackers accessing systems from the Internet or by authorized users of systems that attempt to misuse the privileges given to them and/or to gain more privileges for which they are not authorized” (Lazarevic, Kumar, & Srivastava, 2005, p. 21). An IDS, defined as a misuse or anomaly detector, may be used to detect unauthorized or malicious attacks over a
system that primarily occurs through the Internet (Kumar & NandaMohan, 2008). Traditional intrusion detection and prevention systems may be insufficiently designed -- they may not be capable of promptly identifying malicious insiders cyber threats or they generate a considerable amount of false positive alerts (Agrafiotis et al., 2015; Spathoulas & Katsikas, 2010). Since intrusive activity does not always correlate with anomalous activity, newly developed insider threat solutions that use the same techniques as traditional IDSs may not be adequate. Newly developed insider threat solutions should allow for rapid analysis of complex data correlations relevant to the identification of potentially malicious cyber insiders (Patcha & Park, 2007). While IDSs are good at detecting intrusions they do not specialize in anomaly identification
(Gandomi & Haider, 2015). Anomaly detection can be very difficult within large complex data sets as it may result in spurious correlations or “uncorrelated variables being falsely found to be correlated due to the massive size of the dataset” (Gandomi & Haider, 2015, p. 143). An anomaly detection system aids with the identification of abnormal behaviors based on complex data correlations. In this study a complex data correlation refers to identifying linear or non-linear relationships between two or more data variables (Patcha & Park, 2007).
Detecting malicious cyber insider threats is a complex task since their malicious actions take place along normal activities (Azaria et al., 2014). Identifying anomalous activities amidst appropriate activities pose the potential difficulty of being able to identify legitimate anomalies within the data presented. Shneiderman and Plaisant (2015) referred to this difficulty as the ‘analytic-focusing problem’. Useful visualizations should sharpen the analytic focus to enable detection of patterns or anomalies of interest
(Shneiderman & Plaisant, 2015). Detecting misuse by malicious cyber insiders involves examining an individual’s use of information and resources to decide whether the use is legitimate and/or deviates from what is considered ‘normal’ activities (Caputo, Maloof, & Stephens, 2009). Cyber analysts must find outliers or anomalies (also referred to as anomalous activities) within all of the users generated activities utilizing data analytics and information visualization (Kang, Gorg, & Stasko, 2011). Data analytics also uses data mining of large volumes of records, images, and activities translated to emphasize areas of interest that aid in understanding complex data (Kang et al., 2011).
Researchers are combining data mining and information-visualization to allow for visual inspection of data examination of outlier data (Shneiderman, Plaisant, Cohen, & Jacobs, 2010, p. 556). Information visualization is “communicating and perceiving data, both abstract and scientific, through visual representations” (Roberts et al., 2014, p. 27). Visual analytics supports human decision-making in complex application domains (Arias-Hernández, Dill, Fisher, & Green, 2011). For instance, visual analytics is used in medicine for anomaly detection within patients’ vital signs (Dutta, Maeder, & Basilakis, 2013). There are challenges faced with “archival, retrieval, and transformation” of the data when deciphering data analytics logs (Levy & Ramim, 2012, p. 99). Misspelled, duplicated, or data written in foreign languages may enhance the difficulty of misuse detection within an abundance of data (Jonas, 2006). Imbalanced data also often results in very high accuracy for the majority class (benign users), and very low accuracy for the minority class (malicious insiders). Identifying anomalies while taking corrective action accordingly poses a challenge (Azaria et al., 2014).
Internet and account for relevant cyber attacks. Security Information and Event
Management (SIEM) tools are applications that offer the ability to gather security data from information system components and present that data as actionable information via a single interface. SIEM tools are used by many cyber analysts within large organizations (NIST, 2013). Development techniques for visualization systems in the context of
cybersecurity tools should be evaluated since increased data is driving endless alerts most are falsely noted and increasing the response time required for decision-making (Arias-Hernández et al., 2011). In a case study performed by ACI Payment Systems (2015), when the Canadian Federal Government enforced stricter anti-money laundering regulations. By applying enhanced profiling tables and alert rules to an existing risk management solution reduced debit card fraud alerts by 84% and reduced analyst resources by 50%. These findings indicate an enhancement of profiling tables produced less work for analysts while increasing detection rates. There is a lack of effective methods for analysts to investigate events generated from big data infrastructure equipment and to find the correct diagnosis of critical alert information from the excessive alerts (Boukri & Chaoui, 2015).
Prior research that examined detection of malicious insider cyber threats has mainly been focused on anomaly detection methods, malicious behaviors, or detection techniques used by cyber analysts (Agrafiotis et al., 2015; Azaria et al., 2014; Legg et al., 2015; Santos et al., 2012). Kemmerer and Vigna (2002) defined anomaly detection as, “models of the intended users and applications behaviors, which interpret deviations from normal behavior as a problem” (p. 28). According to Legg et al. (2015), cyber analysts can be empowered to identify anomalous activities by combining detection results with a
visual analytics approach for expedited real-time detection. Arias-Hernández et al. (2011) concluded that visual analytics challenges would require coordination of Human
Computer Interaction (HCI) practitioners as well as visualization and computation researchers. Boukri and Chaoui (2015) also conferred that dashboard-based visualization techniques could be used to provide full visibility of network progress and problems in real-time. Heckman, Stech, Schmoker, and Thomas (2015) speculated that conventional approaches to cybersecurity are inadequate since conventional approaches that may include applying firewalls and IDS technologies are still being penetrated allowing sensitive information to be exploited. Accordingly, there is an evident need for an unconventional approach to address cybersecurity challenges when detecting cyber insider threats. This study approached the challenge of detecting cyber insider threats in an unconventional way by utilizing a newly developed visualization prototype to enhance the presentation of complex malicious insider cyber threat, both linear and non-linear, indicator correlations.
In the field of medicine, practitioners understand the importance of monitoring as well as recording patients’ vital signs (Mok, Wang, & Liaw, 2015). In most cases just four vital signs serve as an essential tool for determining life saving responses (Harries, Zachariah, Kapur, Jahn, & Enarson, 2009). Within business organizations, Executive Dashboards (EDs) are used to present real-time information pertinent to the organizations strategy and risks because EDs are designed to enable efficient decision-making (Ballou, Heitger, & Donnell, 2010). Within the Department of Defense (DoD) the Under
Secretary of Defense Comptroller’s office implemented EDs for presenting credible and timely data where only core data with concise tables are presented to analysts (Dees,
2009). Similarly, the Heads Up Display (HUD) considerably altered cockpit information for pilots. Using cross-monitoring principles a pilot continually references external visual cues, correlations of pitch, attitude, and vertical speed to make decisions in the event of unwarranted deviations (Dopping-Hepenstal, 1981). This is pertinent to highlighting how visualizations are already being used within these well-established industries.
Practitioners are making critical decisions daily using visualizations and EDs.
Shneiderman et al. (2010) indicated, “new visualization products should be more than just cool, they should offer measurable benefits for realistic tasks” (p. 539). There is an apparent need to identify and validate requirements and define visualization techniques for the development of a cyber insider threat visualization prototype (Legg et al., 2015; Shneiderman & Plaisant, 2015). As EDs, HUDs, and vital signs have enhanced their industries, the cyber insider threat visualization prototype developed in this study similarly aims to enhance the visualizations presented in the cybersecurity industry.
Dissertation Goal
The main goal of this study was to develop and validate, using Subject Matter Experts (SMEs), a cyber insider threat dashboard visualization prototype. The prototype used in an experimental study that aimed to assess the perceived effectiveness of
enhancing the presentation of complex data correlations when mitigating malicious insiders cyber threats. The need for this work is demonstrated by the research of Albanese, Pugliese, and Subrahmanian (2013), Boukri and Chaoui (2015), Dork et al. (2011), Greitzer and Hohimer (2011), Legg et al. (2015), Shneiderman et al. (2010), as well as Shneiderman and Plaisant (2015). Albanese et al. (2013) developed a graphical
index that would aid in providing evidence of occurrences of an activity, and identify if an anomaly matches a sequence of observations in a simulated environment. Dork et al. (2011) approached the challenge of complex data visualization by presenting a novel visualization technique combining implicit and explicit data relationships and still finding that more work is necessary to understand complex information spaces. Though the threat posed by malicious cyber insiders is real, there is a lack of precise analysis due to the sheer volume of activities (Legg et al., 2015; Spathoulas & Katsikas, 2010).
Prior research that has developed dashboard visualization prototypes rarely addressed the perceived effectiveness using multiple SMEs within the applicable field (Goodall, 2007). Without a deeper understanding of the cyber analyst using the visualization, progress and practical application was difficult (Gorg et al., 2013). Assessing the perceived effectiveness of the developed cyber insider threat dashboard visualization prototype enhanced the validity for this research (Petter, Delone, & McLean, 2013). The perceived effectiveness was determined by obtaining a rating for satisfaction and value of the developed prototype (Hong, Tai, Hwang, Kuo, & Chen, 2017; Levy, 2006; Ellis & Levy, 2009). Identifying and assessing the risk score was beyond the scope of this study. Risk calculation are addressed in the AI-InCyThR™ prototype (Hueca, Clarke, & Levy, 2016). Once the prototype was developed,
cybersecurity analysts were asked to assess the perceived effectiveness based on their user experience. The goal of the developed prototype is to alleviate the issues faced when using visualizations to identify potentially malicious cyber insiders.
There are multiple issues that reside with IDSs, for instance, triggering alarms where over 90% of the alerts are false positives, while identifying the true positive alerts
can be error prone and labor intensive (Ho, Lai, Chen, Wang, & Tai, 2012). This makes it difficult for cyber analysts to identify alerts that are legitimate, important, and procure the appropriate response (Julisch, 2003). Another issue faced is identifying anomalies within the environment (Patcha & Park, 2007). Visualizing the data can aid in presenting strong connections between individuals and entities, as was utilized to explore the Commission Report about the September 11, 2001 terrorist attacks (Gorg et al., 2013). Applying visualizations may assist with the issues encountered with current IDSs. “Visualizations use enormous visual bandwidth and a remarkable human perceptual system to enable users to make discoveries, decisions, or propose explanations” (Shneiderman et al., 2010, p. 538). Legg et al. (2013) developed a conceptual model for insider threat that would give an all-encompassing organizational view. Applying the proper visualizations within cybersecurity may aid management decision-making efforts. It appears there is a need for a visualization prototype that presents actionable alerts to cyber analysts.
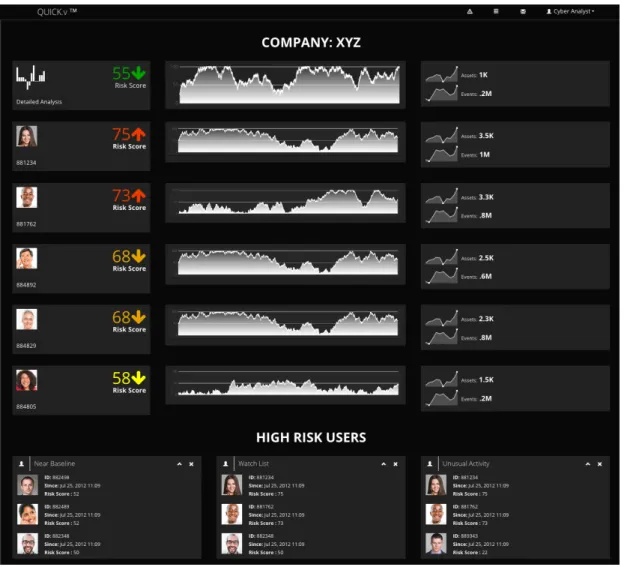
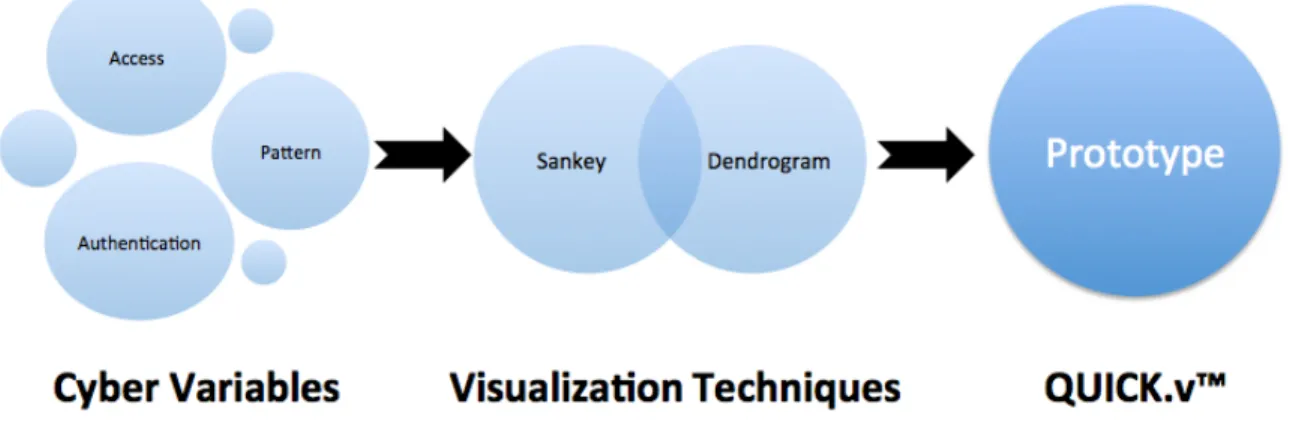
Greitzer and Hohimer (2011) found that in a substantial number of cases, prior to an exploit, the malicious intent of the insider was ‘observable’. Legg et al. (2015) later suggested that visualizations enabled cyber analysts to identify what particular attributes caused the insider to be detected, and coupling the detection results with visual analytics enhanced detection of anomalous activities. Pfleeger et al. (2010) concluded that by using four basic dimensions of the insider threat (the organization, the system, the individual, and the environment) insider actions could be evaluated to frame responses. In Figure 1, these four basic dimensions are used to frame the Quality User Insider ChecKing
visualization (QUICK.v™) interface that presented identified vital signs pertinent to the identification of malicious cyber insiders. Applying the concept of four essential vital
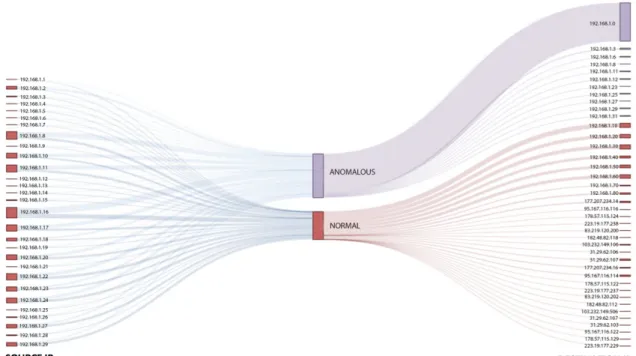
signs from the medical field, the primary visualization technique for each identified cyber vital sign was selected and applied to QUICK.v™. Based on Shneiderman (1996)’s visualization mantra: overview, zoom and filter, then details on demand. Figure 2
presents a Sankey visualization that allows for zoom, filter of generated details, and may also allow analysts access to complete details on demand. Shneiderman et al. (2010) noted that new visualization products should “present information more rapidly and allow user-controlled exploration”, without overwhelming novice users (p. 558). This study builds on earlier research by Boukri and Chaoui (2015), as well as Pfleeger et al. (2010) by developing and testing a visual analytics prototype that aims to decrease the time it takes to react to potentially malicious cyber activities.
Figure 1: Quality User Insider ChecKing visualization (QUICK.v™) interface Dashboard
Figure 2: QUICK.v™ Interface Detailed Analysis
This study had five specific goals. The first research goal was to identify, using SMEs, the critical cyber visualization variables (see Appendix A). The cyber
visualization variables refer to analytic variables that may aid in identifying potentially malicious cyber insiders (Casey, 2015). The second research goal was to identify, using SMEs, the rank order of the critical cyber visualization variables that the developed prototype should include, which may aid in identifying potentially malicious cyber insiders. The third research goal was to identify, using SMEs, the most valid presentation of complex data correlations using the identified critical visualization variables over multiple visualization techniques. The fourth research goal was to apply SMEs’ identified critical visualization variables, in rank order, and techniques to develop QUICK.v™. The fifth research goal was to conduct an experimental study using SMEs to assess the
perceived effectiveness using self-reported value and satisfaction of the QUICK.v™ prototype when mitigating malicious cyber insiders.
Research Questions
In the medical field, vital signs are the core component of clinical management, aiding healthcare professionals with identifying potential threats to the normal operations of the body (Harries et al., 2009). Tracking insiders within cyber and the ability to
analyze normal insider activities or when insiders are posing a threat appears to be much needed (Legg et al., 2015). It is pertinent to identify changes in vital signs early as this may prevent patient deterioration (Mok et al., 2015). Likewise, identifying malicious cyber insiders early may prevent an organization from financial decline. The overarching research question that this study addressed is: What visualization variables and
techniques should be used to develop a cyber insider threat dashboard visualization prototype that enhances the effective presentation of complex data correlations within cybersecurity? There is an abundance of visualization techniques available: graph-based, hierarchical, pixel-oriented, icon-based, geometric, etc. (Keim, 2000). Using the most effective visualization technique is vital for enhancing cyber insider threat analysis. The specific research questions that this study addressed are:
RQ1: What are SMEs' identified critical cyber visualization variables that should be displayed when using applications to detect potentially malicious insider cyber threats?
RQ2: What is the rank order of the SMEs' identified critical cyber visualization variables that should be displayed when developing a cyber insider threat
dashboard visualization prototype to detect potentially malicious cyber insider activities?
RQ3: What SMEs’ identified visualization techniques are most valid to present complex cyber data correlations relevant to the pre-designated critical cyber visualization variables that are applied within the developed cyber visualization prototype QUICK.v™?
RQ4: What SMEs’ identified visualization techniques are most valid to present top six critical cyber visualization variables to detect potentially malicious cyber insider activities that are applied within the developed cyber
visualization prototype QUICK.v™?
RQ5: What is the SMEs’ perceived effectiveness (i.e. satisfaction &
value/importance) of the QUICK.v™ prototype when mitigating potentially malicious cyber insider threats?
Utilizing a cyber visualization prototype like QUICK.v™ may allow cyber analysts to detect malicious insider threats more efficiently, while allowing cyber leaders to take effective corrective actions. By reducing the key indicators of malicious activities to be displayed specifically for cyber analysts, QUICK.v™ may enable early detection and prevention of malicious cyber insider threats. Therefore, a real-time overall view of the cyber environment using appropriate visualization techniques aided in addressing visual analytic challenges faced by cyber analysts (Boukri & Chaoui, 2015).
Relevance and Significance
Relevance
This study presents a novel way of addressing the prevailing problem faced when detecting malicious cyber insiders. Past studies have aimed at addressing this challenge, however, the problem persists. Randazzo, Keeney, and Kowalski (2005) detailed
numerous insider attacks from 1996 to 2002, with losses to individual firms ranging from $200 thousand to $600 million. According to Pfleeger et al. (2010), “insider misuse can threaten personal data, national security, as well as economic prosperity” (p. 169). Recently, this challenge has still continued to persist. Price WaterHouse Coopers (PwC) identified that insiders are likely to be to the primary source of cyber attacks (PwC, 2013). In 2014, a significant percentage of U.S. executives worried that cyber threat would impact growth within their organizations (PwC, 2014). Approaching this problem from an alternate perspective with a novel development can aid in addressing this
problem. Cole (2015) conducted a survey on 772 individuals based on the results, 34% of respondents estimated over $1 million was lost due to insider attacks. Therefore,
identifying potential mitigations for malicious cyber insider threats is pertinent to preventing detrimental financial and intellectual property damage to organizations. By applying a novel approach to solving this problem, new insight into enhancing
mitigations by utilizing appropriate visualization techniques may be applied in order to detect malicious cyber insiders.
Significance
This study assisted in the identification of malicious insiders (Agrafiotis et al., 2015; Pfleeger & Stolfo, 2009). This was done by obtaining user requirements from
current cyber SMEs, applying the requirements to the development of a dashboard visualization prototype, and iterating the design, using SMEs to determine the perceived effectiveness of the developed prototype. Similar to cyber analysts, nurses perform surveillance to identify changes in activity and protect patients from harm (Rogers, Dean, Hwang, & Scott, 2008). Additionally, communication delays of vital signs may result in patient deterioration (DeVita, 2005). Within cybersecurity mitigating adverse incidents require surveillance to identify anomaly metrics and attack patterns (Agrafiotis et al., 2015). Delays in identifying a potentially malicious cyber insider may result in substantial losses, resulting in the deterioration of an organization (Randazzo et al., 2005). Developing dashboard visualizations similar to those used by nurses when making critical decisions, but tailored toward cyber vitals incorporates a novel approach to anomaly detection within cybersecurity. Therefore, to develop a cyber dashboard prototype for the detection of malicious cyber insiders, input was obtained from cyber SMEs with the knowledge and experience to identify effective indicators, data points, and fluctuations allowing for the development of a more relevant and valid prototype. This study is substantially significant since there are substantial financial losses resulting from exploits perpetrated as a result of malicious cyber insiders.
Barriers and Issues
A barrier was collecting results from the SMEs over multiple iterations, to obtain the pertinent cyber variables and then to validate the developed prototype. As a result, participants were rewarded with a gift card for participation. Another barrier of this study was that after administering the Delphi technique within the second phase, an experiment
then needed to be conducted applying the developed prototype for SME assessment. Since the participants were all volunteers, they could have withdrawn from the study at any time skewing the final results (Ellis & Levy, 2009). By rewarding participants for their time this reduced the rate of withdrawal. Additionally, variations in the SMEs years of experience may alter the informality of their results, as some SMEs may be more experienced than others. As such some SMEs may be more familiar with the
requirements necessary for the adequate detection and remediation of cyber insider threats than others. To ensure all SMEs had a baseline understanding of insider threats, prior to conducting the survey, all SMEs were informed of what insider threat means within the scope of this study, as well as identified variables for anomaly identification within cybersecurity, and significant benefits of mitigating malicious cyber insider threats.
Limitation and Delimitation
Limitation
A limitation of this study was that the developed visualization prototype intended to visualize complex correlations based on cybersecurity related data. The cybersecurity data needed to be fed to the developed visualization prototype from viable data sources. The parsed data feeds were then utilized for generating the visualizations on the validated front-end. If the data input “was either incorrect, of low quality, or irrelevant, the resulted output was going to be ineffective regardless of the quality of the processing,
colloquially, garbage-in/garbage-out” (Levy & Ellis, 2006, p. 185). If the data source was corrupted or incorrect the visualizations presented would be inaccurate. The findings of
this study served as the foundation of what needs to be presented within current cybersecurity visualizations. The prototype developed served as a tool for simplifying current visualization techniques and presenting the generated events. However, as the source of the data feeds change overtime the visualization variables used to develop the prototype may need additional validation. The prototype being developed would
represent variables relevant to current applications and data sources. Therefore, future research may be required to apply the prototype that was developed using SMEs to future data sources.
Delimitation
A potential delimitation of this study was that the developed prototype did not perform data parsing the developed prototype visualized already parsed data in a consumable form factor pertinent to cyber professionals. Additionally, this study was limited to participants who have worked or are working within cybersecurity.
Definition of Terms
The following represent terms and definitions.
Anomaly Detection – “Models of the intended users and applications behaviors that interpret deviations from normal behavior as a problem” (Kemmerer & Vigna, 2002, p. 28).
Cyber Attack – “An attack, via cyberspace, that targets an enterprise’s use of cyberspace for the purpose of disrupting, destroying, or maliciously controlling a computer
environment/infrastructure; destroying the integrity of the data; or stealing controlled information” (NIST, 2013, p. 57).
Cyber Crime – “Any crime that involves computers and networks, including crimes that do not rely heavily on computers” (Casey, 2000, p. 8).
Cybersecurity – “Prevention of damage to, unauthorized use of, exploitation of, and, if needed, the restoration of electronic information and communications systems to ensure confidentiality, integrity, and availability” (Axelrod, 2006, p. 1).
Cyberspace or ‘Cyber’ – Independent network of IT infrastructures that includes the Internet, telecommunications networks, computer systems, and embedded processors and controllers in critical industries (The White House, 2009).
Cyberterrorism – “Concerted, sophisticated attacks on networks” (as cited in Foltz, 2004, p. 154).
Data - A subset of information in an electronic format that allows it to be retrieved or transmitted (NIST, 2013, p. 58).
Data Analytics – The use of data mining of large volumes of records, images, and activities translated to highlight areas of interest to aid in understanding complex data (Leventhal, 2010).
Data Breach - An organization’s unauthorized or unintentional exposure, disclosure, or loss of sensitive PI, such as social security numbers; financial information, such as credit card numbers; date of birth; or mother’s maiden name (NIST, 2010).
False-positive Alerts – “When something (e.g., a vulnerability) does not actually exist but is counted in a measurement” (Mell, Bergeron, & Henning, 2005, p. 40).
Information System (IS) – The system that governs the information technology development, use, application, and influence on a business or corporation (Alvarez, 2002).
Information Visualization – “Communicating and perceiving data, both abstract and scientific, through visual representations” (Roberts et al., 2014, p. 27).
Insider – “Individuals whohave legitimate access to an organization” (Pfleeger, Predd, Hunker, & Bulford, 2010, p. 169).
Insider Attack - The abuse of privileges or access by an insider that results in a breach, interruption or disregard of a law, rule, or policy (Goodall, 2007).
Insider Threat – “Individuals with legitimate access whose behaviors put a firm’s data, intellectual property, systems, organizations, and businesses at risk of being attacked” (Pfleeger, Predd, Hunker, & Bulford, 2010, p. 169).
Intrusion Detection System – “Hardware or software that gathers and analyzes information from various areas within a computer or a network to identify possible security breaches, which include both intrusions and misuse” (NIST, 2013, p.104). Intrusion Prevention System – “Systems that can detect and attempt to stop an intrusive activity, ideally before it reaches its target” (NIST, 2013, p. 105).
Malicious Insider – “Is an insider who has malicious intent that acts against the best interests of the organization” (Santos et al., 2012, p. 331).
Security Event – “Any observable security occurrence in a system network” (NIST, 2012, p. 6).
Security Incident – “A violation or imminent threat of violation of a computer security policy, acceptable use policy, or standard security practice” (NIST, 2012, p. 6).
Security Information and Event Management (SIEM) Tool – “Application that provides the ability to gather security data from information system components and present that data as actionable information via a single interface” (NIST, 2013, p. 177).
Threat – “Any circumstance or event with the potential to adversely impact organizational operations (including mission, functions, image, or reputation), organizational assets, individuals, other organizations, or the Nation through an information system via unauthorized access, destruction, disclosure, modification of information, and/or denial of service (NIST, 2013, p. 198).
Summary
The purpose of chapter one was to introduce this study by identifying the research problem, questions, barriers, issues, and limitations. In the next chapter, a comprehensive review of literature is presented. The research problem of the study was the prevalent challenge faced within the cybersecurity industry when detecting potentially malicious insider cyber threats, to enable visualization of those threats as they occur. Literature reviews to support the stated research problem and need for this study are detailed within the next chapter.
Chapter one also presented the research goals and research questions. The main goal of this study was to develop and validate, using SMEs, a cyber insider threat
dashboard visualization prototype. The prototype was used in an experimental study that aimed to assess the perceived effectiveness of enhancing the presentation of complex data correlations when mitigating malicious insiders cyber threats. Literature to support this goal was presented (Albanese, Pugliese, & Subrahmanian, 2013); Boukri & Chaoui, 2015); Dork et al., 2011); Greitzer & Hohimer, 2011); Legg et al., 2015); Shneiderman et al., 2010); as well as Shneiderman & Plaisant, 2015). The five specific goals of this study were also discussed. Based on prior literature intrusion detection and prevention systems
may be insufficiently designed so they may not be capable of identifying malicious insiders cyber threats (Agrafiotis et al., 2015; Spathoulas & Katsikas, 2010). Identifying anomalous activities amidst appropriate activities pose the potential difficulty of being able to identify legitimate anomalies within the data presented by Shneiderman and Plaisant (2015). This study added to the body of knowledge by applying a novel approach to insider threat identification, new insight into enhancing mitigations by utilizing
appropriate visualization techniques may be applied in order to detect malicious cyber insiders.
Lastly, chapter one continued by discussing the barriers, issues and potential mitigations for each. The limitations and delimitations of this study were also discussed within the presented barriers and issues section. The chapter concluded with a list of definitions of terms that was used throughout this study and any applicable acronyms.
Chapter 2
Review of Literature
IntroductionA literature review is presented in this chapter to provide an analysis of the relevant literature pertaining to insider threat detection and visualization. According to Webster and Watson (2002), an effective literature review is essential to creating a firm foundation for advancing knowledge, since it facilitates theory development and
uncovers areas needing additional work. A literature review should also be objective and gather information on a particular subject from many sources, in order to support the newly contributed insight (Ramdhani, Ramdhani, & Amin, 2014). Thus, the presented literature review within this chapter displayed objective information gathering in relation to the need for this work. This examination consists of an extensive search performed within IS, InfoSec, HCI and medical literature. Quality literature reviews have structure, form, and is structured around major themes or concepts that emerge as the author examines and reviews the literature (Levy & Ellis, 2006). As a result of the literature review performed, constructs relevant to the visualization of insider threats for identifying anomalous activities of malicious cyber insiders were identified as: cybersecurity, cyber analysts, intrusion detection, insider threat analytic variables, information visualization and IS effectiveness. An extensive review of these constructs was preformed to determine established knowledge within these identified areas needing
additional investigation. The results of this literature review relevant to these constructs are later presented.
Cybersecurity
Cybersecurity is defined as “prevention of damage to, unauthorized use of, exploitation of, and, if needed, the restoration of electronic information and
communications systems to ensure confidentiality, integrity, and availability” (Axelrod, 2006). It is commonly used to refer to the protection of devices connected to the Internet (Addae, Radenkovic, Sun, & Towey, 2016). The term ‘cybersecurity’ is often used interchangeably with the term information systems security, though these terms greatly differ (Solms & Niekerk, 2013). Cybersecurity is not just the protection of cyberspace; it is also the protection of those who function in cyberspace and any of their assets that can be reached via cyberspace (Thomson & Solms, 2005).
Cybersecurity is about the protection of the assets and people using resources in cyberspace and any other assets these assets may be tangible or intangible and including those belonging to society in general (Solms & Niekerk, 2013). Cybersecurity issues are different from any issues faced before (Harknett & Stever, 2011). Cybersecurity issues involve human intelligence and the exploits or vulnerabilities are created to defy and change the rules of the systems they target (Toecker, 2014). Problems within
cybersecurity do not fit the traditional security variables, since problems within cybersecurity tend to also be a strategic issue and not just a compliance issue (Bissell, 2013). There is also a profuse amount of non-geographical data and an additional layer of
territorial division of responsibilities that adds to the difficulties of mitigating cyber insider threats (Harknett & Stever, 2011).
Cybersecurity problems became prominent following the attacks on September 11, 2001, after which President Bush created the U.S. Department of Homeland Security (Harknett & Stever, 2011). The Bush Administration unveiled the National Strategy for Securing Cyberspace (NSSC) in 2003, a prominent effort to address the nation’s
cybersecurity problems (Harknett & Stever, 2011). Cybersecurity issues persisted into 2009 and President Obama declared cybersecurity defense as a significant national security interest that the U.S. government was not adequately prepared to counter (Sherman, 2013). To understand cybersecurity it is important to also understand cyberspace.
Cyberspace consists of a growing number of connected computers, with a global community of individual users, and a constantly evolving set of technologies.
Cybersecurity professionals actively work towards ensuring confidentiality, integrity, and availability for computers within this space (Miller & Murphy, 2009). With increased reliance on cyberspace, vulnerabilities have also grown (Warkentin & Willison, 2009). Anderson and Agarwal (2010) noted that cybersecurity issues are contingent upon securing cyberspace, and this issue is comparable to environmental and health issues. A defining characteristic of cybersecurity is that all assets may contain data that needs to be protected, since the vulnerabilities that exist are a result of information and
communication technologies, all of which make up cyberspace (Solms & Niekerk, 2013). Caputo et al. (2009) concluded they were unable to determine a specific technique for
determining insider misuse, but by providing a common operational overview of
cyberspace they have provided valuable insights for mitigating cybersecurity problems. Table 1
Summary of Cybersecurity Literature
Study Methodology Sample Instrument or
Construct Main Finding or Contribution Addae, Radenkovic, Sun, & Towey, 2016 Empirical study via survey 174 online participants Survey using a five-point Likert scale Augmented behavioral research model that introduces attitude to personal data as a determinant of cybersecurity behavior. Anderson & Agarwal, 2010 Empirical study via survey 594 home computer users Survey and experiment using a seven-point Likert scale Behavioral intentions to secure one’s own computer and to secure the Internet is formed by a combination of cognitive, social, and psychological components. Axelrod, 2006 Literature review and analysis IT process and control requirements Enterprises must take on responsibility for protection within their perimeters.
Table 1
Summary of Cybersecurity Literature (continued)
Study Methodology Sample Instrument or
Construct Main Finding or Contribution Bissell, 2013 Literature review and synthesis Cyberattacks, cyberinsurace The development of a cybersecurity roadmap enabled organizations to develop a much clearer picture of its current status and gain a better understanding of its strengths and gaps.
Caputo et al.,
2009 Empirical study via experiment 50 employees at MITRE (Management, technical, and administrative staff) A study laptop running software that monitored their information-use behavior
There isn’t one behavior that distinguishes malicious users from benign ones. The most
valuable way to tackle insider threats is to
cast a wide net and strategically evaluate behaviors to identify misuse. Harknett & Stever, 2011 Policy review and analysis U.S. government cybersecurity policy releases from 2002 to 2011 Cybersecurity policy Based on the
national strategy for securing cyberspace the Goal of securing cyberspace was occasionally achieved in moderate technical, tactical, and operational advances.
Table 1
Summary of Cybersecurity Literature (continued)
Study Methodology Sample Instrument or Construct Main Finding or Contribution Miller &
Murphy, 2009 Theoretical Cybersecurity review and problems The cybersecurity problem required new models of cooperation and collaboration among nations. Sherman, 2013 Literature review and analysis 58 U.S. government releases on cybersecurity Cybersecurity defense, cybersecurity strategy Senior policymakers must commit the resources to build and nurture a highly skilled cyber
workforce capable of overcoming cyber threats and vulnerabilities. Solms & Niekerk, 2013 Literature review and Synthesis Cybersecurity and information security Cybersecurity, differs from information security; cybersecurity is not only the protection of cyberspace itself, but also
the protection of those that function in cyberspace and any of their assets.
Table 1
Summary of Cybersecurity Literature (continued)
Study Methodology Sample Instrument or
Construct Main Finding or Contribution Thomson & Solms, 2005 Literature review and synthesis Information security obedience, corporate governance, information security, corporate culture Information Security Obedience is the solution to ensuring proper information security behavior.
Toecker, 2014 Theoretical security control systems Recommendations to provide efficient risk reduction from cybersecurity events, answering the question
"Where should I put my next dollar in order to get the biggest cybersecurity improvement?" Warkentin & Willison, 2009 Literature review and synthesis
Insider threat There is a need to understand and address the various risks to the security of the IS on which we depend.
Cyber Analysts
Organizations rely on skilled analysts to make critical decisions pertaining to: threats, vulnerabilities, and network performance (Staheli, Yu, Crouser, Damodaran, Nam, O’Gwynn, McKenna, & Harrison, 2014). Cyber analysts examine people within
organizations, internal, external incidents, within varying applications, locations, and dates to uncover potentially imminent threats (Gorg et al., 2013). They have the unsavory job of analyzing a profuse amount of alerts whose performance characteristics are often either unknown or uncertain (Walton, Maguire, & Chen, 2015). Analysts struggle with processing large volumes of data and providing valuable insights (Shneiderman & Plaisant, 2015). In many cases the overwhelming amount of data leaves cyber analysts unable to formulate effective remediation plans (Arias-Hernández et al., 2011). Caputo et al. (2009) found that two cyber analysts could effectively review 23 users per day using a developed insider threat detection system. However, they still struggled to develop a technique which aided in efficient identifying, with significant reduction in false positives, of malicious insiders.
Visualizations benefit cyber analysts attempting to identify complex problems. Visualizations help cyber analysts to both identify problems, potentially malicious insiders, and to work visually towards finding solutions (Fink, North, Endert, & Rose, 2009). Goodall (2007) evaluated user performance when using a traditional application versus one that utilizes visualizations for network packet analysis and found that users discovered more insights when utilizing a visualization tool. Visualizing complex issues using simple and intuitive methods so patterns can be quickly recognized assisted in overcoming cybersecurity problems (Choi, Lee, & Kim, 2009). Though Goodall (2007) found visualizations to be beneficial, his study focused only on network analysts and suggested the methods be applied using cybersecurity applications.
Table 2
Summary of Cyber Analysts Literature
Study Methodology Sample Instrument or
Construct Main Finding or Contribution Arias-Hernández et al., 2011 Theoretical Cognitive science, visual analytics, HCI For analysts to overcome visual analytics challenges it would be best achieved with the active involvement of HCI researchers and practitioners. Caputo et al.,
2009 Empirical study via experiment 50 employees holding various positions at MITRE (Management, technical, and administrative staff) Study laptop running software that monitored information-user behavior
There isn’t one behavior that distinguishes malicious users from benign ones. The most valuable way to tackle insider threats is to cast a wide net and strategically evaluate behaviors to identify misuse. Choi, Lee, &
Kim, 2009 Empirical study via experiment A real-life Internet attack traffic trace (Network packets) Traffic flow generator The development of parallel coordinate attack visualization (PCAV) is a real-time visualization system for detecting anomalies from Internet attacks. Fink, North, Endert, & Rose, 2009 Empirical study via experiment 8 cyber analysts at a laboratory
Visualization Designed usable workspaces for cyber analysts.
Table 2
Summary of Cyber Analysts Literature (continued)
Study Methodology Sample Instrument or
Construct Main Finding or Contribution Goodall, 2007 Literature review and synthesis Visualization Examination of VizSec literature attempting to solve the problems of computer security through enabling humans through information visualization. Gorg et al., 2013 Empirical study via experiment 5 Student teams at Mercyhurst College for 10 weeks Visual analytics Visual analytics succeeds only if developers
fully understand the unique demands of analysis and the way that analysts approach their work. Shneiderman & Plaisant, 2015 Literature review and synthesis Analytic-focusing Identification of 10 analytic focusing strategies to sharpen analytic processes and enable users to deal with larger datasets. Staheli, Yu, Crouser, Damodaran, Nam, O’Gwynn, McKenna, & Harrison, 2014 Empirical study via secondary data and survey Surveyed 130 papers from the past 10 years of VizSec proceedings
Visualization Identified existing methodological gaps in evaluating visualization in cyber security, and suggested
potential avenues for future research.
Table 2
Summary of Cyber Analysts Literature (continued)
Study Methodology Sample Instrument or
Construct Main Finding or Contribution Walton, Maguire, & Chen, 2015 Empirical study via case study Selection of visualizations from the system, CITD (Corporate Insider Threat Detection) Dashboard Dashboard Visualization Introduced a visual analytics loop for protective monitoring in cybersecurity applications, and a prototype tool demonstrating an example implementation of the approach.
Intrusion and Anomaly Detection
Intrusion detection systems are the equivalent of burglar alarms within cybersecurity and anomaly detection systems are a subset of IDSs that specialize in discovering unknown attacks (Patcha & Park, 2007). Although anomaly detection stemmed from IDSs, the goal of an anomaly detection system is to detect new or unknown attacks (Yu, 2012). Anomaly detection relies on identifying normal activities and reporting against deviations from identified normal activities (Cao, Li, Coleman, Belatreche, & McGinnity, 2015). Anomaly detection is based on event correlation techniques that can be categorized and utilized to infer threats through correlation analysis (Ten, 2010). Common types of IDSs are signature based or anomaly based (Ye, Emran, Chen, & Vilbert, 2002). Commonly used IDSs are often signature based and require constant updates of rules and known attacks to stay effective (Patcha & Park, 2007). Signature based detection is reactive and with today’s advanced threats they are
seemingly outdated (Jackson, 2012). Signature based anomaly detection uses intrusion signatures that have to be manually added as profiles of intrusion characteristics, if an intrusion signature is present then and intrusion alert is triggered (Ye et al., 2002).
Anomalies are patterns of interest that do not conform to normal behaviors detection techniques use identified data to develop a baseline of normal activities (Chouhan & Richhariya, 2015). Some anomaly detection approaches use the
identification of a score, to indicate “the degree of irregularity of a specific event”, when activities result in a score that exceeds the established baseline of normal activity, then the occurrence was flagged as an anomaly (Garcia-Teodoro, Diaz-Verdejo,
Maciá-Fernández, & Vázquez, 2009, p. 20). Unknown attacks are detected by creating a baseline of ‘normal’ activities and if any activities deviate from the baseline then it is identified as anomalous and potentially malicious activity (Patcha & Park, 2007). Thus, activities that exceed the baseline as well as activities that are significantly below the baseline can initiate further investigations by cyber analysts. The baseline running an average for each pertinent variable, if the data sets activities are above average it was deemed above the baseline and vice versa. The baseline may be organizational-dependent and could rely upon factors like the number of employees, type of data being collected, number of data sources, etc. (Legg et al., 2015). Like organizations, individuals may be drastically different, however, there are established ‘normal’ baselines for each vital sign in relation to an individual infant or adult. For instance, the vitals of a healthy adult are depicted using an Electrocardiogram (EKG) view figure 3, presenting a standard set of vital signs: “blood pressure: 90/60 mm/Hg to 120/80 mm/Hg, respiratory rate: 12–20 breaths per minute, pulse rate: 60–100 beats per minute, and temperature: 36°C–37.4°C” (Mok et al.,
2015, p. 98). Hence, comparable cybersecurity vital signs may be established.
Figure 3: Standard EKG Monitor Table 3
Summary of Intrusion and Anomaly Detection Literature
Study Methodology Sample Instrument or
Construct Main Finding or Contribution Cao, Li, Coleman, Belatreche, & McGinnity, 2015 Empirical study via experiment Real market data of seven representative stocks: Google, Microsoft, Intel, Apple ARM, BARCLAYS, and Vodafone Detection algorithm, adaptive hidden Markov model with anomaly states (HMMAS) AHMMAS performs better in terms of the area under ROC curve and the F-measure, respectively.
Table 3
Summary of Intrusion and Anomaly Detection Literature (continued)
Study Methodology Sample Instrument or
Construct Main Finding or Contribution Chouhan & Richhariya, 2015 Literature review and analysis Anomaly detection algorithm Summarized anomaly detection techniques along with various research directions. Garcia-Teodoro, Diaz-Verdejo, Maciá-Fernández, & Vázquez, 2009 Literature review and analysis Anomaly-based network intrusion detection systems (A-NIDS) Faster and more effective countermeasures are needed to cope with the ever-growing number of detected attacks. Legg et al., 2015 Empirical Investigation via experiment Ten scenarios within a prototype system Anomaly
detection An approach for insider threat detection based on organizational log data, the
system generates user and role-based profiles that can describe
the full extent of activities that users perform within the organization. Mok et al., 2015 Literature review and synthesis A publication search between 1990 to November 2012
Vital Signs Observation chart designs together with
proper training can most likely improve the detection of deteriorating vital signs.