Prediction of Core Losses of Three-Phase Distribution
Transformer
Mihail Digalovski, Krste Najdenkoski and Goran Rafajlovski
Faculty of Electrical Engineering and Information Technologies, Karpos II, bb, Skopje 1000, Republic of Macedonia
Received: February 08, 2013 / Accepted: June 13, 2013 / Published: December 31, 2013.
Abstract: Transformers are normally designed and built for use at rated frequency and sinusoidal load current. A non-linear load on a transformer leads to harmonic power losses which cause increased operational costs and additional heating in transformer parts. It leads to higher losses, early fatigue of insulation, premature failure and reduction of the useful life of the transformer. To prevent these problems, the rated capacity of transformer which supplies harmonic loads must be reduced. In this work, a typical 50 kVA three-phase distribution transformer with real practical parameters is taken under non-linear loads generated due to domestic loads. The core losses is evaluated using the three dimensional model of the transformer developed in FEM (finite element method) program based on valid model of transformer under high harmonic conditions. And finally a relation associated with core losses and amplitude of high harmonic order are reviewed & analyzed and then a comparison is being carried out on the results obtained by different excitation current in transformer windings.
Key words: Core losses, three-phase transformer, harmonic, 3D model, finite element method, magnetic flux distribution.
1. Introduction
The power transformer is one of the most important and expensive equipment of electric power systems. Cost-effective operation of electric power generation, transmission and distribution systems is related to reliability and availability of their power transformers. However, most investigations have been performed for the three-phase three-limb core, generally since the vast majority of all built transformers have cores of this type. As an example, Valkovic [1, 2] has investigated the effect of core geometry, core material, joint design and induction on core losses, primarily for three-phase three-limb cores, and to some degree for single-phase transformers. Valkovic and Rezic [3, 4] also investigated the effect of the step lap koint design on core losses.
The present day situation dictates fewer very large transformers where the transportation height
Corresponding author: Krste Najdenkoski, Ph.D., associate professor, research fields: power transformer, wind energy and power quality. E-mail: krste@feit.ukim.edu.mk.
limitations would force the design to be a three-phase five-limb core or have the transformer bank split up into three single-phase transformers. However, there are not abundant analytical works dealing with transformer core losses which have been focused upon this type of cores. From rare research works in this field, Chen and Neudorfer [5] had a motivation for developing a transient model for the five-limb transformer with an interest in transformer ferroresonance, a problem which has been vexing the power industry for over 60 years. Mairs et al. [6] also studied this type of transformers from overvoltages point of view. Due to calculation of transformer losses, teNyenhuis et al. [7] employed 2-D FDM (finite difference method) to predict flux distribution and magnetic loss in cores with this structure. In spite of high precision, such calculation needs considerable degrees of processing ability [8].
In the past years, there has been an increased concern for the effects of nonlinear loads on the electric power system. Nonlinear loads draw current which is not
D
sinusoidal and include such equipment as fluorescent lamp, gas discharge lighting, electronic motor drives, electrical energy converters, static converters, rectifiers, arc furnaces, electronic phase control, switch mode power supplies, pulse width modulated drives and the increasingly common electronic power supply causes generation of harmonics. Harmonics are voltages and currents which appear on the electrical system at frequencies that are integral multiples of the generated frequency. It results to a significant increase in level of harmonics and distortions in power system. Transformers are one of the component and usually the interface between the supply and most non-linear loads. They are manufactured for operating at the linear load under rated frequency. Nowadays the presence of nonlinear load results in production harmonic current. Increasing in harmonic currents causes extra loss in transformer winding and thus, leads to increase in temperature, reduction in insulation life [9]. Harmonic voltage increase losses in its magnetic core while harmonic currents increased losses in its winding and structure. In general, harmonics losses occur from increased heat dissipation in the windings and skin effect both are a function of the square of the rms current, as well as from eddy currents and core losses. This extra heat can have a significant impact in reducing the operating life of the transformer insulation the increased of eddy current losses that produced by a non-sinusoidal load current can cause abnormal temperature rise and hence excessive winding losses. Therefore, the influence of the current harmonics is more important. From the above there is a need for detailed analysis of the impact of higher order harmonics on core losses (no-load losses) in transformers [10].
2. Core Loss
2.1 Hysteresis Loss
A significant contribution to no-load losses comes from hysteresis losses. Hysteresis losses originate from the molecular magnetic domains in the core
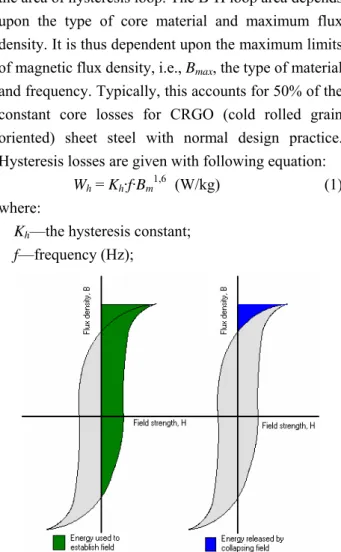
laminations, resisting being magnetized and demagnetized by the alternating magnetic field. Each time the magnetising force produced by the primary of a transformer changes because of the applied AC voltage, the domains realign them in the direction of the force. The energy to accomplish this realignment of the magnetic domains comes from the input power and is not transferred to the secondary winding. It is therefore a loss. Because various types of core materials have different magnetizing abilities, the selection of core material is an important factor in reducing core losses. Hysteresis is a part of core loss. This depends upon the area of the magnetizing B-H loop and frequency. Refer Fig. 1 for a typical B-H loop.
Energy input and retrieval exist while increasing and decreasing current. Loss per half cycle equals half of the area of hysteresis loop. The B-H loop area depends upon the type of core material and maximum flux density. It is thus dependent upon the maximum limits of magnetic flux density, i.e., Bmax, the type of material
and frequency. Typically, this accounts for 50% of the constant core losses for CRGO (cold rolled grain oriented) sheet steel with normal design practice. Hysteresis losses are given with following equation:
Wh = Kh·f·Bm1,6 (W/kg) (1)
where:
Kh—the hysteresis constant; f—frequency (Hz);
Bm—maximum flux density (T). 2.2 Eddy Current Losses in the Core
The alternating flux induces an EMF in the bulk of the core proportional to flux density and frequency. The resulting circulating current depends inversely upon the resistivity of the material and directly upon the thickness of the core. The losses per unit mass of core materials, thus vary with square of the flux density, frequency and thickness of the core laminations. By using a laminated core (thin sheets of silicon steel instead of a solid core), the path of the eddy current is broken up without increasing the reluctance of the magnetic circuit. Refer Fig. 2 below for a comparison of solid iron core and a laminated iron core. Fig. 2b shows a solid core, which is split up by laminations of thickness d1 and depth d2 as shown in Fig. 2c. This is
shown pictorially in Fig. 2a.
Eddy current losses are given with following equation:
We = Ke·Bm2·f2·t2 (W/kg) (2)
where:
Ke—the eddy current constant; f—frequency in Hz;
Bm—maximum flux density (T); t—thickness of lamination strips.
For reducing eddy current losses, higher resistivity core material and thinner (typical thickness of laminations is 0.35 mm) lamination of core are used. This loss decreases very slightly with increase in temperature. This variation is very small and is neglected for all practical purposes. Eddy losses contribute to about 50% of the core losses [9].
Fig. 2 Core lamination to reduce eddy current losses.
2.3 Effect of Harmonics on Core Losses
Transformer manufacturers usually try to design transformers in a way that their minimum losses occur in rated voltage, rated frequency and sinusoidal current. However, by increasing the number of non-linear loads in recent years, the load current is no longer sinusoidal. This non-sinusoidal current causes extra loss and temperature in transformer. Transformer loss is divided into two major groups, no load and load loss:
PTL = PNL + PLL (3) where, PNL is no-load loss (core loss), PLL is load loss,
and PTL is total loss. A brief description of core losses
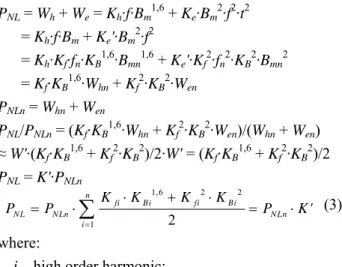
and harmonic effects on them is presented in following: No load loss or core loss appears because of time variable nature of electromagnetic flux passing through the core and its arrangement is affected the amount of this loss. Since distribution transformers are always under service, considering the number of this type of transformer in network, the amount of no load loss is high. These losses are proportional to frequency and maximum flux density of the core and separated from load currents. No-load losses are given with following equation: PNL = Wh + We = Kh·f·Bm1,6 + Ke·Bm2·f2·t2 = Kh·f·Bm + Ke'·Bm2·f2 = Kh·Kf·fn·KB1,6·Bmn1,6 + Ke'·Kf2·fn2·KB2·Bmn2 = Kf·KB1,6·Whn + Kf2·KB2·Wen PNLn = Whn + Wen PNL/PNLn = (Kf·KB1,6·Whn + Kf2·KB2·Wen)/(Whn + Wen) ≈W'·(Kf·KB1,6 + Kf2·KB2)/2·W' = (Kf·KB1,6 + Kf2·KB2)/2 PNL = K'·PNLn 1,6 2 2 1 2 = ⋅ + ⋅ = ⋅
∑
n fi Bi fi Bi = ⋅ NL NLn NLn i K K K K P P P K' (3) where:i—high order harmonic; K'—constant; Ke' = Ke·t2—constant;
=
i 1 fi f K f—high order harmonic frequency ratio;
=
m i m 1 Bi B K Bdensity ratio;
Whn, Wen—nominal hysteresis and eddy current losses; W' = Whn = Wen—approximation for equality of
nominal hysteresis and eddy current losses.
3. Analyzed Transformer
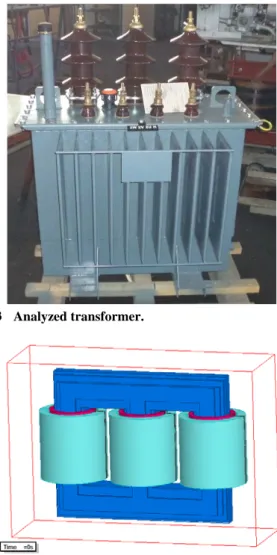
The object of study is a three-phase (three-leg core type; oil immersed) distribution transformer, type T50-24, with winding configuration Yzn5. The rated data of the transformer are: Sn = 50 kVA; U1/U2 =
20/0.4 kV; Si = 24 kV; I1/I2 = 1,443/72.17 A; ukn = 4%; fn = 50 Hz; p = ±2 × 2.5%; Yzn5. Transformer is presented in Fig. 3.
4. Transient 3D Model for Determination of
Core Losses
The first step of the finite element modeling is to construct a three dimensional model of the three-phase transformer. Transformer model is drawn directly into the FEM 3D program and is presented in Fig. 4. Solution type in the model is transient, because current loads are alternating sinusoidal variables [11].
The model is made in accordance with the geometry of the transformer. Transformer core is dark blue colored, low voltage windings with red color and high voltage windings with light blue. Three dimensional frameworks are representation of transformer box in which electromagnetic phenomena are considered. All parts of the transformer in the input database are listed relevant materials from which they are made. Windings are defined with number of turns and cross section area; for transformer core the exact magnetizing curve and specific core losses vs. magnetic flux density curve are loaded. Lamination of the transformer core and stacking factor is taken in consideration. Boundary conditions are defined on the surface of transformer tank and that limited part of space is domain of interest. They are of the Dirichlet type (I order) and are set on the outer surfaces of the domain. Also that tangential component Ht of the magnetic field vector is a
continuous function, while the normal component Hn is
Fig. 3 Analyzed transformer.
Fig. 4 3D simulation model of three-phase transformer. zero. This means that magnetic field lines will be parallel to the border area. Figs. 5 and 6 presented B-H and P-B curves.
In order to provide correct numerical computational results for core losses, the mesh in the region of interest should be with high density. Meshed model of transformer is presented in Fig. 7.
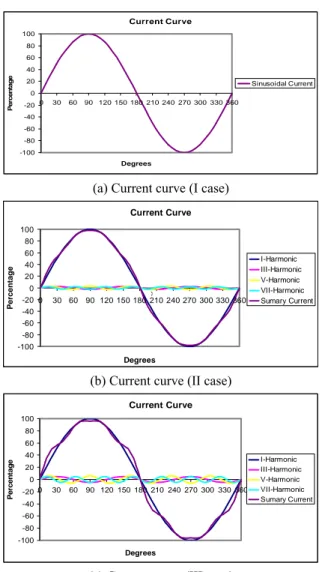
The transient models are defined three cases of current load and shown in Table 1.
For those three cases of loading, in program postprocessor are reading core losses and they are compared with the approximate analytical values. Hence, reflected the impact and change core losses by changing of harmonic components in excitation currents.
Currents wave form for the three typical cases are given in Figs. 8a-8c.
0.00E+000 5.00E+004 1.00E+005 1.50E+005
H (A_per_meter) 0.00 0.50 1.00 1.50 2.00 B ( tes la ) Fig. 5 B-H curve. 0.00 0.25 0.50 0.75 1.00 1.25 1.50 1.75 2.00 B (Tesla) 0.00 0.50 1.00 1.50 2.00 2.50 3.00 P Fig. 6 P-B curve.
Fig. 7 Meshed model of the three-phase transformer. Table 1 Three cases of current load for transient models.
Harmonic Order case KB1 (%) KB3 (%) KB5 (%) KB7 (%) 1 100 0 0 0 2 100 2.5 3 2.5 3 100 5 6 5
5. Results and Comparison of Results
After completion of preprocessor phase and transformer discretisation with finite elements, the model is ready for processing. At this phase, Maxwell’s equation system to solve numerically and its solution is obtained magnetic field intensity H for each individual
Current Curve -100 -80 -60 -40 -20 0 20 40 60 80 100 0 30 60 90 120 150 180 210 240 270 300 330 360 Degrees Per c en ta g e Sinusoidal Current
(a) Current curve (I case)
Current Curve -100 -80 -60 -40 -20 0 20 40 60 80 100 0 30 60 90 120 150 180 210 240 270 300 330 360 Degrees Pe rc e n ta g e I-Harmonic III-Harmonic V-Harmonic VII-Harmonic Sumary Current x
(b) Current curve (II case)
Current Curve -100 -80 -60 -40 -20 0 20 40 60 80 100 0 30 60 90 120 150 180 210 240 270 300 330 360 Degrees Pe rc e n ta ge I-HarmonicIII-Harmonic V-Harmonic VII-Harmonic Sumary Current
(c) Current curve (III case)
Fig. 8 (a) Current curve (I case); (b) current curve (II case); (c) current curve (III case).
finite elements. Distribution of the magnetic field is obtained by association of all the values in the domain. The magnetic field intensity H can be expressed
magnetic flux density B and its distribution (as a range
of colors) is presented in Fig. 9. Obtained magnetic flux density distribution is for rated load of the transformer (I case, only with first harmonic). Fig. 10 is given volumetric density of core losses.
Figs. 11 and 12 presented magnetic flux density distribution and core losses volumetric density (II case).
Figs. 13 and 14 presented magnetic flux density distribution and core losses volumetric density (III case).
After calculation of distributions of magnetic flux density and volumetric density of core losses for all three cases, in the postprocessor are reading summary
Fig. 9 Distribution of magnetic flux density (I case).
Fig. 10 Volumetric density of core losses (I case).
Fig. 11 Distribution of magnetic flux density (II case).
Fig. 12 Volumetric density of core losses (II case).
Fig. 13 Distribution of magnetic flux density (III case).
Fig. 14 Volumetric density of core losses (III case). Table 2 The analytical calculated losses for all three cases.
Method
Core losses Simulation Analytical Measured Relative deviation (%) Increasing of core losses (%)
Pcore1(W) 170.7 / 168.2 1.49 /
Pcore2 (W) 174.4 176.6 / -1.25 2.17
Pcore3 (W) 197.2 200.2 / -1.48 15.52
losses in the transformer core and they are shown in Table 2, together with the analytical calculated losses.
6. Conclusions
The wide spread utilization of electronic devices has significantly increased the numbers of harmonic generating apparatus in the power systems. This harmonics cause distortions of voltage and current
waveforms that have negative effects on transformers as increased total losses.
This paper has described distribution transformer no-load losses, as well as the harmonic impact on no-load losses, and has introduced a methodology based on FEM model to predict satisfactory the harmonic impact on core distribution transformer. The methodology introduced in this paper, if implemented
at the design stage of distribution transformers, may provide great services in reducing the no-load losses.
References
[1] Z. Valkovic, Recent problems of transformer core design, Physica Scripta T24 (3) 1988 71-74.
[2] Z. Valkovic, Flux and loss distribution in three-limb core with staggered T-joint, IEEE Transaction Magnetics MAG 18 (2) (1982) 801-804.
[3] Z. Valkovic, A. Rezic, Flux and loss distribution in three-limb core with staggered T-joint, in: Symposium on Electromagnetic Fields in Electrical Engineering, Lodz, Poljska, Sept. 1988, pp. 85-88.
[4] Z. Valkovic, A. Rezic, Improvement of transformer core magnetic properties using the step-lap design, Journal of Magnetism and Magnetic Materials 112 (1992) 413-415. [5] X.S. Chen, P. Neudorfer, Digital model for transient
studies of a three-phase five-legged transformer, IEEE Proceedings-C 139 (4) (1992) 351-358.
[6] D.D. Mairs, D.L. Stuehm, B.A. Mork, Overvoltages on
five-legged core transformers on rural electric systems, IEEE Transaction Industry Applications 25 (2) (1989) 366-370.
[7] E.G. teNyenhuis, G.F. Mechler, R.S. Girgis, Flux distribution and core loss calculation for single phase and five limb three phase transformer core design, IEEE Transaction Power Delivery 15 (1) (2000) 204-209. [8] E. Hajipour, P. Rezaei, M. Vakilian, M. Ghafouri, Power
transformer no-load loss prediction with FEM modeling and building factor optimization, Journal of Electromagnetic Analysis and Applications 3 (10) (2011) 430-438.
[9] A.M.A. Haidar, S. Taib, I. Daut, S. Uthman, Evaluation of transformer magnetizing core loss, Journal of Applied Sciences 6 (2006) 2579-2585.
[10] A. Gupta, R. Singh, Computation of transformer losses under the effects of non-sinusoidal currents, Advanced Computing: An International Journal (ACIJ) 2 (6) (2011) 91-104.
[11] S.T. Lundmark, Y. Serdyuk, S. Gubanski, Computer Model of Electromagnetic Phenomena in Hexaformer, Chalmers University of Technology, Goteborg, 2007.