The
Past,
Present
and
Future
of
AIDS
Resource
Allocation
Steven
Forsythe,
Futures Institute
John
Stover,
Futures Institute
Lori
Bollinger,
Futures Institute
1
Table of Contents
Acronyms ... 2
Executive Summary ... 4
Background ... 5
Objective ... 7
An Evidence-Based Allocation Strategy ... 8
Description of Costing and Resource Allocation Models ... 17
Experience with One Resource Allocation Tool ... 20
The Future of Resource Allocation ... 28
Conclusions ... 30
2
Acronyms
ABCE Allocating by Cost-Effectiveness Model AIDS Acquired Immune Deficiency Syndrome
ANC Antenatal Clinic Survey
BCC Behavior Change Communication
DHS Demographic and Health Survey
ART Antiretroviral Therapy
HIV Human Immunodeficiency Virus
IDU Injecting Drug Users
PMTCT Prevention of Mother to Child Transmission
MAP Multi-Country HIV/AIDS Program
MARPs Most At-Risk Populations
MSM Men Who Have Sex with Men
NASA National AIDS Spending Assessment
NMSF Tanzanian National Multi-Sectoral Framework
NSP National Strategic Plan
PEPFAR President’s Emergency Plan for AIDS Relief PMTCT Prevention of Mother to Child Transmission
RNM Resource Needs Model
STI Sexually Transmitted Infection
TACAIDS Tanzania Commission for AIDS
UNAIDS United Nations Joint Programme on HIV/AIDS
UNGASS UN General Assembly Special Session on HIV and AIDS VCT Voluntary Counseling and Testing
3
Acknowledgements
The authors would like to express their appreciation for the aids2031 Costs and Financing Project, led by Rob Hecht and his team at Results for Development. Extensive comments and feedback of an earlier draft were received from the Costs and Financing Project during a Technical Review Meeting held in Washington DC on February 12 and 13, 2009. The authors would also like to express our appreciation for the extensive review provided by Mattias Lundberg from the World Bank and William McGreevey from Georgetown University. The authors would also like to thank Eric Gaillard, who provided the Goals applications for Honduras and Lesotho.
4
Executive Summary
How could HIV and AIDS resources be allocated to achieve the greatest possible impact? This paper begins with a theoretical discussion of this issue, describing the key elements of an “evidence-based allocation strategy.” While it is noted that the quality of epidemiologic and economic data remains inadequate to precisely define such an optimal strategy, there do exist tools and research which can lead countries in a way that they can make better allocation decisions. Furthermore, there are clear indications that most countries are not allocating their HIV and AIDS resources in a way which is likely to achieve the greatest possible impact. For example, it is noted that neighboring countries with a similar prevalence of HIV nonetheless often allocate their resources in radically different ways.
These differing allocation patterns appear to be attributable to a number of different issues, including a lack of data, contradictory results in existing data, a perceived need to overemphasize a
multisectoral response, a lack of political will, a general inefficiency in the use of resources when they do get allocated, poor planning and a lack of control over the way resources get allocated.
There are a number of tools currently available which can improve the resource allocation process. Tools such as the Resource Needs Model (RNM) can provide policymakers with a clearer idea of resource requirements, whereas other tools such as Goals and the Allocation by Cost-Effectiveness (ABCE) models can provide countries with a clearer vision of how they might reallocate funds. Next, examples from nine different countries provide information about how countries are trying to make their resource allocation strategies more “evidence based”. By identifying the challenges and successes of these nine countries in making more informed allocation decisions, it is hoped that future resource allocation decisions for all countries can be improved.
In addition, the authors discuss the future of resource allocation, noting the types of additional data which will be required and the improvements in existing tools which could be made.
5
Background
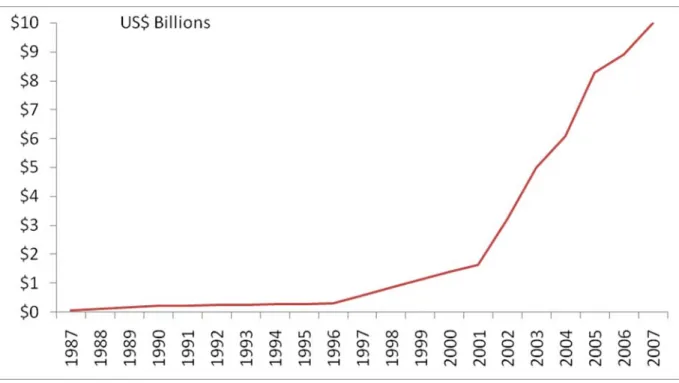
In 2001, demographers, epidemiologists and economists, under the direction of the World Health Organization and UNAIDS, were asked to estimate the resources required to achieve the newly developed UNGASS targets [1]. The $9.2 billion projection represented an optimistic estimate of the level of resources which could be generated by 2005, considering that the global level of resources for HIV and AIDS were only $1.6 billion in 2001.
One of the great successes in the response to the HIV and AIDS pandemic has been the rapid increase in resources for the global response, as shown in Figure 1. From the UN General Assembly Special Session on HIV and AIDS in 2001 to the most recent estimates of global spending in 2007, the level of funding has grown more than 6 fold to $10 billion[2]. The actual level of spending in 2005 reached $8.3 billion [2], or 90% of the resources determined to be required in the original 2001 resource needs estimates.1
Figure 1: Global HIV and AIDS Spending (1987-2007)
1 Estimates of global resource needs have been reassessed on a regular basis. The most recent assessment projects needs in
2015 of USD 22-54 billion, under three different assumptions about the pace of scale-up.
2.Financial Resources Required to Achieve Universal Access to HIV Prevention, Treatment, Care and Support. 2007, UNAIDS: Geneva, Switzerland.)
6
While no single factor can fully explain why the growth in spending has occurred so rapidly, it can be partially explained by a number of critical events, including:
• The launch of UNAIDS in 1996;
• The introduction of the World Bank MAP program and the Bill and Melinda Gates Foundation in 2000;
• The UN General Assembly Special Session on HIV and AIDS (UNGASS) in 2001;
• The start of the Global Fund in 2002;
• The launch of PEPFAR in 2003;
• The G8 Summit in 2005 and the corresponding commitment to universal access.
While the actual resources spent in 2005 came relatively close to the target of $9.2 billion, it is important to remember that the real goal was to scale-up the delivery of services and to change behaviors, not to generate new resources.
A review of the actual achievements relative to the expected achievements is not as impressive. The 2006 Report on the Global AIDS Epidemic concluded that of 6 targets evaluated, only one was
achieved. That one success was financial: the generation of between USD 7-$10 billion in funding by 2005 [3]. One target was to have 90% of young people be able to identify ways of preventing HIV transmission and to reject major misconceptions about HIV transmission. On average, only 33% of males and 20% of females met this requirement in UNGASS reporting countries; none of the countries was able to achieve the targeted level of 90% coverage. Another target was that there would be 80% coverage of PMTCT programs, a target which again wasn’t achieved by any of the reporting countries in 2005.
The original resource requirement estimates were based on an assumption that 6 billion condoms would be distributed annually; by 2005, 5 billion condoms were actually distributed (83% of the original target) [4]. Reaching vulnerable populations proved to be more difficult, however; only 61% of the estimated number of sex workers targeted were actually reached, while only 37% of those injecting drug users (IDU) who were assumed to be reached with the resources were actually reached. Difficulties were also encountered in providing care: only 31% of those targeted to receive
antiretroviral therapy (ART) were reached and only 28% of the PMTCT target was actually reached. The one target that was achieved was the number of people receiving VCT services, which succeeded in reaching 185% of the original estimate. In other words, despite generating 90% of the required resources, most of the targets were not achieved [4, 5].
Thus, while the global response did succeed in rapidly generating new resources, it did not succeed in fully generating the services and the behavior change which was anticipated. This suggests that either the original projections were overly optimistic about what could be achieved with the
resources, or the world spent its HIV and AIDS resources in a much more ineffective (or inefficient) way relative to what was originally assumed.
Given the current financial crisis and the potential for donors to redirect their attention and resources to other priorities, it is important to assess how current resources have been spent and ask how resources might be allocated to assure the achievement of targets in the future. How can resources be spent to reach those groups most at risk? Will the allocation of resources be consistent with what is known about the effectiveness of interventions? Can the response of the past decade be sustained or improved upon even if the rapid growth in resources does not continue?
7
Objective
This paper was developed with three objectives in mind. The first objective, addressed in Section III, is to identify some of the challenges and inconsistencies in the ways current HIV and AIDS resources are allocated at the national level. This section of the report will define an “evidence-based allocation strategy” and assess if countries are making allocation decisions based on such evidence.
Section III will also look at how countries are currently spending their HIV and AIDS resources, with a particular focus on whether these current allocation patterns appear to be more driven by politics and wishful thinking, or if they are more driven by evidence and careful planning. This section will also discuss why some countries may not be following an “evidence-based allocation strategy.” The second objective is to review some of the national-level experiences in trying to improve the resource allocation process. Section V will address this objective by identifying and explaining the experience of groups using evidence-based tools, such as the Resource Needs Model (RNM) [6] and the Goals Model [7].
The third objective is to assess how resource allocation in the future might be improved through encouraging countries to pursue an “evidence-based allocation strategy”. Section VI discusses how current and future tools might be improved to address the growing need for better resource allocation.
8
An Evidence-Based Allocation Strategy
The simplest definition of an “evidence-based allocation strategy” is one in which resources are spent in a way that is, based on the best currently available evidence, likely to achieve the greatest possible result. In the case of HIV and AIDS, results are generally defined in terms of preventing new infections, providing care and treatment and mitigating impact.
How Should HIV and AIDS Resources be Spent?
An ideal approach for assessing how countries should optimally allocate resources would involve comparing a country’s actual spending patterns on HIV and AIDS to some known optimal allocation pattern. Countries which differed significantly from the optimal allocation pattern would be
considered to need to reallocate their funds. Countries closest to the optimal allocation would be the ones which would not need to reallocate (and presumably would be provided with more money by donors in recognition of allocating their resources effectively).
For example, perhaps Country A is currently spending only 2% of its HIV and AIDS prevention resources on reaching injecting drug users (IDU), even though IDU are an important driver of the epidemic. The country’s 5 year HIV and AIDS strategy indicates that IDU are not a priority and will continue to receive only a small proportion of all prevention resources. However, the optimal
allocation pattern suggests that Country A should be spending more than 20% of its resources on IDU. In this case the country might be encouraged to rethink their plans and increase spending on this critical subpopulation. If the misallocation was not corrected, the country might receive less money from international donors in the future, since the country is not allocating its resources effectively.
Many governments have not acted in a fully responsive manner to protect their populations from HIV infection or death from HIV disease. Many countries, rich and poor, still fail to devote adequate resources to address their national epidemics, choose not to implement evidence-based programming, or ignore the needs of marginalized groups affected by HIV [8].
Alternatively, Country B has pursued an “evidence-based allocation strategy”, carefully assessing its epidemic, the cost-effectiveness of its interventions, synergies between interventions, the policy environment, etc. Using this evidence, Country B has established clear and logical priorities and has allocated its resources accordingly. In this case, donors may choose to assign more funds to Country B, because that country is more likely to have an impact on its epidemic.
Unfortunately at this time, this ideal approach is not entirely feasible, in part because there is no known optimal allocation of HIV and AIDS resources [9].2 Even if an optimal allocation pattern did
exist, it would need to be significantly modified for each individual country to reflect differences in HIV prevalence and/or incidence levels, modes of HIV transmission and unit costs.3
However, even considering the current lack of data, one would still expect some consistency in the way resources are allocated based on the epidemiologic and economic data available. If resource allocation decisions are actually being informed by an evidence-based allocation strategy rather than being made randomly or based on purely political factors,4 then one might expect that neighboring
2 With the availability of better prospective information on spending patterns and HIV prevalence, it may become possible in
the near future to design optimal allocation strategies, based on what has worked to reduce prevalence/incidence, increase treatment, and minimize the impact of HIV and AIDS.
3 Even countries with similar epidemics, similar modes of transmission and similar unit costs might choose to
allocate their resources in different ways due to cultural and political differences (e.g., some countries might place a higher weight on equity, for example, while other countries might emphasize cost-effectiveness).
4 This is not to suggest that making decisions based on the political reality which exists in a country is wrong. In fact in
9
countries, with a similar prevalence of HIV, would allocate their resources in somewhat similar patterns. Is this the case?
How are Resources Currently Being Spent?
With the advent of National AIDS Spending Assessments (NASA), much more is currently known about the ways in which HIV and AIDS resources are being spent[10]. The 2008 UNAIDS Global Report on the epidemic provides an informative, albeit imperfect, summary of HIV and AIDS spending from country to country[11]. This provides a unique opportunity to analyze for the first time how HIV and AIDS resources are currently being spent. Is money being spent on those interventions which will achieve the greatest possible impact, or are the resources being randomly allocated to various interventions, based on the hope that everything will have some impact?
Figure 2 shows the reported expenditure of HIV and AIDS funds in Sub-Saharan Africa.5 The list of
countries is ordered from the lowest prevalence country (Madagascar, with an adult prevalence of 0.1%) to the highest prevalence country (Swaziland, with an adult prevalence of 26.1%). On average, these 23 countries spend 40% of their resources on care and treatment, 25% on prevention, 18% on administration and management, 9% on other items6 and 8% on orphans and vulnerable children.
As the figure shows, lower prevalence countries allocate a higher proportion of their resources to prevention, while higher prevalence countries spend a larger percentage on care and treatment. For example, the 8 countries with prevalence below 2% spend 38% of their resources on prevention, and only 23% on care and treatment. Meanwhile the 5 countries with a prevalence of over 15% spend only 17% of their resources on prevention and 48% on care and treatment. This allocation is
consistent with what one might expect; low prevalence countries have a lower burden of treatment and therefore allocate a greater share of their resources to prevention. High burden countries should be spending heavily on prevention but will have much greater need for treatment.
successfully reach MSM. In this case it would probably make more sense to first allocate funds to address the negative policy environment and then to invest in direct interventions to reach MSM.
5 Note that Figures 2, 3 and 4 were developed to show the proportions of all resources spent on different interventions. The
graphs don’t show the absolute amount of spending, which may influence how countries allocate their funds.
6 “Other HIV expenditures” in Figures 2 and 3 include human resources, social protection and social services, an enabling
10
Figure 2: Allocation of HIV/AIDS Resource in Sub-Saharan Africa
However, it is also worth noting that there appear to be some significant outliers. For example, the DRC reports spending 32% of its resources on administration, almost twice as much as the average for all 23 countries. Ghana, with a prevalence of only 1.9%, reports spending the highest proportion of any country on care and treatment (69% of all resources). Even when comparing two high prevalence countries, such as Botswana (prevalence of 24%) and Swaziland (prevalence of 26%), the resource allocation patterns differ significantly. Botswana is currently spending the largest proportion of its resources on care and treatment, while Swaziland is spending most of its resources on orphans and vulnerable children. As a result, Botswana had 76% ART coverage in 2006, while Swaziland had only 35% [11].
The allocation of resources appears to be even more random in Eastern Europe and Central Asia, as shown in Figure 3. The lowest prevalence country, Croatia, spends the largest proportion of its funds on care and treatment, which is contrary to what would be expected. Moving from the lowest prevalence countries on the left to the highest prevalence countries in the region on the right, there appears to be little consistency or pattern in the way resources are spent. Even neighboring countries with a similar prevalence of HIV, such as Kazakhstan and Kyrgyzstan, spend their HIV and AIDS
resources in radically different ways. Kazakhstan spends most of its resources on program support, whereas Kyrgyzstan spends most of its resources on prevention.
11
Figure 3: Distribution of HIV Expenditures in Eastern Europe/Central Asia
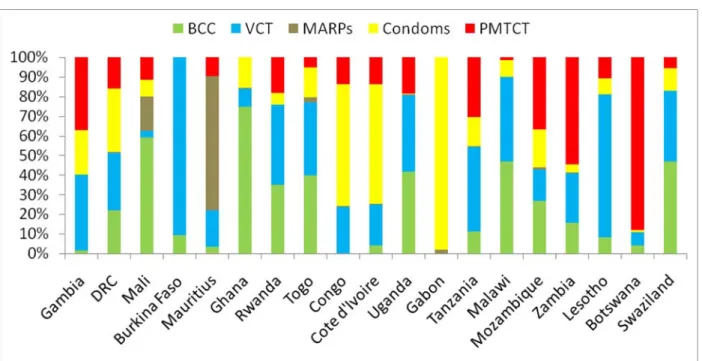
The analysis becomes even more revealing when specifically evaluating the allocation of resources on prevention programs. In Figure 4, Sub-Saharan countries are again arranged from the lowest
prevalence countries on the left to the highest prevalence countries on the right. In this case, the allocation of prevention resources appears to occur in a random pattern. Again looking at the two highest prevalence countries, Botswana and Swaziland, the approach to allocating prevention resources appears to be markedly different. In the case of Botswana, most prevention resources are spent on PMTCT, whereas Swaziland appears to spend a small proportion of its resources on this intervention. On the other hand, Swaziland appears to spend most of its resources on BCC and VCT, two interventions which are allocated a much smaller proportion of all resources in Botswana.
12
Figure 4: Allocation of Prevention Resources in Sub-Saharan Africa
There are also numerous examples cited of misallocations of funds in Asia, as reported in Elizabeth Pisani’s book “The Wisdom of Whores [12].” For example, in China, 90% of HIV transmission is attributable to MSM or IDU, yet 54% of all donor prevention money is allocated to the “general population.”
National policymakers are not the only stakeholders who appear to misallocate funds. In Accra, Ghana, for example, it has been estimated that 76% of all new HIV infections occur between sex workers and their partners, while the remaining 24% of all new infections occur within the general population [13]. However, the World Bank MAP program in Ghana estimates that it spends only 0.8% of its resources on sex worker interventions and spends 99.2% of HIV and AIDS resources on the general population [14]. These data suggest that the World Bank, at least in the case of Ghana, also appears to fail to allocate its own resources based on evidence regarding the main drivers of the epidemic.7
Reviewing the ways in which countries allocate their resources, it becomes difficult to demonstrate that countries are actually pursuing an “evidence-based allocation strategy.” Neighboring countries with similar HIV prevalence levels spend resources in radically different ways. Spending patterns appear to be only nominally related to the severity of the epidemic in Sub-Saharan Africa, and are totally unrelated to prevalence in the rest of the world. Prevention resources appear to be allocated randomly, with no evidence showing that countries allocate their spending based on evidence about the source of new HIV infections.
7 One caveat is worth noting in regards to the appropriate allocation of funds. If the cost to reach the general population and
to change their behavior is much higher than the cost of reaching and changing the behavior of sex workers, it may be quite logical to allocate more fund to the general population than sex workers. In other words, an appropriate allocation of funds takes into consideration not only where new HIV infections are occurring, but also considers unit costs of reaching each population.
13
Why Don’t Countries Allocate Resources Based on Evidence?
If countries are not pursuing an “evidence based allocation strategy,” the next question is to ask why. A number of possible explanations are listed below.
Lack of Data
One possible explanation for poor resource allocation is that countries don’t have access to the
information required to make rational decisions regarding the allocation of HIV and AIDS funds. This is a very plausible explanation, given that most countries don’t have access to data about the cost-effectiveness of different interventions. While there are data which suggest that some interventions may be more cost-effective than others [15-17], these data are often inadequate for the purpose of policymakers. For example, some studies were conducted in Africa, but policymakers in Latin America were hesitant to accept these data as being applicable to their region.
However, the lack of data cannot fully explain the path some countries take in allocating resources. Even when data are available and reliable, it has been our experience that they are only used to a limited extent when making planning decisions.
Contradictory Results
When effectiveness and/or cost-effectiveness data do become available, there are often contradictory messages derived from these results. For example, early economic analysis suggested that PMTCT interventions would not be affordable in South Africa [18]. Subsequent analyses concluded that not only would PMTCT be affordable, but it would also be cost-effective and potentially cost-savings in South Africa [19-21].
Retrospective data from Uganda about the country’s success in reducing HIV prevalence has also produced contradictory results. In some cases, it has been suggested that prevalence reductions were attributable to behavior change which occurred as a result of a rapidly scaled-up VCT program [22]. However, other studies have suggested that prevalence reductions occurred as a result of the country’s “zero grazing” campaign [23]. Still other studies suggest that the initial behavior change didn’t occur because of any intervention, but because of the response of Ugandans to observed deaths [24].
Data about the effectiveness of STI treatment has also demonstrated mixed results. On the one hand, an early randomized control trial suggested that STI treatment would have a significant impact on the prevalence of HIV [25]. However, subsequent studies suggested that this impact was much less than anticipated [26].
Other analyses have produced contradictory results about where current infections are actually occurring. In Zambia, for example, it has been argued that commercial sex is not a significant driver of that country’s epidemic, with only 7% of new infections occurring among traditional vulnerable groups (sex workers, clients, truck drivers and uniformed services). The Goals model analysis,
however, indicated that commercial sex represents a much more significant problem, with 21% of all new HIV infections within this population [27].
Contradictory results have also been reported in Uganda, where David Wilson of the World Bank has argued that 65% of all new infections occur among married couples, thus justifying an allocation of resources which is more generalized. However, David Apuuli of Uganda’s AIDS Commission argues that sex work still represents a major mode of transmission, thus justifying a more targeted approach and a more focused allocation of resources [28]. These results leave policymakers with uncertainty about where new HIV infections will actually occur and how best to allocate limited resources.
14
Multisectoral Response
A third possible explanation why resources are not better focused on key interventions is that HIV and AIDS are viewed as an epidemic requiring a multisectoral response. An example of this argument is contained in the statement below, from the Tanzanian National Strategic Plan (NSP) (2003-2007).
All major elements of the National Response have to be in place if the response is likely to achieve its desired impact. The NMSF does not attempt to prioritize among those objectives or strategies. It insists on the comprehensiveness of the response, knowing that due to preferences, experiences, resources available, etc. priorities will have to be established in distinct areas once Operational Plans and Activities are developed. It is one of the most important tasks of TACAIDS as the main guardian of the National Response to ensure that all areas are covered and balances between the areas are maintained or (re-) established [29].
This perspective has some merit for a number of reasons. It has been shown that a multisectoral response not only generates more resources, but also takes advantage of synergies which can exist when people are approached with HIV and AIDS messages from varying sources (e.g., mass media, peer education, etc.) [30]. An approach which suggests that a country should spend all of its resources on one intervention (e.g., condoms) is unlikely to produce the same benefits as a holistic program which focuses on a wide variety of interventions. Thus STI treatment, condom distribution, ART and stigma and discrimination interventions (among others) are likely to have synergistic benefits which could not be achieved if a country merely spent all of its resources on a single, prioritized intervention. This argument in favor of an unprioritized, multisectoral response must be balanced against the
temptation to scatter resources across all interventions, with little or no priority given to those interventions likely to produce the greatest possible impact. As illustrated by the 1998 UNAIDS Strategic Planning Guidelines, countries should avoid the temptation of using a multisectoral process as an excuse to avoid prioritization.
The complexities of HIV sometimes have led governments to attempt planning for all eventualities. Moreover, donors and other external agencies have frequently added their own agendas to already unwieldy plans that cover many areas, resulting in generally low implementation rates, poor performance, and overburdening of scarce national staff. A more strategic approach concentrates on planning in priority areas, through identifying the epidemic’s most important determinants [31].
Political Will
Another explanation for why countries don’t allocate resources using an “evidence-based approach” is that countries lack the political will or support to address particular risk groups (for example, see “The Wisdom of Whores,” for an extensive explanation of why IDUs are seldom reached in Asia, despite their acute vulnerability to HIV) [12]. In many countries in Latin America and the Caribbean, for example, the epidemic pattern suggests that the top priority population group should be men who have sex with men (MSM). However, in much of Latin America, there is little support for spending resources on MSM, and thus policymakers may decide to instead focus their resources on addressing the general population.
Figure 5 confirms that MSM represent a large proportion of all AIDS cases in most of Latin America (in Costa Rica, for example, MSM represent more than 60% of all AIDS cases). However, the graphic shows that most prevention resources are not focused on MSM. In fact, in every country except Peru, the analysis suggests that resources are disproportionately small compared to the impact that MSM represent in terms of AIDS cases. In this case, it appears that resources are not being allocated where they can have the greatest possible impact.
15
Figure 5: AIDS Spending on MSM Relative to MSM Cases
The argument about spending resources on the general population rather than already stigmatized groups does have some merit. By focusing attention on MSM, for example, as a primary target population in Latin America, there is a possible risk that MSM would become further stigmatized and blamed for spreading the epidemic. However, a country’s national strategic goals are unlikely to be achieved if a predominance of resources is being spent on interventions that focus on relatively low risk populations, rather than on those subpopulations where the epidemic is actually spreading.
Inefficiency
Another possible explanation for why resources are not achieving the expected outputs is that the money is spent on interventions that are delivered inefficiently (for a review of the relevance of technical inefficiency in the allocation of HIV and AIDS resources, see Bautista-Arredondo, et al.) [9]. Thus an intervention like voluntary counseling and testing (VCT) may be shown to be highly cost-effective under certain conditions. However, when the resources are actually allocated to those organizations which deliver VCT services, these services are implemented inefficiently, resulting in a less-effective intervention and a poor allocation of resources.
Poor Planning
In a number of cases, a poor allocation of resources occurs as a result of poor planning. As has already been noted, countries such as Tanzania have avoided explicitly prioritizing interventions in their strategic plan, and have instead passed this responsibility on to their AIDS program [29]. Other countries, such as Nicaragua, identify so many prioritized populations in their strategic plan that the prioritization essentially becomes meaningless (Nicaragua identifies 11 populations in their plan, including young people, children exploited by violence, children exploited by sex, MSM, sex workers, mobile populations, prisoners, uniformed services, pregnant women, indigenous populations, and orphans) [32]. Other NSPs, such as those from Myanmar, prioritize “men and women of reproductive
16
age”, which covers such a large proportion of the entire population that it essentially eliminates any relevance to the prioritization process at all [33].
It is also not uncommon to find NSPs which prioritize certain interventions or populations, but then allocates the largest share of funds to interventions which are not prioritized. In Kenya, for example, the Ministry of Health’s 1999-2004 HIV/AIDS Strategic Plan indicated that the largest part of the budget should be for the procurement and distribution of STD drugs, even though the plan itself did not emphasize STD drug procurement as a priority in the plan [34].
Lack of Control over Resources
Another possible reason why resources may not be allocated to produce the greatest possible impact is that the country itself cannot control how resources are being spent. For example, some
international donors such as PEPFAR have their own agenda to fulfill in regards to allocating resources. In this case recipient countries are likely to be hesitant to turn down resources, even if those resources will skew the national response towards interventions which planners don’t believe will be successful.
In conclusion, there are various reasons why countries may not pursue an “evidence-based allocation strategy.” The most common reasons include a lack of data, contradictory results from research, the perceived need for a broad, multisectoral response, various political factors, inefficiency, poor planning and a lack of control over available resources. Each of these reasons has some validity, yet the overall result is that resources are being spent in a way that does not maximize their impact. The next section, therefore, addresses how some countries have used evidence-based tools to better allocate available resources.
17
Description of Costing and Resource Allocation Models
As described in Section III, there are various reasons why resources are not spent more strategically or based on the growing evidence about how best to allocate resources. The following section will review some of the experiences of countries that have tried to improve their resource allocation strategy.
Determining Resource Requirements
While determining resource requirements may be an ongoing process for most countries, the
challenge of estimating resource needs becomes most acute when a country is either designing a new (typically 5-year) HIV and AIDS strategic plan or developing a request for resources from donors (most typically Global Fund).
Unfortunately the costing of a strategic plan or a Global Fund proposal is usually conducted after all decisions about strategies and priorities have already been made. Thus the costing usually entails putting a monetary figure on decisions that have already been made, with little or no discussion about how different strategies or priorities may or may not be feasible given the available resources.
The Resource Needs Model (RNM) has been widely used to encourage countries to develop costed plans which are evidence-based [6]. RNM provides a set of global default unit cost estimates, which the user is encouraged to modify for their own particular country. RNM also requires users to estimate the size of their target populations and the baseline and planned coverage for their target
populations.
Without careful consideration of feasibility, a plan can quickly become a “wish list”. An example of this is Zambia’s Round 5 Global Fund application. In 2005, Zambia unsuccessfully requested USD 1 billion over 5 years from the Global Fund. As it turned out, the 26 countries which did receive immediate approval for their Global Fund applications had requested a cumulative total of $977 million over 5 years. In other words, Zambia had requested funds greater than the combined amount requested by the 26 countries with successful applications. While Zambia is a country that is severely affected by HIV and AIDS, their “wish list” approach to costing its Global Fund proposal concluded with a failure of the country to obtain any HIV and AIDS funds in Round 5.
In the case of South Africa’s 2007-2011 NSP, the estimated resource requirements from domestic and international sources were calculated to be R45 billion (approximately USD 4.6 billion) [35]. While this seems like a potentially unrealistic target, data from 2007 suggest the country is actually quite close to meeting their first resource generation target. In 2007, South Africa generated 96% of the NSPs resource requirements (R4.5 billion, up from R4.3 billion in 2006).
However, the resources required are calculated to rise from R4.7 billion in 2007 to R11.3 billion in 2011. South Africa’s NSP calls for a 36% increase in spending in 2008 and a 140% increase in spending
overall between 2007 and 2011. Thus South Africa will need to continue to make a substantial
increase in its effort to generate new resources and meet the resource generation targets that the plan defines. Is South Africa’s NSP a “wish list” or a ‘feasible plan?” Only time will tell for sure.
Allocating Scarce Resources
When most strategic plans are costed, there is little or no effort to assess what would happen if the levels of resources do not become available. A costed strategic plan should ideally consider alternative scenarios, aligning the priorities to assumptions about various levels of funding actually becoming available. A country, for example, might cost its strategic plan at $2 billion over 5 years, but then quickly realize that the level of funding for the program is unlikely to exceed $1 billion. Should the country cut all of its targets in half? Are there ways to reallocate funds to ensure that the targets
18
can still be achieved despite the limited funds? Which budgetary items are the most critical and therefore should be fully funded, as opposed to those items which are important but not critical? The Goals model is a key tool in HIV-related strategic planning, evaluation and proposal development. The Goals model is a resource allocation tool that has been used to answer the following types of questions:
• What resources are required to expand coverage of prevention, care, treatment and mitigation services to all those who need them?
• What goals can be achieved with the available resources?
• How can resources be allocated most efficiently to provide the greatest benefit?
• What is the gap between resources required and those available?
• What will be the impact of cuts in current levels of funding?
The Goals model allows users to test alternative patterns of resource allocation and observe how these decisions are likely to affect the overall achievement of specific targets. For example, countries can assess if spending more money on interventions with sex workers is likely to have a greater or lesser impact on the prevalence and incidence of HIV relative to interventions focused on youth.
Caveats
While models can improve the decision-making process, this does not guarantee that these models will accurately project the future course of the epidemic. One of the important lessons learned about HIV and AIDS generally is that there are many variables which affect the epidemic in a particular country. No model yet exists which has been proven to reliably capture these many exogenous variables.
Furthermore, models such as Goals rely heavily on published literature to calculate the impact of interventions. However, it is important to note that this may exaggerate the impact of interventions since the published literature is often biased towards interventions which are both successful and of high quality. As countries implement their own programs, they may expect an impact which is not subsequently achieved because the interventions were of lesser quality than those published in the literature.
Another challenge with Goals, as with all models, is that it can only be effectively used in policymaking with current data. This is particularly important because it has been observed that the HIV epidemic rapidly evolves. As shown in Figure 6, Brazil initially had an epidemic that was predominantly driven by injecting drug users. However, by 1992, the epidemic among IDUs had peaked. Today it is estimated that most new HIV infections are occurring among MSM and sex workers [36].
19
Figure 6: Source of New HIV Infections in Brazil
Thus if a country is responding to their epidemic using outdated epidemiologic information, they are likely to find that their resource allocation strategy is highly ineffective. Old data from Brazil, for example, would suggest that interventions should be focused on IDU, while more recent data would indicate that more resources should be spent on MSM.
While Section V will focus largely on the experience of countries in using the Goals model, it is worth noting that other resource allocation models exist and have been applied. These include the ABCE model, an optimization model which focuses on identifying the most cost-effective prevention interventions [37]. ABCE was developed by the World Bank and applied in a number of countries, including India, Honduras and Brazil.
The S4HARA model was developed for the purpose of expanding resource allocation decisions beyond simply factors of efficiency, but also tries to take into consideration non-quantifiable factors such as equity [38]. This model has been applied in a South African health clinic, with the result that the authors recommended an increased effort to promote condoms at this site.
20
Experience with One Resource Allocation Tool
The Goals model has been used to improve the resource allocation process in 17 countries since 2002, including 8 of the 15 PEPFAR countries. Of the 17 countries where the Goals model has been used, 12 are in Africa, 3 are in Asia and 2 are in Latin America.8 All 17 applications were conducted between
2002 and 2008, with two countries (Ethiopia and Kenya) utilizing the model twice.
The following section provides information on resource allocation exercises conducted in 8 countries between 2002 and 2008 (Uganda, Lesotho, Kenya, South Africa, Honduras, Namibia, Zambia, Ethiopia and the Ukraine). These 8 country examples were selected and discussed in this report because of their geographic diversity, as well as the illustrative “lessons learned” from these examples. The purpose of this review is to focus on the key experiences from countries which have tried to better allocate their HIV and AIDS resources.
Lesotho
In 2000, the government of Lesotho completed its 2001-2003 NSP, which was estimated to cost a total of USD 1 billion, or USD D 333 million per year [39]. While Lesotho has an extremely high prevalence of HIV (currently estimated to be 23%), the size of the population is relatively small (approximately 2 million). Thus many of the international donors viewed the costed strategic plan to be highly
unrealistic, particularly given that the levels of resources available in Lesotho were only USD 10 million per year at the time. The Goals model exercise in Lesotho was conducted in 2002, in large part
because the NSP was not successfully generating the required resources.
By using the Goals model, the costing of the NSP was revised [40]. Working with a team of local costing experts, it was possible to revise the budget downwards from USD 333 million annually to USD 100 million annually. This was achieved largely by reevaluating unrealistically large cost estimates for two interventions: STI treatment and the distribution of pamphlets.
A new priority setting team was then developed, and assigned responsibility for assuring that the budget was consistent with the NSP. The team identified interventions that could achieve their goals at a much lower cost. For example, the priority setting team noted that the budget for community mobilization was excessive and they were able to propose changes which would make this
intervention much less costly. By identifying those items which were most critical for Lesotho’s national response, it was possible to develop a new budget of approximately USD 40 million per year, or 12% of the original plan.
This new costed plan may have appeared to be less ambitious, but in reality it still represented a 4-fold increase in spending. As a result, Lesotho was able to use this information to successfully apply for additional donor funding. In 2003 Lesotho requested and received USD 29 million in additional HIV and AIDS funds from the Global Fund. In 2006, Lesotho received approval for an additional $40 million of HIV and AIDS funds and in 2008 Lesotho successfully requested another USD 33 million. The key lesson learned from this resource allocation exercise appears to be that developing more realistic, yet still ambitious, budgets is likely to produce more funds than developing a “wish list” approach to resource allocation. The Goals model was successful in getting policymakers from Lesotho to recognize that HIV and AIDS spending remains limited, and therefore a more prioritized resource allocation strategy was required. As a result, Lesotho was successful both in prioritizing and generating new resources.
8 Uganda, Lesotho, Kenya, South Africa, Ghana, Ethiopia, Namibia, Zambia, Mozambique, Rwanda, Malawi, Mali, Honduras,
21
Kenya
The Goals model was used in Kenya both in 2002 and in 2004 [41, 42]. The 2002 application was conducted as part of the country’s Joint AIDS Program Review. This exercise was unique because it provided the country with an analysis with recommendations both for generating new resources and reallocating current resources. Kenya’s NSP (2000-2005) indicated that the country hoped to reduce HIV prevalence by 20% to 30% among those 15 to 24 years old [43]. The country estimated that existing commitments from donors and the Kenyan government amounted to approximately USD 710 million over 5 years.
The modeling exercise revealed that Kenya’s HIV and AIDS response was succeeding at reducing HIV prevalence, but that the reductions were probably not going to reach the expected 20%-30% target by 2005. The modeling exercise did reveal that the target was still feasible if the country was able to both reallocate existing resources and obtain new funds. The allocation exercise indicated that interventions with sex workers, STI treatment, workplace interventions and voluntary counseling and testing were particularly cost-effective. Conversely, there was much less evidence that interventions such as community mobilization, outreach to out-of-school youth and mass media would have much of an impact in reaching Kenya’s targets.
In terms of the country’s treatment goals, the modeling exercise related the country’s treatment target for 2005 (60,000 people on ART) to the resources required (estimated to be between USD 64 and USD 76 million). By calculating more carefully the resource requirements, Kenyan policymakers were better prepared to assess their resource needs and to successfully seek out these resources.
The result of this exercise was that the country was able to submit a successful Global Fund
application which defined why additional resources were required both for prevention and treatment. Using data from the Goals model, the application was also able to more accurately define what could be achieved with the resources requested. A total of $107 million was approved in 2003 for Kenya from the Global Fund.
The resource allocation exercise was less successful at getting the country to reallocate its HIV and AIDS funds. In many ways, the country viewed the exercise as important for obtaining additional funds, but less important in terms of developing priorities and assuring that those priorities were actually achieved. Furthermore as new PEPFAR funds became available, Kenya appeared to be less concerned about issues of sustainability.
In 2004, the National AIDS Control Council began preparation of its new strategic plan for 2005-2010. A team working on resource allocation applied the Goals model to estimate the resources that would be required to fully scale-up prevention and treatment programs and the impact that could be expected if full scale-up were achieved. Significant efforts were put into collecting up-to-date unit costs for prevention and treatment programs implemented by the Government of Kenya and by other implementing organizations. The resulting goals formed part of the vision statement for the new strategic plan.
South Africa
The Goals model application in South Africa was conducted in 2003, half-way through the country’s 2000-2005 NSP [44]. The modeling exercise was pursued to assess if the country needed to make any modifications in the way resources were being spent [45].
The analysis did find a number of areas where additional funds should be spent, including
interventions with sex workers, MSM and IDU. The analysis also showed that funding for condoms was insufficient, and that the government should allocate additional resources to distribute additional condoms. The Goals model was also used to estimate the cost of a national PMTCT program;
22
confirming previous cost estimates for this intervention. Finally, the Goals model confirmed that the general provision of ART would be affordable for the government.
There were numerous positive outcomes based on these observations. For example, the government prioritized and allocated additional funds for sex worker interventions, condom distribution, PMTCT programs, and general ARV access. However, while the government agreed to research the needs of MSM and IDU in South Africa, they did not agree to additional funding to reach these populations. In other words, despite some evidence to the contrary, South Africa remained unwilling to address existing political barriers which limited their ability to work with sensitive subpopulations such as MSM.
Honduras
Honduras represents a unique application of the Goals model. In the 2004 Goals model application, an assessment of the country’s NSP (2003-2007) was performed; the model was used to evaluate the impact of a potential decision by the Global Fund to discontinue funding for the Honduran HIV and AIDS program [46]. This application was conducted because there were serious concerns that the Global Fund would discontinue funding in Honduras for its HIV and AIDS program.
The NSP indicated that Honduras required USD 25 million over the 5-year life of the plan [47]. There was general consensus that the resources budgeted in the country’s NSP were insufficient to achieve the goals established in the plan. Therefore various scenarios were evaluated for developing a more ambitious plan for addressing HIV and AIDS in Honduras.
An analysis of the resources required to fully cover all HIV and AIDS services and reach all vulnerable subpopulations indicated that USD 285 million would be required over the 5 years of the plan. This full coverage scenario was deemed unlikely to be feasible.
A third scenario was developed which would require that the Global Fund continue their funding of the Honduras program. In this scenario, Honduras would have access to USD 58 million over 5 years. This scenario was estimated to result in a 14% reduction in HIV prevalence and a 51% reduction in HIV incidence. The expected number of HIV infections averted was 22,000, at a cost of USD 1,100 per infection averted.
The analysis was effective at demonstrating to the Global Fund that their contribution to the HIV and AIDS response was critical and was likely to have significant benefits, especially in terms of infections averted. As a result of the analysis, along with various commitments from the Government of Honduras, the Global Fund decided to continue funding of the Honduran HIV and AIDS program.
Namibia
A Goals modeling exercise was conducted in Namibia, a year after the start of their NSP (2004-2009) [48, 49]. When Namibia launched its NSP, it lacked information about its existing HIV and AIDS expenditures, although the country was able to develop an estimate of its resource needs. By 2005, the country was able to calculate its resource availability at USD 79 million, an amount which was expected to rise to $130 million by 2007. The challenge for Namibia was that the NSP estimated that the resources required in 2007 were only $124 million. In other words, the data appeared to suggest that Namibia had access to higher levels of resources than were actually needed in 2007.
The exercise in Namibia was designed to: 1) assess if the NSP had accurately been costed and 2) to evaluate how additional resources might be allocated to achieve the greatest possible impact.
23
The modeling indicated that a more realistic costing of the country’s NSP would require
approximately $175 million to reach the desired coverage of services. It was determined that, relative to a scenario of constant funding from 2005 to 2009, HIV incidence would be reduced from 2.26% to 1.63%. The additional funding would result in more than 16,000 HIV infections averted. The proposed funding would further decrease HIV prevalence by a small amount (from 19.3% to 18.6%). The model calculated that ART coverage could be increased from 21% to 58%.
The exercise in Namibia confirmed what the government already suspected, which was that the NSP had been significantly undercosted. While the government of Namibia recognized that the Goals model could help to improve their costing, they did not choose to revise the costing of the NSP. Namibia is currently beginning to develop a new NSP, and have indicated a desire to conduct a new Goals model application which will improve the country’s ability to devise more tenable cost estimates. Policymakers also hope that more realistic cost estimates will assist the country in generating new resources for its NSP and achieving universal access for prevention and treatment services.
Zambia
In 2005, Zambia requested support in learning about and utilizing the Goals model [27]. As previously indicated (Section IV.A.), Zambia had earlier in the year submitted an unrealistically ambitious and unprioritized Global Fund application. However, at the time of the Goals application in 2005, Zambian policymakers could point to a number of important successes, including reductions in HIV prevalence, increases in condom use and growing access to free ART throughout the country. Furthermore, Zambia benefitted from a significant growth in the availability of resources from PEPFAR, the Global Fund and the World Bank.
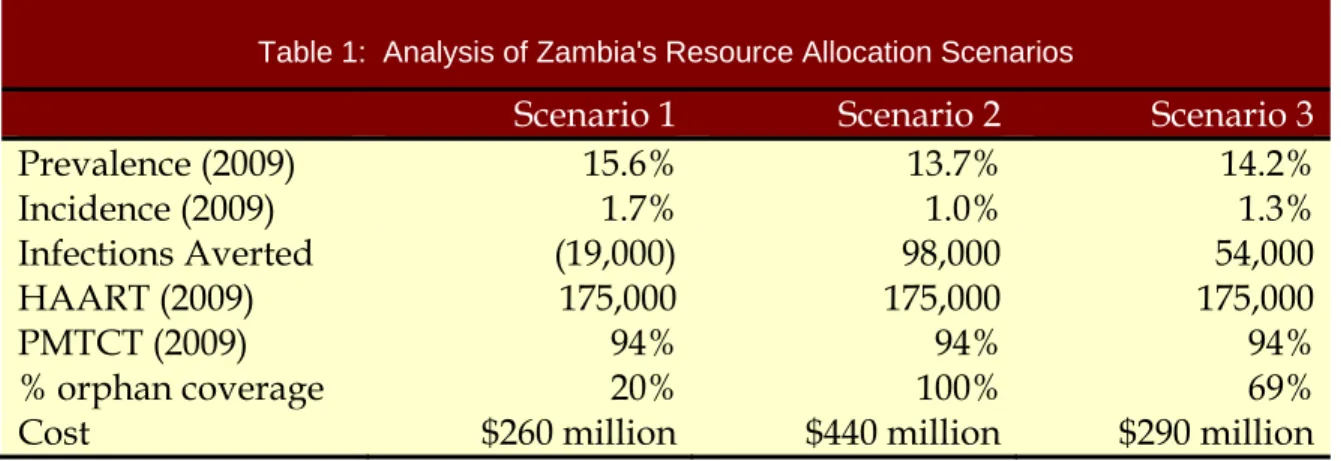
Zambia at the time of the Goals application was completing their HIV and AIDS strategic plan for 2002 to 2005 [50]. They were also in the process of designing their new strategic plan for 2006 to 2010 [51]. Three scenarios were developed for the Zambian government. Each of the results for the three
scenarios is show in Table 1. In the first, universal access would be achieved by 2009 for ARVs, PMTCT and blood screening, but there would be no additional spending on prevention programs. This first scenario would require that Zambia increase its annual HIV and AIDS expenditures from USD 100 million per year in 2004 to USD 260 million per year by 2009. Of this amount, the largest expenditures, by far, would be on the provision of ART (estimated to cost USD 190 million by 2009). This treatment-intensive scenario would result in HIV prevalence rising, from the projected prevalence of 13.3% in 2009 to 15.4%.9
The second scenario assumed universal access would be achieved for all prevention, care, treatment and mitigation interventions by 2009. This full coverage scenario resulted in only a slight increase in HIV prevalence (13.7% in 2009). However, this second scenario was estimated to cost much more than the first scenario (USD 440 million in 2009).
The third scenario assumed that the targets for the first scenario would be achieved, but an additional USD 30 million would be made available for OVC interventions and the most cost-effective HIV prevention interventions. This third scenario was projected to result in Zambia spending a total of USD 290 million in 2009, with prevalence rising to 14.2%.
9 HIV prevalence rises as ART scale-up occurs due to the increased life expectancy of those on treatment. However, this rise in
24
Table 1: Analysis of Zambia's Resource Allocation Scenarios
Scenario 1
Scenario 2
Scenario 3
Prevalence (2009)
15.6%
13.7%
14.2%
Incidence (2009)
1.7%
1.0%
1.3%
Infections Averted
(19,000)
98,000
54,000
HAART (2009)
175,000
175,000
175,000
PMTCT (2009)
94%
94%
94%
% orphan coverage
20%
100%
69%
Cost
$260 million
$440 million
$290 million
A review of these three scenarios indicates a number of important observations regarding the
allocation of HIV/AIDS resources in Zambia. Scenario 1 provides some indication regarding the cost of providing full coverage for the 3 identified services. While this scenario was likely to represent a significant achievement, it also suggests a concern because of rising levels of HIV prevalence. While Scenario 2 was likely to produce the best possible results, it remained unclear if this level of increased funding was likely to become available. Finally, Scenario 3 suggested that an allocation of resources which balances prevention, care and treatment and invests in those interventions that are likely to have the largest impact will probably produce extremely impressive results, without requiring the very high costs required of Scenario 2.
The exercise demonstrated to Zambian policymakers the importance of actually defining “universal access.” Scenario 2 defined “universal access” most comprehensively, but as Table 1 illustrates, it is also the most expensive of the three options. By focusing the available resources on the provision of ART (Scenario 1), high levels of ART coverage were achieved but both prevalence and incidence of HIV were shown to increase. Finally, by choosing an intermediate scenario (Scenario 3), it was possible to both achieve high levels of ART coverage and to avert 54,000 HIV infections.
While Zambia did not adopt all the conclusions from the Goals report, Zambia’s national strategic plan did indicate that USD 255 million would be required in 2009, an amount very similar to that calculated in Scenario 1. Furthermore, the strategic plan noted that the “Availability of ART will decrease the mortality rate and, therefore, in the short to medium term prevalence could in fact increase as ART becomes more readily available.” A similar conclusion was made from the Goals model exercise, with all three scenarios resulting in a projected increase in the prevalence of HIV.
Ethiopia
The Goals model in Ethiopia was first applied in 2006, sixteen months after the country had launched its 2004-2008 NSP10.[52, 53] While specific data on HIV and AIDS spending in Ethiopia were not
available, it was estimated that Ethiopia spent approximately USD 110 million on HIV and AIDS interventions in 2005.11 This level of funding represents a substantial effort on the part of the
Ethiopian government and international donors. However, this funding was only enough to achieve relatively low levels of coverage for most HIV and AIDS services.
The country’s 2004-2008 NSP indicated that approximately USD 170 million per year is required to achieve the desired targets. This would represent an increase of more than 50% from the estimated
10 The Goals model is currently being updated for use with the upcoming 2009-2013 National Strategic Plan. 11 Exchange rate ETB8.77 = USD 1; March 1, 2006.
25
2005 level of resources. However, the Goals model calculations suggest that this increase in funding would still not be sufficient to achieve universal access.
The Goals model exercise in Ethiopia indicated that universal access12 could be achieved in 2010 with
an 8-fold increase in spending, reaching USD 1 billion per year by 2010. However, a review of the country’s capacity constraints, as well as access to donor resources, suggested that this type of rapid growth was unlikely to be achieved in such a short period of time.
Another scenario reviewed involved prioritizing interventions in the costed strategic plan (to achieve greater coverage in certain areas) and also striving for higher levels of funds. In this scenario, Ethiopia would need to generate USD 300 million in 2010, triple the level of 2005 funding but less than a third of the resources required for full coverage. The result would be to decrease prevalence (from 5.3% to 5.1%) and incidence (0.78% to 0.60%) and provide ART coverage to 230,000 people infected with HIV. Of all the scenarios, this seemed to be the one which created the best combination of feasibility and ambition.
It should be noted that Ethiopia’s first Goals model application utilized the epidemiologic data and prevalence trends that were available in March 2006. The Goals model concluded that without
additional behavior change, prevalence would rise from 4.7% in 2005 to 6.5% in 2010. However, when the 2005 Demographic and Health Survey (DHS) and Antenatal Surveillance (ANC) data became available later in 2006, it revealed that prevalence among 15-49 year olds was between 1.4% (DHS) and 3.5% (ANC), both of which were well below the estimates used in the Goals report.13 Thus in 2008,
the calculations are being revised and will be used as an input into Ethiopia’s next NSP.
There are a number of important lessons learned from this exercise. First, it appears that the 2004-2008 NSP was not ambitious enough, despite a projected 50% increase in the calculation of resources needed. On the other hand, the resources needed to ensure universal access of services in Ethiopia ($1 billion in 2010) were determined to be infeasible given capacity constraints and an unrealistically large increase in donor funding. Thus by conducting a Goals modeling exercise, it was possible to develop a scenario that would achieve ambitious levels of coverage while still targeting resource levels that were likely to be achievable.
Another lesson learned from the Ethiopia exercise involved the importance of having accurate epidemiologic data. As noted above, the Goals model was conducted at a time when it was
determined, based on ANC data, that HIV prevalence was nearly 5%. Subsequent data obtained from the country’s 2005 DHS and ANC data suggest that prevalence was actually closer to 2%. This will clearly have implications on the resource estimates for achieving universal (or near universal) access.
Uganda
In 2006 the Uganda AIDS Commission (UAC) began to prepare its new HIV/AIDS Strategic Plan for the years 2007/8 – 2011/12 [54]. The work began with a review of the accomplishments and failures of the previous plan, collection of up-to-date data and a situation analysis. The costing and resource
allocation work started early in the process with an assessment of current spending and estimates of future resource requirements. The assessment of current spending found that resources allocated for HIV and AIDS programs had increased from $39 million in 2003/4 to $170 million in 2006/7. The team working on resource allocation held discussions with donors and the UAC to estimate the likely future trend in resource availability. The team developed several future funding scenarios based on a detailed analysis of donor plans and government budgets. Based on increased funding from PEPFAR,
12 In this case universal access was defined as 80% coverage for all services.
13 Following an extensive analysis of the DHS and the ANC data, Ethiopia agreed on a single point estimate of 2.1%, less than
26
Global Fund and domestic sources, resources available were projected to increase to $350-$500 million per year by the end of the plan.
The team used the Goals model to estimate the future funding required to scale-up coverage of all key prevention, treatment and mitigation interventions to reach full coverage by the end of the plan [55]. They estimated that about $620 million would be needed in 2011/12. Thus the gap between
resources needed and resources expected to be available was $120-$270 million in 2011/12. Since it was clear that funds would not be available to scale-up all interventions, decisions needed to be made on what was most important to fully fund and what would have to be only partially funded.
The resource allocation team used the Goals model to estimate the impact of different allocation scenarios. Impact was measured by several indicators including two for prevention (the number of new infections, the reduction in annual incidence), two for treatment (ART coverage and the number of AIDS deaths) and one for mitigation (coverage of support services for orphans and vulnerable children). Several different allocation schemes were analyzed including:
• Prevention first – fully fund all prevention programs, allocate the remaining funds to treatment and mitigation
• Cost-effective prevention first – fully fund the most cost-effective prevention interventions, keep other prevention constant, allocate the remaining funds to treatment and mitigation
• Treatment first – achieve universal access to treatment, allocate the remaining funds to prevention and mitigation
• Mitigation first – increase funding for OVC programs by 6-fold, allocate the remaining resource to prevention and treatment.
Allocation scenarios that prioritized prevention averted many new infections but did not have as much impact on reducing deaths or mitigating the effects on children. Allocating funding to
treatment first averted the most deaths and achieved high ART coverage but did not prevent as many new infections.
This information was presented in meetings with the UAC, civil society, donors, government
departments, and parliamentary committees. At these meetings participants discussed the benefits of each allocation strategy and voiced their opinions about priorities for the new plan. This had
happened before but what was different this time was that these discussions were informed by data on the impact of their decisions. After much discussion it was decided to give top priority to fully funding the most cost-effective prevention strategies.
Ukraine
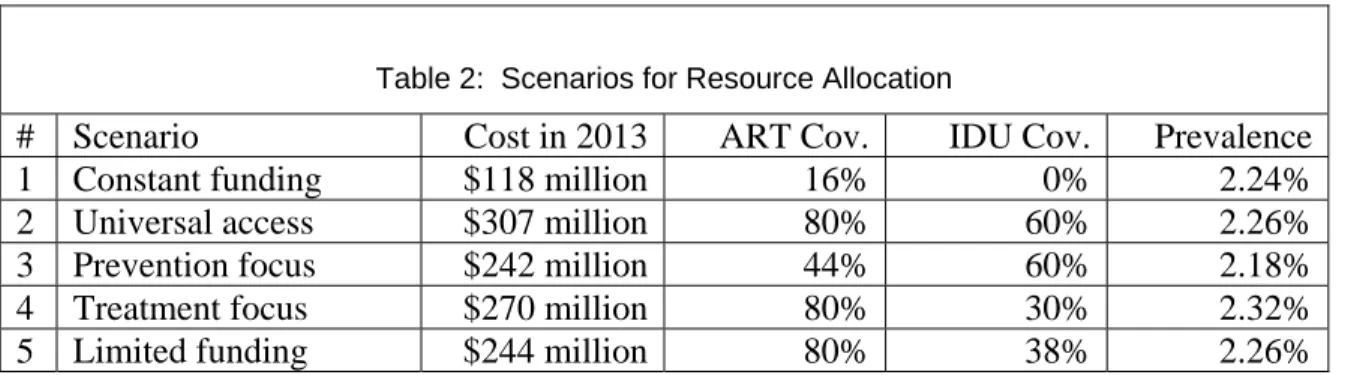
Ukraine has the most severe epidemic in all of Europe, with a prevalence estimated to be 1.63%.[56] Estimates indicate that a third of male mortality and more than half of female mortality among those between the ages of 15 and 49 in Ukraine will be attributable to AIDS within the next five years. Ukraine is preparing for their next HIV and AIDS strategic plan, which will run from 2009 to 2013. As part of that preparation, a team applied the Goals model to evaluate a number of different scenarios. These scenarios include:
1) Constant expenditures: Funding remains constant from 2008 to 2013 2) Universal access: Funding increases to achieve universal access
3) Prevention focus: Universal access is achieved for prevention; treatment spending increases by 50%
27
4) Treatment focus: Universal access is achieved for treatment; prevention spending increases by 50%
5) Limited funding: Budget based on the commitment of the Ministry of Finance and the Global Fund
Each of these five scenarios was evaluated in terms of cost, impact on incidence and prevalence, and levels of coverage for care and treatment services. The results are shown in Table 2. Scenario 1 is shown to be the least expensive, but also achieves the lowest level of coverage for ART and for prevention coverage (IDU drug substitution coverage is used as an indicator of prevention success). Scenario 2 is likely to have the greatest impact in terms of both ART and prevention coverage, but this scenario is the most expensive. Scenario 3 is likely to have the greatest impact on HIV prevalence, but it only achieves 44% coverage for ART. Scenario 4 achieves high level of treatment coverage, but results in the highest prevalence of HIV. Finally, scenario 5 also achieves high levels of treatment coverage, but only reaches 38% of IDUs with drug substitution programs.
Table 2: Scenarios for Resource Allocation
# Scenario
Cost in 2013
ART Cov.
IDU Cov.
Prevalence
1 Constant
funding
$118
million
16%
0%
2.24%
2 Universal
access
$307
million
80%
60%
2.26%
3 Prevention
focus
$242
million
44%
60%
2.18%
4 Treatment
focus
$270
million
80%
30%
2.32%
5 Limited
funding
$244
million
80%
38%
2.26%
The result of the exercise was to provide Ukrainian policymakers with different scenarios which relate resources to the achievement of different targets. While the Ministry of Finance had originally proposed that the country pursue Scenario 5, there was a recognition following the exercise that the level of funding was insufficient to achieve the country’s goals. As a result, the Ministry of Finance in Ukraine agreed to higher levels of government funding. In addition, the Ministry of Health of Ukraine agreed to conduct further negotiations with ARV manufacturers, with the intent of lowering the price of ARVs in the country.
28
The Future of Resource Allocation
This final section discusses the possible future of resource allocation in the field of HIV and AIDS, including improvements in existing resource allocation tools, the improved willingness of countries to link priorities and resources, the barriers that lie ahead for improving the resource allocation process, and some key actions that could be pursued in the next few years to overcome those barriers.
How Can Resource Allocation be Made Better?
There are various ways in which countries can be encouraged to think beyond their current paradigm regarding HIV and AIDS resource allocation. Perhaps the first step in allocating resources effectively is to ensure that policymakers truly understand their own epidemic. In other words, it is critical to assess not only where HIV infections have occurred (in terms of vulnerable subpopulations, regional
variations, etc.), but also to understand where the next infections are likely to occur. Countries need to move beyond the oversimplified conclusion that “everyone is at risk”, and instead truly understand whether certain subpopulations are at greater risk than others. UNAIDS has been supporting a series of regional activities known as “Know Your Epidemic, Know Your Response” in which country teams assemble information on the status of the epidemic and their national program. The Modes of Transmission model is applied to estimate the sources of new infection. The results from this modeling are compared to the current allocation of efforts to determine how the response might be improved.
Next, countries need to have a clear grasp on the costs of different interventions. In the earlier years of the epidemic, it may have been acceptable that countries lacked information about a reasonable range of unit costs for a set of prevention and treatment interventions. However, at this stage of the epidemic, it is totally unacceptable that countries cannot provide even a reasonable range of unit costs for particular interventions. Where unit cost data are not available, it should be a high priority to collect such information. Most organizations implementing interventions know their own costs, since they need to prepare budgets to request support from funding agencies. This information needs to be compiled systematically and used to estimate resource requirements. This is important not only for the purpose of allocating resources, but also for identifying potential inefficiencies in scaled-up
programs.
A key way to improve their resource allocation process is to integrate resource allocation into each country’s entire planning process. Most countries assess their resource needs as a final step in the planning process, rather than throughout the overall planning process. This is not to suggest that the planning process should be limited by some arbitrary financial limits. However, countries should be encouraged to consider throughout the planning process a set of different scenarios based on assumptions about what level of resources may be realistically available.
Epidemiologists in the field of HIV and AIDS have implored countries to “know where the next 100 HIV infection