Presentation of Foods in Children’s Animated Television Programming
By Shelly Najjar
Spring 2010
Advisor: Dr. Erica Austin
Consortium for the Study of Communication & Decision Making Edward R. Murrow College of Communication
Précis
Currently, more than 12% of children are overweight, putting them at risk for health problems like high cholesterol, high blood pressure, asthma, and Type II diabetes.Although research has shown that children’s eating habits and food choices are influenced by what they see on television, little data exist on how foods are presented within children’s programs.
This honors thesis presents a content analysis of 20 animated programs most popular with children ages 2-11 years, to provide data about the food presentations to which the average child would be exposed while viewing the programming itself. Foods are categorized into the
following groups: Grains, Fruits, Vegetables, Meats and Beans, Milk, and Extras. The following hypotheses are tested:
Grains and Extras are given more time, are more often excessively consumed, and are more valued and less criticized than the other groups.
Consequences for consuming Fruits, Vegetables, Meats and Beans, and Milk are more often positive and those for Grains and Extras are more often negative.
In addition, it was hypothesized that most of the food references are visual rather than verbal.
The study found that Grains and Extras were given more time per episode, were more valued, and were more frequently excessively consumed than the other groups. Contrary to hypothesized results, Grains and Extras were more criticized than Fruits and Vegetables, but not more than Meats and Beans and Milk. There were more negative consequences of consumption of Grains and Extras than the other groups. Unlike hypothesized results, there were no positive consequences of consumption shown in any of the viewed sample. There was a greater
percentage of episodes containing visual references than episodes with verbal references, but contrary to hypothesized results, this was not statistically significant.
It is also interesting to note that for four out of the five total measures, there was no statistically significant difference in the presentation of the Fruits and Vegetables group and the Meats and Beans and Milk group. It was found, however, that Meats and Beans and Milk were more criticized than Fruits and Vegetables.
Based on the MyPyramid.gov recommendations, each of the combined groups used for analysis in this study should consist of about a third of the diet. However, this study found that the time given to Grains and Extras represented more than a third of the total time given to food references, while both the Fruits and Vegetables group and the Meats and Beans and Milk group were represented significantly less than a third of the total food time.
For future studies, it would be interesting to test whether frequency or duration of food reference matters (for example, if a 30 second reference all at once is perceived differently from five six second references). Also, a study on whether certain types of references (visual, visual written, verbal, or in combinations) have a stronger effect than others is recommended.
In this study, observations were made regarding the presentation of physical activity, and it was found that 13.04% of the episodes viewed contained physical activity references. A follow-up study could test whether the inclusion of physical activity in programming influences the overall effect of the food references on the children viewing them.
The results of this study could imply that children are taught through animated
programming to value the high-fat, high-sugar foods the programs over-represent, contributing to the nutritionally unbalanced eating habits of children in the US. These results imply that nutrition education for children is especially important.
Table of Contents
Introduction/Literature Review....………1
Research Hypothesis ... ………5
Methodology .... ………6
Analysis . ………10
Results and Discussion .. ………13
Conclusion . ………20
References Cited ………22
List of Tables
Table 1……….11 Table 2……….12
Presentation of Foods in Children’s Animated Television Programming Introduction/Literature Review
For adults, “overweight” means having excess weight for height, or a Body Mass Index (BMI) value of 25-29.9, and “obesity” is having excess adipose (fat) tissue, or a BMI value of 30 or greater. For comparison, a healthy BMI value is generally accepted to be between 18.5 and 24.9. It is estimated that more than one billion adults are overweight worldwide, and more than a third of that group is classified as obese (World Health Organization [WHO] 2009).
What may be even more serious is the fact that the proportion of children in the United States who are overweight is also high. For children, excess weight for height is labeled “at risk for overweight” if the BMI is between the 85th
and 95th percentiles on the Centers for Disease Control (CDC) growth charts, and “overweight” if the BMI is at or above the 95th percentile. Childhood overweight has risen over the last thirty years, and currently 12.4% of children 2-5 years of age and 17% of children 6-11 years of age are classified as overweight (CDC 2009). Although there are some signs that childhood overweight may have stopped increasing, it is far from ceasing to be a problem. Childhood overweight is significant because, compared to their healthier peers, children who are overweight are at increased risk for high cholesterol, high blood pressure, asthma, and Type II diabetes; and may have greater chances of developing Type II diabetes, cardiovascular disease, cancer, liver and gallbladder disease, respiratory problems, and osteoarthritis during their adult years (CDC 2009).
Overweight and obesity are caused by excess caloric intake paired with insufficient caloric expenditure. Some factors thought to contribute to the rise of childhood overweight are consumption of large portion sizes, meals away from home, sugar-sweetened drinks, and low-nutrient, energy-dense snacks; lack of physical activity; and time spent with media like television
(CDC 2009). The amount of television viewed has generally been considered to contribute to overweight due to two factors: the food advertisements that increase awareness and desirability of low-nutrient foods and restaurants selling them (CDC 2009) and the amount and types of foods consumed during viewing (Wiecha, et al. 2006; CDC 2009). Only a few studies (Korr 2008; Radnitz, et al. 2009) have been done to look at the content of children’s programs on television.
Other studies have shown that children’s eating habits and food choices are influenced by what they see on television (Tapper, Horne, & Lowe 2003; Wiecha, et al. 2006). This is
important because the average child watches three hours of television per day (Strasburger, Wilson, & Jordan 2009), and thus has the chance to view many food references through the programming and advertisments. As the amount of television children watch increases, their consumption of calories and of the foods found in advertisements increases (Wiecha, et al. 2006). This has significant health effects, since the foods found in advertisements are mostly candy, snacks, cereal, and fast food (Gantz 2007).
Advertisements may not be alone in influencing children’s eating behavior. Television programs themselves contain many references to food (Kaufman 1980; Story & Faulkner 1990; Korr 2008; Murphy, Hether, & Rideout 2008; Radnitz, et al. 2009). The previous content
analyses of children’s programming have shown that “unhealthy” (low-nutrient) foods are shown more often during the programs than “healthy” (high-nutrient) foods (Korr 2008; Radnitz, et al. 2009). Sometimes when children see things on television they imitate them (Friedrich & Stein 1973), so if they are seeing “unhealthy” foods in a positive light, they may learn to eat those foods. This issue is important because it has been shown that cartoon characters promoting certain fruits and vegetables increase children’s consumption of those foods (Tapper, Horne, &
Lowe 2003). In addition, it was shown that the increased consumption applied to any food the children were able to identify as a fruit or vegetable, not just those specified in the study (Tapper, Horne, & Lowe 2003).
Getting children to eat more fruits and vegetables is a concern of health care workers because currently, children eat 1 ½ cups of fruit and only about 1 cup of vegetables each day (Krebs-Smith, et al. 2008), which is an acceptable amount for fruit but less than the 2 ½ cups of vegetables recommended for children (http://mypyramid.gov). Fruits and vegetables are an essential part of a balanced diet, and may help prevent obesity and many of the health problems associated with it, such as Type II diabetes, stroke, high cholesterol, hypertension, and coronary heart disease (http://mypyramid.gov).
In 1992, the US Department of Agriculture (USDA) designed the Food Pyramid to educate people about nutrition and to help them choose healthy foods in adequate amounts. In 2005, the USDA released a new program called MyPyramid.gov, which includes a new pyramid graphic, a corresponding website, and programs to keep track of goals for food and physical activity. The change more simply reflects the most recent scientific research, emphasizes physical activity, and allows interaction and customization (http://mypyramid.gov).
The website categorizes foods into various groups. These groups are named Grains, Fruits, Vegetables, Meats and Beans, Milk, Oils, and Discretionary Calories. All of the groups are important to a balanced diet. The problem is that most people, including children, do not consume a balanced diet (http://mypyramid.gov). The 2005 Dietary Guidelines (put out by the USDA and US Department of Health and Human Services [HHS]) say “many Americans need to consume fewer calories, be more active, and make wiser choices within and among food
If television programs showed more of these wiser choices of food or presented them in more appealing ways, perhaps more children would learn to increase their intake of these foods. A part of the way programs present foods as desirable or not depends on how much time is given to the foods, how much the characters value and excessively consume them, and what the
consequences of consumption are. Unfortunately, previous studies of programming have shown that more time is given to grains and foods that the researchers classified as “unhealthy” than foods they considered “healthy,” like dairy products or fruits and vegetables (Kaufman 1980; Story & Faulkner 1990; Korr 2008). Program characters value and excessively consume these “healthier” foods less often than the “unhealthy” foods (Kaufman 1980; Radnitz, et al. 2009). On the other hand, “healthy” foods have fewer adverse consequences of consumption than the “unhealthy” foods (Radnitz, et al 2009). Still, this may not be enough to counter the overall negative presentation of the food.
It is important to keep in mind the idea that children might be learning about food from the television programs they watch. The programs are full of verbal and visual stimuli that children sort through when determining what is important (Strasburger, Wilson, & Jordan 2009). Verbal and visual information are processed by the brain at different rates (Kim, Seitz, & Shams 2006), so the amount of each type of reference is important to keep track of as well. Visual references were more frequent than verbal references in one study (Story & Faulkner 1990), and perhaps it can be hypothesized that the results in this study will be similar, since it is easier to draw food in the background of a scene than writing a verbal reference into the script, since the food in the background does not have to add to the plot.
The previous studies, while they provided valuable information about the amount of food within television programming, had subjective methods of categorizing foods by “healthy” or
“unhealthy” or by categories corresponding to meals (“breakfast foods”). This study attempts to correct that by using an objective classification that corresponds to the USDA’s dietary
recommendations. Children’s programming already attempts to teach many things, and in fact, many parents admit they allow their children to watch television because it is “like a babysitter” and is “educational” (Hersey 2007). The question is then, what are they being taught regarding food?
Research Hypothesis
It was hypothesized that there is a difference in the way food groups are presented in children’s animated television programs, as seen by the following:
More time is given to food references for Grains and Extras (Oils and Discretionary Calories) than Fruits, Vegetables, Meats and Beans, and Milk.
Grains and Extras are more frequently excessively consumed than Fruits, Vegetables, Meats and Beans, and Milk.
Grains and Extras are more valued than Fruits, Vegetables, Meats and Beans, and Milk.
Fruits, Vegetables, Meats and Beans, and Milk are more criticized than Grains and Extras.
Grains and Extras have more negative consequences of consumption than Fruits, Vegetables, Meats and Beans, and Milk have.
In addition, it was hypothesized that a greater number of episodes contain visual rather than verbal references.
Methodology
The methodology for this study was based on that from previous content analyses of children’s television programming (Korr 2008; Radnitz, et al. 2009) and prime-time television programming (Kaufman 1980; Story & Faulkner 1990; Murphy, Hether, & Rideout 2008).
For this study, the television programs that were considered were the top ten most popular broadcast and cable programs (20 programs total) among children 2-11 years of age during the first quarter of 2009, as reported by The Nielsen Company (2009). Animation was decided at the beginning of the study to include two- and three-dimensional hand drawings, computer-generated imagery, and digital puppetry, but was mainly decided by whether the network airing the program considered it to be animated. The ratings did include some mostly-animated programs that contained live-action segments, such as Spongebob Squarepants and Mighty B!, but since their network (Nick) considers them animated programs, they were considered in this study. Programs were selected, recorded, and then viewed and analyzed. Results from two independent coders collecting data on a random 10% subset of the
programming sample were also used to check for reliability.
The Nielsen ratings were used to provide data about the food presentations to which the average child in that age range would be exposed. The individual episodes were selected by recording the selected programs whenever they aired, until three 30-minute segments (time includes commercials) containing different episodes of each program were recorded. All segments were recorded between June 1, 2009 and December 22, 2009. The total sample included 30 hours (time includes commercials) of programming, which is less than some studies that have multiple researchers (Murphy, Hether, & Rideout 2008 [723 hours]; Radnitz, et al. 2009 [136 hours]), but more than the Korr study with one researcher (2008 [16 hours]).
Only episodes with original USA airdates during 2007-2009 were considered, with the exceptions of a few programs in the Nielsen ratings that are still being aired as repeats but whose creators stopped writing new episodes before 2007. The programs in this exception were
Powerpuff Girls (ended 2005), Sonic X (ended 2006), and What’s New? Scooby-Doo (ended 2006). The three-year restriction on the airdates was to best simulate the episodes viewed 1) by children who are currently in the 2-11 year old age range, and 2) during the first quarter in 2009 when these programs were most popular.
Television channels were delivered by the Comcast Digital Silver Package in the King County area of Washington State in the USA. Since programs are often aired on multiple networks, the following criteria were used to determine the network that was used to record the programs in this study:
If an episode that met the 2007-2009 original airdate requirement could be found, the network that was listed on the Nielsen ratings was used with first priority. If it was not available on that network during the time that the programs were
recorded, the next step was to record the program on a different network.
o If the program was originally aired on a broadcast network, other broadcast network channels (limited cable channels) were checked first, but if the program was not available on any other broadcast network, expanded cable channels were used.
o If the program was originally aired on a cable network, other expanded cable channels were checked first, but if the program was not available on the expanded cable channels (or was a program originally aired on a
broadcast network that could not be found on limited or expanded cable channels), digital preferred channels were used.
o If the program could not be found on digital preferred channels, On Demand options were used.
o If the program could not be found in the On Demand options, DVDs of the series were used.
o If the program could not be found on DVDs, it was viewed online at the original network’s website.
Data collected included the details of the episode (program title, episode title, date and time aired, new/repeat, network, and length in minutes). Additional data (details follow below) included: type of reference, the type of food being referenced, the duration of the food reference (in seconds), excess consumption, valuing, and consequences (positive and negative).
The type of reference was defined as a visual display or verbal mention. For visual food references, each food item was recorded when it appeared on screen, along with the time (in seconds) during which it was visible. For verbal food references, each food item was recorded every time it was said, along with the time it took for the character to say it. Visual displays included two subgroups: food shown and not eaten by a character and food eaten by a character. Visual display references (not eaten) could be written displays. Written visual displays were food words that appeared in a scene. On the viewing rubric, these references were specified as written, and the food word was recorded as well as the duration (in seconds) for which it was visible. Food was defined as something the main characters would eat or drink that is generally considered to be or is similar to human food. Food in food contexts, food given to
non-speaking pets, and foods drawn as unidentifiable colored blobs were not counted on the viewing rubric, but informal observations about them were recorded in a separate journal.
Excess consumption and valuing were defined as in the Radnitz, et al. study as “a character eating a large amount of food in a short amount of time” (excess consumption) and “a character expressing excitement about the food over and above simply eating it” (valuing) (Radnitz, et al. 2009, p 231). The opposite of valuing was criticism, which was defined as “a character expressing disappointment in or dislike of the food.” Valuing and criticism were recorded on a 1 to 5 scale with the values of 1 and 2 corresponding with criticism and the values of 4 and 5 corresponding with valuing (1 = enthusiastic criticism, 2 = moderate criticism, 3 = no criticism or valuing, 4 = moderate valuing, 5 = enthusiastic valuing). Consequences were recorded on a 1 to 5 scale with the values of 1 and 2 corresponding with negative consequences and the values of 4 and 5 corresponding with positive consequences of consuming the food item (1 = severe negative consequences, 2 = minor negative consequences, 3 = no consequences, 4 = minor positive consequences, 5 = severe positive consequences).
All programs were viewed with viewers that had a playback counter that listed hours, minutes, and seconds. To facilitate observations, multiple speed playback was utilized. A viewing rubric (Appendix A) was used to record viewing data. If there was a difficulty recording the food references in the viewing rubric format, an alternate format was used. This format was a supplemental lined paper that listed on the left side of the page the number shown in the playback counter, while listing on the right all the food shown in each second. For example, if a carrot was shown for three seconds (from 01:24:12 to 01:24:14) and a slice of pepperoni pizza for two seconds, (from 01:24:12 to 01:24:13) the alternate format would show the following:
01:24:12 carrot, pepperoni pizza slice 01:24:13 carrot, pepperoni pizza slice 01:24:14 carrot
Information about valuing was written at the top of the supplemental page. In the cases where the alternative format was used, there was no criticism, consequences, or excessive consumption to record, and the level of valuing was the same for all the foods in that time period.
Program intros and main theme songs were viewed separately and information on them was recorded in the observation journal rather than with the episode information in the viewing rubric, since many programs had multiple episodes per 30-minute segment, and the main intro was only shown once during that time. Intros and theme songs were not evaluated as part of this study. Commercials included in the 30-minute segments were not viewed or counted in the duration of the episodes. Reasons for the ratings for criticism/valuing and consequences were recorded in the Observations section on the viewing rubric.
In addition, general mentions of generic meals (breakfast, lunch, dinner, and snack) and things like, “Let’s go get something to eat,” or mentions of hunger or thirst were recorded in the observation journal but were not recorded as a specific food reference. Exercise and physical activity depicted in the programs were also observed and recorded briefly in the journal. Fight scenes were not considered as physical activity, but training sequences were.
Analysis
Foods were categorized into the MyPyramid food groups based on information from MyFood-a-pedia (http:// myfoodapedia.gov). The categories were Grains, Extras, Fruits, Vegetables, Meats and Beans, and Milk. Combination foods, like pizza, were categorized in
every group to which they belonged, according to the results of MyFood-a-pedia. During the analysis, Grains and Extras were combined into one category, Fruits and Vegetables into another, and Meats and Beans and Milk into a third.
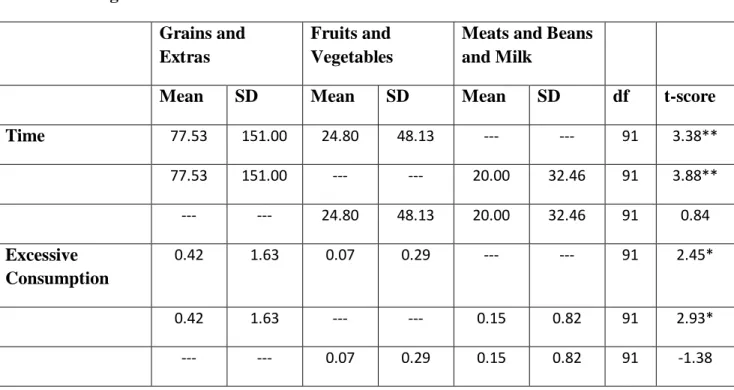
The time (sec) given to each variable was added together by episode, and a paired two-mean t-test was performed. The number of instances of excessive consumption was summed per episode for each variable, and a paired t-test was used (Table 1). For the valuing score, the number of episodes that contained valuing was calculated for each category, and then a z-test was used. The same procedure was also used for the criticism and consequences scores (Table 2). The number of episodes that contained a visual reference was determined and the number of episodes that contained a verbal reference was determined, and a z-test was used to compare them. The total number of episodes viewed was 92.
Table 1: *p<0.01;**p<0.001 Means and Significance Tests
Grains and Extras
Fruits and Vegetables
Meats and Beans and Milk
Mean SD Mean SD Mean SD df t-score
Time 77.53 151.00 24.80 48.13 --- --- 91 3.38** 77.53 151.00 --- --- 20.00 32.46 91 3.88** --- --- 24.80 48.13 20.00 32.46 91 0.84 Excessive Consumption 0.42 1.63 0.07 0.29 --- --- 91 2.45* 0.42 1.63 --- --- 0.15 0.82 91 2.93* --- --- 0.07 0.29 0.15 0.82 91 -1.38
Z-tests (rather than t-tests) were used for the measures of valuing, criticism, and consequences because the proportions of episodes that contained valuing, criticism, and consequences were not affected by the way in which the data was recorded, while the actual scores were. While viewing the programs, the references were recorded on the viewing rubric (Appendix A), and if a reference had the same values for all measures as one previously recorded for that episode, the duration of the reference was just added to the first one recorded. For example, a cheeseburger was shown first for 4 seconds and then for 3 seconds, both times with no valuing, a criticism score of 2, and no consequences; the two instances were combined, with the end result being one reference that lasted for 7 seconds. This affects the averages of the measures, so to minimize this and allow for more consistent comparisons, the proportions of the episodes were used.
Proportion of Total Episodes (n=92) and Significance Tests Grains and Extras Fruits and Vegetables Meats and Beans and Milk z-score Valuing 0.3696 0.2065 --- 3.86** 0.3696 --- 0.2500 2.65* --- 0.2065 0.2500 1.03 Criticism 0.1739 0.0326 --- 7.63** 0.1739 --- 0.1413 0.90 --- 0.0326 0.1413 5.87** Consequences 0.1413 0.0326 --- 5.87** 0.1413 --- 0.0543 3.68** --- 0.0326 0.0543 1.17
Two coders independently collected data on the same random 10% subset of the original viewed sample, and intercoder reliability was calculated using the formula below (Korr 2008):
(Number of agreements × 100) / (Number of agreements + number of disagreements) Intercoder reliability among all three recorders was 52.53%. With the exclusion of one of the coders who was not consistent in following the methodology outlined in this study, reliability was 74.80%. There were 11 instances where coders differed by 1 second in the number recorded for the measure of time. If these are included in the number of agreements, reliability increases to 76.95%. This difference could have been caused by each coder using a different playback instrument to view the programs.
Results and Discussion
The analysis found, with strong significance (p<0.001, Table 1), that Grains and Extras were given more time per episode than Fruits, Vegetables, Meats and Beans, or Milk. It was found that Grains and Extras were more frequently excessively consumed than the other groups (p<0.01, Table 1). Grains and Extras were more valued than the other groups (p<0.0001 [vs. Fruits and Vegetables] and p<0.001 [vs. Meats and Beans and Milk], Table 2). Contrary to hypothesized results, Grains and Extras were more criticized than Fruits and Vegetables (p<0.0001, Table 2), but not more than Meats and Beans and Milk (p=0.46, Table 2). There were more negative consequences of consumption of Grains and Extras than the other groups (p<0.0001, Table 2). Unlike hypothesized results, there were no positive consequences of consumption shown in any of the viewed sample. There was a greater percentage of episodes containing visual references (78.26%) than episodes with verbal references (71.74%), but contrary to hypothesized results, this was not significant (z=1.39, p=0.08).
It is also interesting to note that for four out of the five total measures, there was no statistically significant difference in the presentation of the Fruits and Vegetables group and the Meats and Beans and Milk group. It was found, however, that Meats and Beans and Milk were more criticized than Fruits and Vegetables (p<0.0001, Table 2).
Most of the results found in this study fit with the results of previous content analyses of children’s television programs (Korr 2008; Radnitz, et al. 2009) and prime-time television programs (Kaufman 1980; Story & Faulkner 1990; Murphy, Hether, & Rideout 2008). While there is some limitation on the comparison with research due to the way the food in this study is categorized differently from previous studies, similarities can be noticed. In the Korr study (2008), 32.5% of the total food references were for Breads and Cereals and Sweets, compared to 21.6% for Fruits and Vegetables, and 22.0% for Meats and Dairy Products. There were also categories of Salty Snacks and Low-Nutrient Beverages (representing 16.1% combined). Breads and Cereals, Sweets, Salty Snacks, and Low-Nutrient Beverages (groups that roughly correspond to Grains and Extras in my study) accounted for 48.6% of the food references in that study, which was more than the Fruits and Vegetables and Meats and Dairy Products categories, but less extreme than the Grains and Extras value in this study (68.38%). The Radnitz, et al. study (2009) found “unhealthy” foods were more often excessively consumed than “healthy” foods (36 instances compared to 4), were more valued (169 instances compared to 65), and had fewer adverse consequences.
Excessive consumption is important to note because people often imitate portion sizes they observe others consuming. One study (Romero, Epstein, & Salvy 2009) showed that participants exposed to a video demonstrating a larger serving size consumed a larger amount of cookies than participants exposed to a video with a smaller serving size. It is of interest that the
participants did not eat as much as they saw in the larger serving size video, perhaps because “participants saw the very large amount of cookies in this condition as an excessive and unrealistic amount of food to consume” (Romero, Epstein, & Salvy 2009).
In the Story and Faulkner study (1990), there were more visual references than verbal references, but in this study, there was no significant difference between the number of episodes with visual references and those with verbal references. This may be due in part to the fact that they used the total references, while this study considered episodes which contained one visual reference the same as an episode which contained eight. The type of programming viewed during each study may have influenced the results. Only prime-time shows were considered by Story and Faulkner, and only animated programs were considered in this study. As Korr states in his study, the writers of these programs “are unconstrained by regular sets and props, and [their] integration of food into programs is thus limited only by their imagination” (2008). It may be that the assumption that it is easier to draw food in the background than to include a verbal reference in the script is incorrect, due to the possibility that children’s animated programming scripts do not need to make as much sense as live-action programming for adults does.
Based on the MyPyramid.gov recommendations, each of the combined groups used for analysis in this study should consist of about a third of the diet. However, this study found that the time given to Grains and Extras represented 63.38% of the total time given to food
references, which was significantly more than 33.33% of the total food time (z=6.11, p<0.0001). Both the Fruits and Vegetables group and the Meats and Beans and Milk group were represented significantly less than 33% of the total food time (20.28%, z=-2.66, p<0.001 [Fruits and
In addition, 32.61% of the episodes viewed contained written references. This is
especially important because half of the age group considered is just learning to read (2-5 years of age) (American Academy of Pediatrics [AAP] 1999). One thing that is suggested when teaching children to read is to connect the spoken and written words to each other as well as to a picture or object (AAP 1999). The written references in the episodes may be more important for children who are just learning to read, since they may be learning about certain food groups with preference over others.
These results are important because there is already concern about the types of foods children are choosing to consume. Perhaps more children would learn to eat a better ratio of foods if the underrepresented categories were presented in more appealing ways or the foods were more evenly represented.
While this study shows many interesting results, it also has many limitations. Most of these come from the differences in the way the programs were viewed and data was recorded during this study compared to how children would actually view the shows. When the programs were being viewed, multiple-speed playback was used to ensure the accurate recording of data. However, when children watch these episodes, they would be watching it in real time, without going back and reviewing a certain segment to see if a food was being presented. When a highly variable food, like pizza, was presented without specifics, it was estimated for the purposes of being categorized in food groups. The categorizations made in this study might be different than those made by a child viewing the episode.
In addition, foods referenced during common sayings like “Hot dog! Hot diggity dog!” and “To be in a pickle” were not counted as food, but young children may not understand the difference between these sayings and other verbal food references. Furthermore, drinks that
were not identified verbally and could not be accurately identified visually and unidentifiable colored blobs were not counted as food, but children may still consider them as such when they watch the programs, increasing the total number of food references. In general, the way that children view and understand programs is different than the way that adults do so, and the fact that the data was collected by someone outside of the age range selected (2-11 years old) may affect the results.
In fact, it is known that children’s “naïveté makes a preschooler and even an elementary schooler more likely to believe, learn from, and respond emotionally to media messages than is a more mature and discriminating adult” (Stratsburger, Wilson, & Jordan 2009). There are five steps that people go through to understand media like a television program: 1) select the most important information, 2) arrange the events into a plot, 3) draw inferences from implicit clues, 4) use related information from memory to understand the plot, and 5) evaluate the message (Stratsburger, Wilson, & Jordan 2009).
Stratsburger, Wilson, & Jordan (2009) say the age of the child and the variety of their experiences greatly affect their ability to go through these steps. Information that children determine is important varies with age, and the amount of related information they have in their memory will affect the way they understand and evaluate the message. This is important to this study because if younger children see a character consume a food and then experience a negative consequence, they may not associate the consequence with consumption of that food, since they are generally not as skilled as older children in connecting scenes and drawing implicit
conclusions. This also has implications for programs containing excessive consumption. Older children participating in the Romero, Epstein, and Salvy study (2009) that was mentioned earlier
were able to decide that the larger serving size in the video was unrealistic, but younger children may not be able to determine that when they view a program containing excessive consumption.
Other limitations include the network selection, the age range considered, and the
exclusion of commercials and the main introduction and theme songs from the study. This study considered 10 broadcast and 10 cable shows, which were most popular. The average child may not watch all 20 shows or even all 10 of one set (broadcast or cable), which would mean that the food references they are exposed to would vary from those found in this study. The study considered only programs that were most popular with children 2-11 years of age. Because this was such a wide range, the difference in total television viewing time would vary greatly, so the top 10 shows of this age range might be more weighted to containing shows preferred by older children. Also, cognitive abilities are very different throughout that age range, leading to varied interpretation and understanding.
The programs in this study were viewed without theme songs or commercials. Commercials during children’s programming are known to be high in certain food categories over others and that might affect the children’s viewing of the programming itself. However, with the increasing use of DVR and On Demand options, this may be less of a concern as watching commercials becomes more optional. When children watch these programs, they are exposed to the food references in the main theme songs and introductions as well as the
individual episodes. Viewing these introductions may even have an exaggerated effect
compared to the episode food references, since most introductions and theme songs are catchy and memorable.
Many of these limitations and assumptions could be researched in future studies with children subjects to record their interpretations and determine the significance of these results.
To minimize the limitations of future studies, using Nielsen reports of programming popular with groups with less variance in age is recommended, for example, groups of 2-5 years and 6-11 years of age. In addition, it is also important to note that the food references in the episodes varied in length and frequency. It would be interesting to see if future research can identify whether this matters (for example, if a 30 second reference all at once is perceived differently from five six second references). Also, a study on whether certain types of references (visual, visual written, verbal, or in combinations) have a stronger effect than others is recommended.
While the food categories in this study were grouped in pairs, it would be interesting to see if the relationships found are constant if the categories were considered individually. This would allow for closer comparisons with the Dietary Guidelines, since the Meats and Beans and Milk group could be separated into Meats and Beans (which most people consume adequately) and Milk (of which most people consume insufficient quantities).
In this study, observations were made regarding the presentation of physical activity, and it was found that 13.04% of the episodes viewed contained physical activity references. A follow-up study could test whether the inclusion of physical activity in programming influences the overall effect of the food references on the children viewing them.
Despite these limitations, this study is important because it uses the new MyPyramid.gov categories to allow comparison with the USDA recommendations. The use of MyFood-a-pedia to categorize the foods, rather than “healthy” and “unhealthy” subjective measures, leads to a less-biased study; allows combination foods to be coded, rather than estimated or just ignored; and doesn’t give the idea that a certain food is always bad or good.
There is less bias in this study than in the previous studies because the MyFood-a-pedia corresponds to the recommendations at MyPyramid.gov, rather than to a constantly changing
definition of what is considered “healthy” (Guthrie 1977). In addition, in previous studies that attempted to separate foods by categories rather than degree of “healthiness” (Kaufman 1980; Korr 2008) foods that could be considered in multiple categories were only considered in one. MyFood-a-pedia allows a food to be listed under multiple categories, and those results were used in this study.
One of the major problems with labeling a food as “healthy” or “unhealthy,” even with more recent attempts, is that the label does not take into account for “combinations of
foods/beverages that comprise a well-balanced overall diet because it rates each item in
isolation” (Martin, et al. 2009). This could lead to people thinking that one food is always “bad” to eat and another is always “good,” when realistically, the “bad” food can be enjoyed as part of a balanced diet, and sometimes the “good” food, in an unbalanced diet, can be detrimental. This sometimes can occur with a food like pretzels, which are often considered to be “good” because they are low in fat. In a diet already skewed by containing too large a proportion of refined grains, the pretzels can actually add to the problem. The methodology in this study accounts for that and allows closer comparison to the MyPyramid.gov recommendations and trackers that evaluate overall diet and lifestyle, with the goal that people learn to eat a balanced diet, as measured by each food group in proportion to the others.
Conclusions
This study is important because while there have been many studies on the content of advertisements and the total hours of television viewed, there is not much data on how foods are presented within the program itself. It has been in previous studies that television plays an important role in learning health messages (Tapper, Horne, & Lowe 2003; Rideout 2009); thus, it
is important to know what information is being communicated to children watching the programs and how health experts can reinforce, change, or counter the information presented. The results of this study could imply that children are taught through animated programming to value the high-fat, high-sugar foods the programs over-represent, contributing to the nutritionally
unbalanced eating habits of children in the US. These results imply that it is especially important to discuss with children the foods presented in animated programming and to teach them about eating sufficient quantities of all food groups.
References Cited
American Academy of Pediatrics (AAP). (1999). Helping your child learn to read. Retrieved 27 Feb 2010, from www.algonquinpediatrics.com/Helping%20Your%20Child%20
Learn%20to%20Read.pdf
Centers for Disease Control and Prevention (CDC). (2009). Overweight and obesity. Retrieved 26 March 2009, from http://www.cdc.gov/nccdphp/dnpa/obesity/index.htm
Gantz, W., et al. (2007). Food for thought: Television food advertising to children in the United States. Retrieved 3 Mar 2010, from http://www.kff.org/entmedia/upload/7618.pdf. Guthrie, H.A. (1977). Concept of a nutritious food. Journal of the American Dietetic
Association. 71.1, 14-19.
Hersey, J.C. and Jordan, A. (2007). Reducing children’s TV time to reduce the risk of childhood overweight: The children’s media use study. Retrieved 17 Mar 2009, from
http://www.cdc.gov/nccdphp/dnpa/obesity/pdf/TV_Time_Highlights.pdf. Kaufman, L. “Prime Time Nutrition.” Journal of Communication. 30 (1980): 37-46.
Kim, R. S., Seitz, A., and Shams, L. (2006). Sound aids perceptual learning [Abstract]. Journal of Vision. 6.6:151, 151a, Retrieved 3 Mar 2010, from http://journalofvision.org/6/6/151.
Korr, J.L. (2008). Healthy cartoons? A content analysis of foods in children’s animated television programs. Food, Culture, & Society. 11.4, 449-462.
Krebs-Smith, S.M., et al. (2008). Usual dietary intakes: Food intakes, US population, 2001-04. Retrieved 27 Mar 2009, from http://riskfactor.cancer.gov/diet/usualintakes/pop/
Friedrich, L.K. and Stein, A.H. (1973). Aggressive and prosocial television programs and the natural behavior of preschool children. Monographs of the Society for Research in Child Development. 38.4, 1-64.
Martin, et al. (2009). Modeling expert opinions on food healthfulness: A nutrition metric. Journal of the American Dietetic Association. 109.6, 1088-1091.
Murphy, S.T., Hether, H.J., and Rideout, V. (2008). How healthy is prime time? An analysis of health content in popular prime time television programs. Retrieved 18 Mar 2009, from http://www.kff.org/entmedia/upload/7764.pdf.
Radnitz, C., et al. (2009). Food cues in children’s television programs. Appetite. 52, 230-233. Rideout, V. (2008). Television as a health educator: A case study of Grey’s Anatomy. Retrieved
18 Mar 2009, from http://www.kff.org/entmedia/upload/7803.pdf
Romero, N.D., Epstein, L.H., and Salvy, S. (2009). Peer modeling influences girls’ snack intake. Journal of the American Dietetic Association. 109.1, 133-136.
Story, M. and Faulkner, P. (1990). The prime time diet: A content analysis of eating behavior and food messages in television program content and commercials. American Journal of Public Health. 80.6, 738-740.
Strasburger, V.C., Wilson, B.J., and Jordan, A.B. (2009). Children, adolescents, and the media, 2nd ed. California: SAGE Publications.
Tapper, K., Horne P.J., and Lowe, C.F. (2003). The food dudes to the rescue! Psychologist. 16.1, 18-21.
US Department of Health and Human Services (HHS) and US Department of Agriculture (USDA). (2005). Dietary guidelines for Americans. Washington, DC: US Government Printing Office.
Wiecha, J.L., et al. (2006). When children eat what they watch: Impact of television viewing on dietary intake in youth. Archives of Pediatrics and Adolescent Medicine. 160, 436-442. World Health Organization (WHO). (2009). Obesity and overweight. Retrieved 27 Mar 2009,
Appendix A –Viewing Rubric
Show: Time/Date Aired: New/Repeat
Episode Name: Network: Length: ____ min.
Summary:
Criticism or Valuing Type of Food, Other Observations
1 2 3 4 5 Visual Verbal Eaten
Excessive Consumption Consequences
1 2 3 4 5
Criticism or Valuing Type of Food, Other Observations
1 2 3 4 5 Visual Verbal Eaten
Excessive Consumption Consequences
1 2 3 4 5
Criticism or Valuing Type of Food, Other Observations
1 2 3 4 5 Visual Verbal Eaten
Excessive Consumption Consequences
1 2 3 4 5
Criticism or Valuing Type of Food, Other Observations
1 2 3 4 5 Visual Verbal Eaten
Excessive Consumption Consequences
1 2 3 4 5
Criticism or Valuing Type of Food, Other Observations
1 2 3 4 5 Visual Verbal Eaten
Excessive Consumption Consequences