Satisficing Data Envelopment Analysis: A Bayesian approach
for peer mining in the banking sector
Vincent Charles*
Buckingham Business School University of Buckingham Hunter Street Buckingham, MK18 1EG United Kingdom. Email: [email protected] Phone number: +44 07491 226 227 Ioannis E. Tsolas
School of Applied Mathematics and Physics, National Technical University of Athens, 9 Iroon Polytechniou Str, Zografou Campus, 15780 Athens, Greece.
Email: [email protected]
Tatiana Gherman
School of Business and Economics, Loughborough University,
Loughborough, LE11 3TU United Kingdom.
Email: [email protected]
Satisficing Data Envelopment Analysis: A Bayesian approach
for peer mining in the banking sector
Abstract
Over the past few decades, the banking sectors in Latin America have undergone rapid structural changes to improve the efficiency and resilience of their financial systems. The up-to-date literature shows that all the research studies conducted to analyze the above-mentioned efficiency are based on a deterministic data envelopment analysis (DEA) model or econometric frontier approach. Nevertheless, the deterministic DEA model suffers from a possible lack of statistical power, especially in a small sample. As such, the current research paper develops the technique of satisficing DEA to examine the still less explored case of Peru. We propose a Satisficing DEA model applied to 14 banks operating in Peru to evaluate the bank-level efficiency under a stochastic environment, which is free from any theoretical distributional assumption. The proposed model does not only report the bank efficiency, but also proposes a new framework for peer mining based on the Bayesian analysis and potential improvements with the bias-corrected and accelerated confidence interval. Our study is the first of its kind in the literature to perform a peer analysis based on a probabilistic approach.
Keywords: data envelopment analysis; satisficing DEA; mathematical programming; banking; peer mining; Bayesian predictive analytics.
1. Introduction
Data envelopment analysis (DEA), regarded today as one of the excellent management science tools to measure the productive efficiency of a set of entities (known as decision-making units or DMUs), can be traced back to the works of Debreu (1951), Shephard (1953), and Farrell (1957). There are two well-known DEA models: (a) the CCR model, which assumes constant returns-to-scale and was introduced by Charnes, Cooper, and Rhodes in 1978, and (b) the BCC model, which assumes variable returns-to-scale and was introduced by Banker, Charnes, and Cooper in 1984. Furthermore, there are two possible radial orientations: (a) input orientation (seeking to reduce the level of inputs while maintaining the same level of outputs) and output orientation (seeking to increase the level of outputs while maintaining the same level of inputs).
DEA employs the well-known notion of Pareto efficiency, which specifies that a given DMU is not efficient in producing its outputs from given amounts of inputs, if it can be shown that some other DMU or combination of DMUs can produce more of some output without producing less of any other output and without employing more of any input (Udhayakumar, Charles, & Kumar, 2011). Thanks to these unique characteristics, the recent years have seen a great variety of DEA applications in various fields, providing guidelines to support decisions worldwide. According to a recent survey (Liu et al., 2013), banking ranks as number one, followed by healthcare, agriculture and farming, transportation, and education. For further discussion regarding DEA extensions and applications, the interested reader is referred to the studies by Banker, Charnes, and Cooper (1984), Banker et al. (1989), Charnes and Cooper (1985), and Seiford and Thrall (1990).
DEA is a nonparametric approach, in the sense that the functional form of the production frontier is not required; moreover, it can easily accommodate the cases where the DMUs are involved in producing multiple outputs with the help of multiple inputs. By means of employing linear programming techniques, DEA floats a piecewise linear surface to rest on top of the observations (Seiford & Thrall, 1990). In its early stage of development, the DEA approach has been subject to criticism because of its sensitivity to data (Wen, 2015) and lack of statistical properties (Greene, 1993; Schmidt, 1985). As a result, a key to the success of the DEA modeling is the accurate measurement of both inputs and outputs; nevertheless, in real situations, such as in the banking system, this can be difficult because inputs and outputs may be either volatile or
too complex to measure. In regard to its statistical properties, “DEA allows only for one-sided deviations from the production frontier due to possible DMU inefficiency. It does not provide for possible errors in model specification or measurement, which may result in deviations on either side of the production frontier” (Banker, 1986, p. 1).
Thus, in a new research strand, some pioneering works have tried to tackle the issues of data variation in DEA and the lack of statistical properties with the aid of stochastic modeling. In particular, Wen (2015) and Sengupta (1982) proposed a generalization of the DEA stochastic modeling by applying the expected value to the stochastic inputs and outputs. Banker (1993) laid the statistical foundation for DEA by showing that, under certain conditions, the DEA estimators are also maximum likelihood estimators. Other works, e.g., Olesen and Petersen (1995), Banker (1986), Cooper, Huang, and Li (1996), Cooper et al. (1998), and Land, Lovell, and Thore (1993) tried to address the stochastic variations in the data by introducing chance-constrained programming (CCP), developed by Charnes and Cooper (1963) and Kall (1976). Additional stochastic DEA approaches can be found in Horace and Schmidt (1996), Gong and Sickles (1992), Simar (1996), Simar and Wilson (1998), and Grosskopf (1996). Olesen and Petersen (2016) have recently provided a review of Stochastic Data Envelopment Analysis, in which they extend the DEA framework in three different directions: (a) extensions in which DEA is able to handle deviations from the deterministic frontier as random variables; (b) extensions in which DEA is able to handle random noise in the form of measurement errors or specification errors; and (c) extensions in which DEA is able to handle the Production Possibility Set (PPS) as random.
In CCP, it is assumed that the efficiency of a DMU is stochastic and that the observation is an occurrence of a random phenomenon. CCP makes it possible to replace deterministic elements such as “efficient” and “inefficient” with stochastic ones, such as “probably efficient” and “probably inefficient” or “sufficiently efficient” with associated probabilities, thus allowing inferences about the DMUs’ performance. Other alternatives include the “E-model” of CCP to derive an “expected value” approach and the “P-model” of CCP to obtain the “most probable” occurrences (Wen, 2015).
In order to explore how stochastic data variations in inputs and outputs affect the weighting scheme for efficiency measurement, Sengupta (1987) reformulated the DEA model into a deterministic equivalent. The randomness of the inputs is incorporated in his model, by means of
allowing a certain degree of dispersion of the inputs around their central location. In 1995, Olesen and Petersen used CCP to develop a model for efficiency evaluation in the presence of an unknown amount of noise in the data, which they further applied to evaluate the research activities in the economics departments at Danish universities. Retzlaff-Roberts and Morey (1993) applied the goal programming approach to study the allocative efficiency and developed a stochastic allocative DEA model, which is suited for multiple and non-commensurate inputs and outputs; they showed how the use of bounds allowed the identification of the significantly inefficient units. CCP was also employed by the LLT model (Land, Lovell, & Thore, 1993) and the OP model (Olesen & Petersen, 1995) to derive efficient frontiers that allow a part of the observed input-output combinations to be located on the wrong side of the frontiers. Cooper et al. (2004) classified these two models as “E-models” using marginal chance constraints. The interested reader is further referred to Cooper et al. (2002, 2004) for other contributions to E-model formulations of marginal chance-constrained DEA (CCDEA). It was Olesen (2006) who brought together the LLT model and the OP model to propose a merged model that combined the attractive features of each of the two models. In their respective P-model of CCP, Cooper et al. (1998), Li (1998), and Bruni et al. (2009) utilized joint chance constraints to extend the notion of stochastic efficiency to a measure called “α-stochastic efficiency”.
Applications of CCDEA can be appreciated in the following studies: Sueyoshi (2000) applied the stochastic DEA approach to the restructuring strategy of a Japanese petroleum firm; Chen (2002) applied both CCDEA and stochastic frontier analysis (SFA) to estimate the technical efficiency indices in the Taiwanese banking sector; Yang and Wen (2005) applied the CCP approach to a transmission system expansion planning; Talluri, Narasimhan, and Nair (2006) proposed a CCDEA approach for vendor selection; Agpak and Gokcen (2007) applied CCP to a stochastic line balancing problem; Yang et al. (2007) applied CCP to investigate the reactive power planning; finally, Bhattacharya (2009) applied a chance-constrained goal programming model to an advertising planning problem.
It is to be highlighted that the CCDEA approaches discussed above suffer from a major drawback in the sense that they do not incorporate the idea of “Satisficing”, a concept whose origin can be traced back in the literature on psychology, where Simon (1957) used the term as an alternative to the assumption of “optimizing” behavior. It was the study by Cooper, Huang,
and Li (1996) the one that incorporated the concept of “satisficing” into DEA, which translated into the development of a satisficing DEA model.
In this paper, we propose a satisficing DEA model to measure the bank-level efficiency under a stochastic environment, which is free from any theoretical distributional assumption. The proposed model is applied to the Peruvian banking sector to measure the efficiency of 14 banks. By applying a simulation technique, the efficiency distribution and the reference set (peers) of each bank with their respective probabilities are obtained. Moreover, we improve upon Tsolas and Charles (2015) by proposing a new framework for peer mining based on the Bayesian analysis and potential improvements. This is a contribution to the literature, given that our Bayesian-based criterion is not included in the family of already stochastic DEA classification procedures (Wen, 2015), such as the expected ranking criterion that is based on the optimization of expected value, the optimistic ranking criterion that is based on the maximization of the CCP objective function, the maximal chance ranking criterion that is based on the maximization of the dependent chance programming (DCP) (Liu, 1997) objective function, and Hurwicz’s (1951) ranking criterion. Furthermore, to the best of our knowledge, our study is the first of its kind in the literature to perform a peer analysis based on a probabilistic approach. In this sense, the proposed Bayesian approach for peer mining constitutes the main contribution of the paper.
2. Latin America and Peru: An overview
2.1Institutional background of the Latin American and Peruvian banking sector
Over the past few decades, many Latin American countries have undergone significant and rapid institutional and structural changes; among these, the financial liberalization has established itself as a multifaceted process and brought important changes to the banking sectors. Banks are critical to the proper functioning of an economy by means of intermediating funds at all levels of the economic activity. Furthermore, as developing countries, in general, count with shallow mechanisms of finance, it is not too bold to say that banks represent the backbone of their respective economies. This is also the case of Latin America, in general, and of Peru, in particular.
As Beim and Calomiris (2001) elegantly stated, financial liberalization is a mixture of the following types of “constraint relaxation”: “i. Elimination of interest rate controls, ii. Lessening
of bank reserve requirements, iii. Reduction of government interference in banks’ lending decisions, iv. Privatization of nationalized banks, v. Introduction of foreign bank competition, and vi. Facilitation and encouragement of capital inflows” (p. 119).
Fundamentally, the liberalization wave in Latin America has brought more drastic changes in terms of opening up entry points for foreign banks, consolidation of banks through mergers and acquisitions, and the reduction of the government control over the interest rate regulation. It is in this context that most countries in Latin America privatized aggressively, leading to a fall in the average state ownership of banks from 55% to 40% between 1985 and 1995. The countries that privatized the most were Chile, Ecuador, and Peru, who moved from levels of state ownership that were above or near 90%, to levels below 40% (below 30% and 20% in the cases of Peru and Chile, respectively) (Charles et al., 2011). One of the most important aspects of the liberalization process was the deterioration of the barriers of entry, which permitted the access to the market of new commercial banks and other types of financial agents, leading to a growing importance of the multinational banks (MNBs) over time. If in 1995, the MNBs accounted for less than a quarter of the assets in the financial systems in many Latin American countries, by the end of 2001, foreign banks controlled more than 50% of the same (Micco & Panizza, 2004). Furthermore, the consolidation of the banking sector through mergers and acquisitions and the increased bank concentration led to a decline in the number of banks by approx. 33% between the years 2001 and 2005.
In the case of Peru, specifically, the 1990s brought market-oriented measures, such as reductions of the fiscal imbalance, imposition of new taxes, elimination of restrictions and lowering of tariff rates, the introduction of a managed float as the new foreign exchange rate, and the privatization of state-owned enterprises, among others. As for the banking system, the changes executed implied that “foreign banks would receive equal treatment with domestic capital, private banks would be placed on equal footing with banks owned by the public sector, risk diversification would be required among bank loan portfolios and banks would be allowed to operate nationally” (Quispe-Agnoli & McQuerry, 2001, p. 10). Regarding the number of banks in Peru, this has decreased drastically from 25 in 1998 to 16 in 2000 and further to 12 in 2005. According to the Superintendencia de Banca, Seguros y AFP (SBS), the regulator of the Peruvian banking sector and insurance companies, it is today that almost 50% of all the deposits in Peru are captured by foreign banks. Furthermore, MNBs pose a significant threat to the
domestic banks, given that the former hold a scale advantage in terms of a high return on technological investment, low marginal cost, and worldwide know-how and best practices. All of these aspects call for domestic banks to become more efficient.
2.2 Literature on Latin American and Peruvian banking efficiency
The assessment of bank efficiency is imperative, as it allows practitioners and policy-makers alike to examine a series of aspects, such as: the impact of ownership structure on banking efficiency (Tzeremes, 2015), the relationship between bank size and efficiency (Chen, 2002), the impact of market structure on banking efficiency (Fu & Heffernan, 2007), and the effect of deregulation on banking efficiency (Jaffry, Ghulam, & Cox, 2013), among others. In the aftermath of liberalization, restructuring, and deregulation of financial markets around the world, a number of studies have been undertaken in both developed and developing countries, to measure the efficiency of the financial system and, in particular, of the banks, using either parametric (e.g., stochastic frontier analysis) or non-parametric (e.g., data envelopment analysis) approaches. However, studies dedicated to analyzing the efficiency of Latin American countries in particular are very limited and, in the case of Peru, they are almost nonexistent. In a survey paper by Fethi and Pasiouras (2010), it was observed that 52.4% of the studies focused on banks in Asia, followed by 32.9% in Europe, 8.7% in the USA, 5.4% in Australia, and 0.67% in Africa. It is to be noted that none of the studies in the list above addressed the banks in the Latin American countries.
Among the few studies we found to have been dedicated to studying the efficiency measurement in selected Latin American countries, we mention those concerning Mexico (Guerrero & Negrin, 2005; León, 1999; and Taylor et al., 1997), Chile (Fuentes & Vergara, 2007), Brazil (Staub, da Silva e Souza, & Tabak, 2010), and Argentina (Charles, Peretto, & Gherman, 2016). Some of the existing studies (Carvallo & Kasman, 2005; Chortareas, Girardone, & Garza-Garcia, 2010; Forster & Shaffer, 2005; and Rivas, Ozuna, & Policastro, 2006)focused on evaluating the efficiency of the Latin American banks by pulling the samples across a set of countries. Rivas, Ozuna, and Policastro (2006) investigated the effects of the use of derivatives on the bank efficiency in Brazil, Chile, and Mexico and found that bank efficiency was positively associated with the bank size and that the regulatory and the institutional constraints negatively affected the efficiency of Latin American banks. Carvallo and Kasman
(2005) used a stochastic frontier approach on a sample of 481 banks in 16 Latin American countries to estimate cost inefficiencies and scale and scope economies and found that very small and very large banks tended to be more inefficient when compared to medium-sized banks. Chortareas, Girardone, and Garza-Garcia (2010) used the DEA technique for a sample of over 2,500 banks in nine Latin American countries to investigate “whether banks earn supernormal profits because they are exercising market power or as a result of achieving higher efficiency levels” (p. 321) and found evidence that efficiency (particularly, the scale efficiency), along with capital ratios and bank size, seemed to be the main driving forces of the increased profitability for most of the Latin American banks. Finally, Forster and Shaffer (2005) found a robust association between bank efficiency and absolute size, but not between bank efficiency and relative size.
With regards to Peru, it is the study by Charles et al. (2011) the one that made the first serious attempt to analyze the efficiency of the banking sector. In their study, the authors applied the DEA technique to evaluate the efficiency of the Peruvian banks for the period 2000 to 2009 and benchmarked the existing Peruvian banks based on their super-efficiency scores over time. The results showed an increasing trend in technical efficiency during the period under study, revealing a positive indication of the success of the reform process that resulted in an increase in the share of foreign banks and in the consolidation and privatization of the Peruvian banking sector. Furthermore, MNBs were observed to perform better than the domestic banks in terms of technical efficiency throughout the entire period, except for the year 2007.
It is to be noted that all of the above-mentioned studies regarding the efficiency measurement in the Latin American countries, are based on a deterministic DEA model or econometric frontier approach. As mentioned previously, however, and especially in small samples, the deterministic DEA model counts with the disadvantage of a possible lack of statistical power; as Post (2007) stated, the data can ‘speak for themselves’ only if the sample comprises many efficient empirical observations for a wide range of production vectors. The DEA by construction fixes “the frontier in the relevant space and encompasses all the sample observations. Thus, a small subset of the data supports the frontier, making it more prone to sampling, outlier, and statistical noise problems, which may distort the measurement of efficiency” (Miller, Clauretie, & Springer, 2005, p. 3). Though the econometric approach to measure the efficiency takes into account the statistical noise in the data, the incomplete knowledge of the statistical properties of the estimates
and the restrictiveness of the reference technology affect the bias of the estimates. Grosskopf (1986) pointed out that both the level of restrictiveness of the reference technologies and the choice of error structure will, in general, affect the magnitude of the resulting efficiency measures.
The present study employs the technique of satisficing DEA to examine the still less explored case of the Peruvian banking sector. From a methodological point of view, when there is no uncertainty in the inputs and outputs of the DMUs, a deterministic DEA can be used to analyze the efficiencies of the DMUs. However, as Chebil, Abbas, and Frija (2013) explained, in many situations, the inputs or outputs of the DMUs are random variables, “so technical efficiency conclusions based upon a deterministic DEA can be misleading because of the high sensitivity of the efficiency scores to the realized levels of inputs or outputs” (p. 2). Stochastic DEA (SDEA) methods which incorporate the stochastic variation in inputs or outputs have, therefore, been designed to deal with this problem. In such a case, one can address the issue of stochastic variation by employing a P-model CCDEA that will be handy to extract the efficiency of banks with various predetermined confidence levels, so as to make meaningful managerial decisions. Although in most of the cases the SDEA model is designed under the normality assumption, in our case, we exempt such an assumption and use the empirical distribution of the data.
The rest of the paper is organized as follows. The theoretical background, wherein the detailed computational procedures for stochastic efficiency are described, is presented next. Subsequently, the approach in the selection of inputs and outputs is explained, followed by the presentation of the results of the empirical analysis and the associated relevant discussion. The last section concludes the paper.
3. Formulation of the stochastic DEA model
DEA aims to identify the most efficient DMU among all DMUs and to estimate the relative efficiency of the DMUs. Consider a set of n banks, each consuming different amounts of a vector
of inputs, to produce a vector of outputs , wherein the
superscript T represents the transpose. The DMU to be evaluated is termed DMU0 and its input-output vector is denoted as .
(
1 2)
T
j j j mj
x = x ,x ,...,x yj =
(
y , y ,..., y1j 2j mj)
TThe input-oriented Banker-Charnes-Cooper (BCC) model, in line with Banker, Charnes, and Cooper (1984), can be defined as follows:
(1)
where the contraction factor exceeds unity, Efficiency is the reciprocal of the contraction factor f, i.e., 1/
f j
(= ). Here, represents the structural variable. Ignoring the constraint in model (1) results in the basic Charnes-Cooper-Rhodes (CCR) model.Charnes and Cooper (1959) were the first to propose CCP to measure the efficiency in the case of uncertainty, analyzing the cases of the possibility of violated constraints. To accommodate the stochastic variation, we modify our constraint equations in model (1) and add the mechanism of the chance-constrained formulation introduced by Land, Lovell, and Thore (1993). Thus, the corresponding chance-constrained efficiency measure is calculated in line with CCR as:
(2)
where “Prob” means probability and “~” identifies these inputs as random variables with known probability distributions. We also assume so that most DMUs (say 5%) will be
0 1 0 1 1 Max subject to 1 2 1 2 1 0 1 2 n rj j r j n ij j i j n j j j y y , r , ,...,s, x x , i , ,...,m, , , j , ,...,n, f l f l l l = = = ³ = £ = = ³ =
å
å
å
f
f
³1. j l 1 1 n j jl
= =å
0 1 0 1 Max subject to Prob[ ] 1 2 Prob[ ] 1 2 0 1 2 n rj j r r j n ij j i i j j y y , r , ,...,s, x x , i , ,...,m, , j , ,...,n. f l f a l a l = = ³ ³ = £ ³ = ³ =å
å
0 95 i r .a a
= =set as best performers. We assume that the inputs and outputs are stochastically independent; as such, the performance of one bank is independent of that of another bank. In order to extend the potential uses of the DEA models to cases where 100% efficiency can be replaced by aspiration levels of performance, Cooper, Huang, and Li (1996) incorporated Simon’s (1957) satisficing concept into the DEA models with chance constraints. In line with Udhayakumar, Charles, and Kumar (2011) and with the support of the above literature, the P-model CCDEA with “Satisficing” concept can be defined in model (2) as follows:
(3)
where “Prob” and “~” are as defined above and one can interpret as an aspiration level either imposed by an outside authority or adopted by an individual for some activity (Udhayakumar, Charles, & Kumar, 2011). It is to be noted that in model (3) the aspiration level is imposed only to the objective function and not at the constraint level, which means that the aspiration level at the constraint level is fixed at 100%.
Definition 3.1: If DMU0 is called stochastically efficient if and only if
Definition 3.2: If DMU0 is called satisficing efficient if and only if
3.1Stochastic simulation
The process is based on the stochastic simulation approach proposed by Rubinstein (1981), following the steps i) to iv):
i) The process starts by considering the following input constraints in model (3):
0 1 0 1 Max P( ) subject to Prob[ ] 1 2 Prob[ ] 1 2 0 1 2 n rj j r r j n ij j i i j j y y , r , ,...,s, x x , i , ,...,m, , j , ,...,n. f g l f a l a l = = ³ ³ ³ = £ ³ = ³ =
å
å
1 ( )b
=g
-1, =b
Prob(f g a
³ )= 0. 1, <b
Prob(f g a
³ )= 0.0 1 Prob 1 2 n ij j i i j x l x a , i , ,...,m = é ù £ ³ = ê ú ë
å
û (4) Let( )
0 1 n i ij i i j j I x ,l x l x . ==
å
- Then, the above constraint (4) can be represented as:( )
ProbëéI x ,i i l £0ùû³ai, i=1 2, ,...,m (5)
where xi=
(
x ,x ,...,xi1 i2 in)
is the amount of inputs that the random vector utilized and(
1, ,...,2 n)
l l l= l is the vector of structural variables. Each xij has an empirical distribution derived
from the existing data set.
ii) Based on these empirical distributions, for each xi the R independent random vectors are
generated as follows: ( )
(
( ) ( ) ( ))
1 2 1 2 1 2 r r r r i i i in x = x ,x ,...,x , r= , ,...,R; i= , ,...,m. (6)Let R'i
( )
£R , i=1 2, ,...,m be the number of times the following relation satisfies:( )
i 0 1 2i
I = x ,l £ , i= , ,...,m (7) Then, by the definition of the chance constraint, (7) and, hence, (5) hold if:
1 2
i i
R R³a, i= , ,...m. (8) iii) Repeat steps i) to ii) for the output constraints.
iv) Repeat steps i) to ii) for the stochastic objective constraint. 3.2 Monte Carlo Simulation Algorithm
The algorithm starts by producing randomly generated artificial data from the data set. The next step consists in running the P-model CCDEA using data produced in the first step, to compute the objective function value of the model and the structural variables, f and l
respectively, for a sufficiently large number of runs, say N. Finally, through the derivation of a series of stochastic and statistical metrics for each DMU, the probability of being efficient at least at the given aspiration level, the probability of being in the reference set, and the potential
improvement through the input reduction are computed. The following Figure 1 depicts the flow of the Monte Carlo simulation algorithm and the computation of the relevant metrics.
The steps i) to iv) of the simulation algorithm are described in detail below:
i) Produce artificial data by means of a random generator in accordance with the empirical distribution of each stochastic variable derived, respectively, from the data set.
ii) Obtain the efficiency score by solving the P-model CCDEA with “satisficing” concept (system (3)) for every realization given by step (i).
iii) Repeat steps i) to ii) and record 1/
f j l
(= ) , for a sufficiently large number of N runs. iv) Let j j1, ,...,2 jN be the efficiency score for N runs. Then, the following statistical metrics are derived:Expectation of efficiency scores:
1 1 N k N k Lim N j ®¥ = F =
å
(9)Variance of efficiency scores:
(
)
2V = F - F (10)
Standard deviation of efficiency scores: V (11)
Coefficient of variation of efficiency scores: V F (12)
Probability of the DMU being efficient: 1
(
)
0 k 1 kP =N-h j = ," (13) where h is a count function;
The probability of the DMU being efficient at least at the given aspiration levelbis:
(
)
1 k
k
Pb =N-h j £b," (14) The probability of the DMU being in the reference set is:
( )
(
)
(
( ))
1 0 k 0 k 1 2 j n k k j j j Pl h l , h l , , j , ,...,n. = = > "å
> " = (15) The potential improvement (%) for the ith input for the kth realization of DMU0 is( ) ( ) ( ) 1 0 0 100 1 1 2 1 2 n k k ij j j k i i x PI , j , ,...,n; i , ,...,m. x = æ ö ç ÷ ç ÷ = - = = ç ÷ ç ÷ è ø
å
l (16)3.3. Simple Bayes peer mining
A naive Bayes classifier is a simple probabilistic classifier based on applying Bayes’ theorem, which is one of the most efficient and effective inductive learning algorithms for machine learning and data mining.
One common rule is to pick the hypothesis that is most probable; this is known as the maximum a posteriori or MAP decision rule. In our case, the simple Bayes peer classifier selects the three most likely largest-order statistics
3
LOS
p (posterior probabilities) given that the DMU of interest is inefficient (I ), which eventually provides three peers for every DMU under study. The three largest-order statistics (Los3) a posteriori hypotheses are:
3 3 LOS P(I )P( ) arg Los , P(I )P( ) p p p p p p p Q Q Î Î =
å
(17) where Q is the space of possible hypotheses,p
- DMU of non-interest is a peer, P( )p
is the prior probability ofp
,and P(Ip
)is the likelihood probability ofp
. Note that, without loss of generality, one can ignore the denominator part (known as evidence), which is effectively constant for all the cases and does not affect the arg Los .3pÎQ
It is sufficient to optimize the
numerator part.
3.4 The bias-corrected and accelerated confidence interval
Let the sequence {j}be the efficient scores of the DMU of interest obtained from system
(3). Let the bootstrap draw samples from the empirical distribution of it to replicate statistics, say
{j } to obtain its sampling distribution. Since these distributions are skewed and also j is often consistent but, nevertheless, biased in finite samples, the bias-corrected and accelerated (BCa) method could be a better approach to obtain the confidence intervals when compared to the residual or the percentile or bias-corrected methods. BCa has better asymptotic properties than the classical ones based on a normality assumption (Efron, 1987).
The BCa confidence intervals are obtained based on the assumption that there is a
monotonic transformationFsuch that 2
0 ( )j ( )j D N(-zd d, ),
F F
éF - F ù¾¾®
ë û where z0 is a bias constant, d is the constant standard error of F( ),j dFis equal to unit plus aF( ),j and a is an acceleration parameter. It is to be noted that the variance of F( )j is dependent on j, which is not the case in the bias-corrected method.
4. Selection of inputs/outputs
One of the very first steps in carrying out DEA consists in the determination of inputs and outputs. It is generally acknowledged that in the banking sector literature, there is no comprehensive theory regarding the proper definition of inputs and outputs, what exactly constitutes inputs and outputs, or how these could be measured (Casu & Girargone, 2002; Fethi & Pasiouras, 2010; Sathye, 2003). However, two main approaches have been advanced in this regard: the “intermediation approach” and the “production approach” (Humphrey, 1985), with the recommendation that the former should be used when assessing the performance of whole banks, while the latter should be used when estimating the performance of bank branches. It is to be noted that in the intermediation approach, banks are seen as financial intermediaries that use the volume of financial liabilities (mostly deposits) as inputs, to produce loans and other means of financing, as outputs; while in the production approach, both loans and deposits are treated as outputs, with a view that deposits also provide liquidity, safekeeping, and payments services to depositors (Berger & Humphrey, 1997).
To select inputs and outputs, the current study employs the intermediation approach with a restricted choice of variables. For further details regarding the justification behind using the intermediation approach, the reader is referred to Charles and Kumar (2012), Kumar and Charles (2011), and Kumar, Charles, and Mishra (2016). DEA is sensitive to variable selection, i.e., as the number of variables increases, the ability to discriminate among the DMUs decreases; or otherwise stated, the more variables added, the greater becomes the chance that some inefficient unit will dominate the added dimension and become efficient (Smith, 1997).
In this context, the choice of inputs and outputs is guided by the existing literature and the data availability for the Peruvian banking sector. The present study considers two outputs: total loans (y1) and other earning assets (OEA) (y2). The output titled total loans is measured as the
sum of all the loan accounts intermediated by the banks, and the output titled OEA (y2) is measured as the sum of the total securities (treasury bills, government bonds, and other securities), deposits with banks, and equity investments.
The above two outputs are obtained from two inputs, namely, total costs (x1) and total deposits (x2). The input total costs is measured as the sum of the total interest expenses and non-interest expenses, including personal expenses. The non-non-interest expenses include service charges and commissions, expenses of general management affairs, salaries, and other expenses, together with health insurance and securities portfolios. Some researchers (e.g., Kao & Liu, 2004; Ram Mohan & Ray, 2004; Sathye, 2003; and Zhao, Casu, & Ferrari, 2008) treated the interest expenses and non-interest expenses as two different inputs. Nevertheless, when there is a high number of variables relative to the number of observations, a dimensionality problem emerges, i.e., more units tend to be wrongly identified as efficient; and when too many constraints are specified, the observations tend to become incomparable (Zhao, Casu, & Ferrari, 2008). Thus, to tackle the above, and in line with Casu and Molyneux (2003), Charles and Kumar (2012), Kumar and Charles (2011), Sealey and Lindley (1977), and Udhayakumar, Charles, and Kumar (2011), we have treated both these expenses as a single input. The second input, namely total deposits, is measured as the sum of the demand and savings deposits held by the bank and the non-bank depositors.
It is to be noted that in order to have adequate numbers of degrees of freedom (i.e., adequate discriminatory power for the DEA model), there are several studies in the literature on DEA which have provided methodologies to find a relation between the number of DMUs and the number of inputs and outputs. For example, Golany and Roll (1989) and Homburg (2001) suggested that the number of DMUs should be at least twice the number of inputs and outputs; Nunamaker (1985), Banker et al. (1989), Friedman and Sinuany-Stern (1998), Raab and Lichty (2002), and Cooper, Seiford, and Tone (2007) recommended that the number of DMUs should be at least three times the number of inputs and outputs; and Dyson (2001) suggested that the number of DMUs should be at least twice the product of the number of inputs and the number of outputs. In this study, we employ two inputs and two outputs, therefore, a minimum sample size ranging between 8 and 12 was required. It is to be noted, however, that while larger data sets may provide certain advantages, a recent study by Cook, Tone, and Zhu (2014) pointed out that, whereas in statistical regression analysis, sample size is a vital issue – as it tries to estimate the
average behavior of a set of DMUs –, when used as a benchmarking tool, DEA focuses on the performance of each DMU, and as such, the sample size or the number of DMUs being evaluated may be immaterial.
The data on inputs and outputs have been obtained from the official public website of the governmental institution that is responsible for the regulation and supervision of the Peruvian financial system, i.e., the Superintendencia de Banca, Seguros, y AFP (or SBS). The sample considered for the present study consists of the 14 banks existing in the sector, with the mention that the banks which left the market during the period of study are ignored.
5. Empirical findings
5.1. Stochastic efficiency
The summary of the stochastic efficiency of the banks under analysis is reported in Table 1. It can be observed that the average stochastic efficiency scores vary from a minimum of 0.380 (with a coefficient of variation of 0.572) in the case of Banco Azteca to a maximum of 0.889 (with a coefficient of variation of 0.216) in the case of Banco Santander Peru. The results reveal that Banco Santander Peru is the best performing bank, followed by Banco Continental BBVA, Scotiabank Peru, Banco de Credito, and Citibank Peru, while, at the other end, the least performing bank is Banco Azteca, followed by Banco Ripley, Banco de Comercio, HSBC Bank Peru, and Banco Falabella.
The columns under each of the four aspiration levels ( ), namely 1.00, 0.99, 0.95, and 0.90, indicate the probability of a bank being efficient at the given aspiration level. The results depict one interesting phenomenon, which is that regardless of the aspiration level, the probabilities of the different banks being efficient do not fluctuate enough to significantly reposition the DMUs relative to the efficient frontier. As such, it can be observed that at every aspiration level, the bank with the highest probability of being efficient is Banco Santander Peru, followed by Banco Continental BBVA, and Mibanco; on the other hand, the bank with the lowest probability of being efficient is by far Banco Azteca, followed closely by Banco Ripley, Banco Falabella, and Banco de Comercio. Furthermore, the results suggest that as the aspiration level increases the probability of most DMUs being efficient decreases gradually.
Table 1
Summary of the stochastic efficiency of the banks in Peru.
Note: SD = Standard Deviation; CV = Coefficient of Variation.
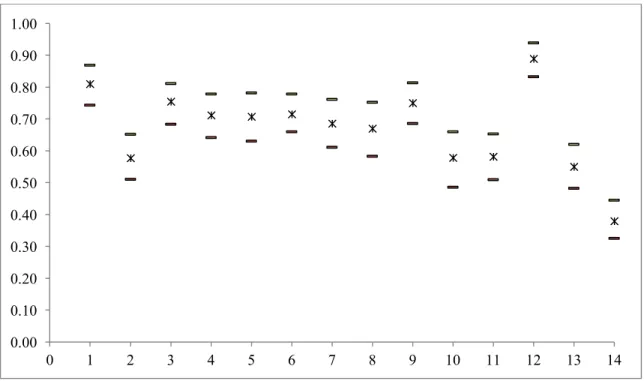
Figure 2 depicts the range of the stochastic efficiency scores for each bank, at 99% level of confidence.
Fig. 2. Range of the stochastic efficiency at 99% Bca confidence interval.
0.00 0.10 0.20 0.30 0.40 0.50 0.60 0.70 0.80 0.90 1.00 0 1 2 3 4 5 6 7 8 9 10 11 12 13 14
DMU Name of the bank Aspiration level (β0)
Average stochastic efficiency
Rank SD CV
1.00 0.99 0.95 0.90
1 Banco Continental BBVA 0.44 0.45 0.49 0.55 0.811 2 0.232 0.286
2 Banco de Comercio 0.14 0.14 0.18 0.21 0.578 12 0.274 0.474
3 Banco de Credito 0.33 0.34 0.37 0.41 0.755 4 0.247 0.327
4 Banco Financiero 0.26 0.27 0.30 0.40 0.712 6 0.256 0.359
5 Banco Interamericano de Finanzas 0.34 0.34 0.36 0.38 0.707 7 0.277 0.392
6 Citibank Peru 0.21 0.21 0.26 0.29 0.715 5 0.225 0.315 7 Interbank 0.35 0.35 0.36 0.37 0.686 8 0.286 0.417 8 Mibanco 0.40 0.40 0.42 0.47 0.670 9 0.341 0.509 9 Scotiabank Peru 0.27 0.29 0.33 0.36 0.773 3 0.204 0.264 10 HSBC Bank Peru 0.26 0.26 0.27 0.28 0.579 11 0.338 0.585 11 Banco Falabella 0.10 0.10 0.11 0.16 0.606 10 0.241 0.398
12 Banco Santander Peru 0.67 0.67 0.68 0.69 0.889 1 0.192 0.216
13 Banco Ripley 0.09 0.10 0.11 0.14 0.551 13 0.259 0.470
The results are supported by the findings of the study conducted by Charles et al. (2011), in which, under a deterministic DEA framework, the authors classified the Peruvian inefficient banks into 4 groups. The classification located Banco Azteca and Banco de Comercio in category I, namely, the category of the most inefficient banks, during the years 2008 and 2009, and situated Banco Santander Peru and Banco Interamericano de Finanzas in 2008 and Banco Financiero and Scotiabank Peru in 2009 in category IV, i.e., the category of the marginally inefficient banks.
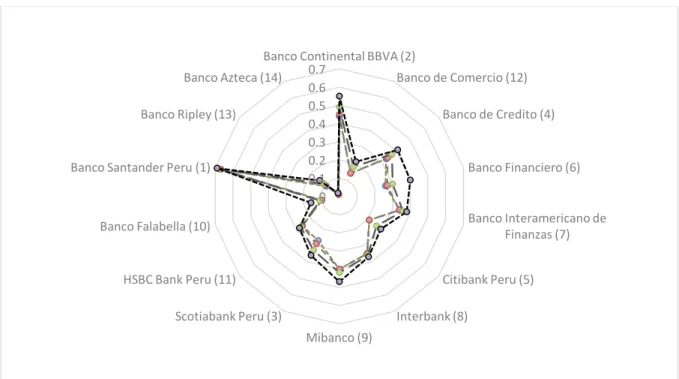
Furthermore, for a better understanding and visualization of the results, Figure 3 depicts graphically the aspiration levels provided in Table 1. The rank of the DMUs is also presented, based on the average stochastic efficiency.
Fig. 3. The banks at different aspiration levels.
0 0.1 0.2 0.3 0.4 0.5 0.6 0.7
Banco Continental BBVA (2)
Banco de Comercio (12) Banco de Credito (4) Banco Financiero (6) Banco Interamericano de Finanzas (7) Citibank Peru (5) Interbank (8) Mibanco (9) Scotiabank Peru (3) HSBC Bank Peru (11) Banco Falabella (10) Banco Santander Peru (1)
Banco Ripley (13) Banco Azteca (14)
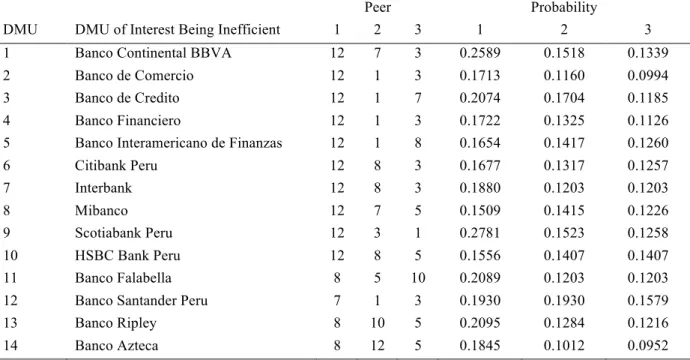
5.2. Reference set
Table 2 reports the probabilities of a bank being in the reference set (peers) for other banks in the sample. It can be observed that, for example, the three most probable peers for Banco Continental BBVA are Banco Santander Peru, Interbank, and Banco de Credito, with their respective probabilities of 0.2589, 0.1518, and 0.1339. Similarly, the three most probable peers for Banco de Comercio are Banco Santander Peru, Banco Continental BBVA, and Banco de Credito, with their respective probabilities of 0.1713, 0.1160, and 0.0994.
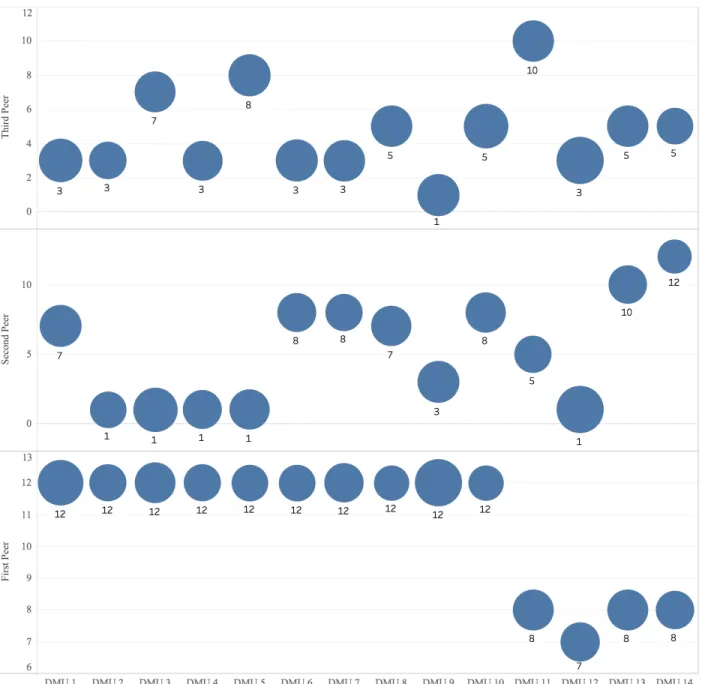
Furthermore, it can be noted that Banco Santander Peru is the peer for 11 banks out of the 14 banks under study, with the highest probability of being the peer for 10 banks. It is followed by Mibanco, which is the peer for seven banks, with the highest probability of being the peer for three banks. The next two banks which are prominently the peers for the inefficient banks are Banco de Credito and Banco Continental BBVA; these are, respectively, the peers for seven and six out of the 14 banks. It can also be observed that Banco de Comercio, Banco Financiero, Citibank Peru, Scotiabank Peru, Banco Falabella, Banco Ripley, and Banco Azteca never become peers for any of the inefficient banks, which are occupying the first three positions.
Table 2
Reference set: Bayesian-based peer mining.
Peer Probability
DMU DMU of Interest Being Inefficient 1 2 3 1 2 3
1 Banco Continental BBVA 12 7 3 0.2589 0.1518 0.1339
2 Banco de Comercio 12 1 3 0.1713 0.1160 0.0994
3 Banco de Credito 12 1 7 0.2074 0.1704 0.1185
4 Banco Financiero 12 1 3 0.1722 0.1325 0.1126
5 Banco Interamericano de Finanzas 12 1 8 0.1654 0.1417 0.1260
6 Citibank Peru 12 8 3 0.1677 0.1317 0.1257 7 Interbank 12 8 3 0.1880 0.1203 0.1203 8 Mibanco 12 7 5 0.1509 0.1415 0.1226 9 Scotiabank Peru 12 3 1 0.2781 0.1523 0.1258 10 HSBC Bank Peru 12 8 5 0.1556 0.1407 0.1407 11 Banco Falabella 8 5 10 0.2089 0.1203 0.1203
12 Banco Santander Peru 7 1 3 0.1930 0.1930 0.1579
13 Banco Ripley 8 10 5 0.2095 0.1284 0.1216
The following Figure 3 graphically depicts the information contained in Table 2, wherein the size of the circles is associated with the posterior probabilities listed in Table 2.
5.3. Potential improvements of inputs and outputs
DEA establishes a group of DMUs considered as best practice for each inefficient DMU and further computes the amount of potential improvements to be made to inputs and outputs. The below Table 3 reports the average potential improvements (PI) for the inputs and outputs for each bank under study, along with a BCa confidence interval of 99%.
It is well noted that Banco Santander Peru attained the first position at every aspiration level (Table 1); however, it is to be noted that at the 100% aspiration level, it has only 67% chance to be efficient; this means that it has 33% chance to be inefficient. The average stochastic efficiency is 88.9%, with a standard deviation of 0.192. In order to overcome the chances of inefficiency, Banco Santander Peru should increase its total loans and OEA, on average, by 35.42% and 14.05%, respectively (Table 3). Nevertheless, the target should be made to the upper limit of 96.38% for total loans and 26.96% for OEA, respectively, so as to sustain in the banking sector as the top most efficient bank. At the same time, the reduction of inputs is advised at 1.05% for total costs and 7.32% for total deposits.
Based on the same Table 3, the least performing banks, i.e., Banco Ripley and Banco Azteca, need to improve drastically by means of reducing their total costs by 38.99% and 52.25%, respectively, as well as by increasing their total loans, on average, by 123.74% and 293.31%, and their OEA by 410.51% and 309.65%, respectively.
Banco Interamericano de Finanzas, Mibanco, and Banco Ripley need to develop very strong strategies to improve their OEA drastically (see column UL under OEA in Table 3), in order to increase their chances of being efficient. If the strategies are not well planned, the said banks may be disappearing from the Peruvian banking sector, just like HSBC Bank Peru did.
Total loans always play a vital role in the banking sector. Findings reveal that Banco de Comercio and Banco Azteca need to enhance substantially their loaning scheme when compared with any other bank among the banks under analysis.
Table 3
The BCa CI of 99% for the inputs and outputs.
DMU Name of the bank Costs Deposits Loans OEA
PI LL UL PI LL UL PI LL UL PI LL UL
1 Banco Continental BBVA 0.00 0.00 -0.85 -1.84 0.00 -5.41 55.37 27.93 103.02 38.13 18.36 67.60 2 Banco de Comercio -4.23 0.00 -7.96 -0.03 0.00 -1.38 142.13 95.03 493.40 193.33 126.56 307.08 3 Banco de Credito -0.18 0.00 -2.85 -2.62 0.00 -7.09 102.00 47.19 286.03 107.11 39.98 271.32 4 Banco Financiero -8.29 0.00 -13.01 -0.34 0.00 -3.98 66.33 42.56 94.32 79.92 47.79 148.28 5 Banco Interamericano de Finanzas -0.94 0.00 -3.23 -1.21 0.00 -3.88 65.69 41.58 106.45 226.97 114.86 581.31 6 Citibank Peru -4.38 0.00 -7.92 -0.21 0.00 -2.55 68.50 47.11 95.86 90.50 49.42 190.64 7 Interbank -1.54 0.00 -4.17 -0.23 0.00 -1.89 113.26 65.46 200.79 99.37 57.42 174.16 8 Mibanco -12.27 0.00 -18.85 -0.28 0.00 -2.53 166.15 80.17 282.42 390.80 148.57 862.22 9 Scotiabank Peru -0.60 0.00 -2.26 -2.46 0.00 -6.66 63.54 41.27 90.75 36.69 25.73 50.40 10 HSBC Bank Peru -1.89 0.00 -5.61 -2.91 0.00 -7.95 178.94 98.77 394.13 389.67 286.58 502.69 11 Banco Falabella -23.27 0.00 -30.61 0.00 0.00 0.00 93.55 67.55 136.06 321.75 218.92 438.31 12 Banco Santander Peru 0.00 0.00 -1.05 -3.07 0.00 -7.32 35.42 9.74 96.38 14.05 4.79 26.96 13 Banco Ripley -31.41 0.00 -38.99 0.00 0.00 0.00 123.74 91.15 165.55 410.51 293.63 557.25 14 Banco Azteca -44.74 0.00 -52.25 0.00 0.00 0.00 293.31 216.65 407.16 309.65 204.36 457.38
6. Conclusion
The bank-level benchmarking by means of employing efficient frontier estimation methods, such as DEA, is used to monitor performance. The conventional DEA requires deterministic values, but in reality, observations are stochastic in nature and the deterministic estimated measures of efficiency might be distorted because of the variation in the data. The failure to capture the variations in the data might penalize some banks on their performance scores, while others might be rewarded for operating in favorable environments.
There is a plethora of approaches that can be adopted to obtain the efficiency under an uncertain environment. Our idea was to model through a satisficing DEA approach, which has few advantages, among which the most notable ones are: (a) the modeling is free from any distributional assumptions, (b) it allows to develop customized performance models that best reflect the bank management’s business aspirations, and (c) it allows the modelers to perform the reference set analysis based on the Bayesian approach.
Hence, the current paper proposes a satisficing DEA model applied to 14 banks operating in Peru to evaluate the bank-level efficiency under a stochastic environment, which as mentioned, is free from any theoretical distributional assumptions. Unlike the conventional DEA model,
which provides the results with certainty, the proposed model provides the efficiency scores, peer information, and potential improvements of each DMU under the probabilistic approach, with four aspiration levels. It is to be noted that an aspiration level is linked to probabilities. As mentioned above, satisficing DEA allows the bank management to develop customized performance models that best reflect their business aspirations. This is very important because the bank management, in making their (risky) choices, focus on reaching alternative specific outcomes, i.e, the aspiration levels. In this sense, the four aspiration levels provided in this study can serve as potential ones that may be adopted by the sampled banks. In the presence of an aspiration level in DEA, the researcher should investigate whether the probabilities of the different DMUs being efficient fluctuate enough to significantly reposition the DMUs relative to the efficient frontier.
The findings reveal the positioning of the individual banks on the market in the DEA context. In the light of the results of the study, Banco Santander Peru is observed as the best performing bank as it has the highest probability of being efficient and, moreover, it could be the reference point for most of the other banks in the sample. The potential improvement in the bank outputs is considerable, whereas, in the case of inputs, banks should concentrate mainly on the cost reduction.
A future scope of the present study would be to integrate the bank management’s perspective into the study of banking efficiency as a post-efficiency qualitative analysis so as to get additional insights; this could be done via focus groups or in-depth interviews. We will also investigate further the idea to present an orientation-free DEA satisficing model.
Acknowledgements
The authors would like to thank the Editors and three anonymous reviewers for their constructive comments on the previous version of this manuscript.
References
Agpak, K., & Gökçen, H. (2007). A chance-constrained approach to stochastic line balancing problem. European Journal of Operational Research, 180(3), 1098-1115.
Banker, R. D. (1986). Stochastic Data Envelopment Analysis. Working Paper, Carnegie-Mellon University.
Banker, R. D. (1993). Maximum likelihood, consistency and data envelopment analysis: statistical foundations. Management Science, 39(10), 1265-1273.
Banker, R. D., Charnes, A., & Cooper, W. W. (1984). Some models for estimating technical and scale inefficiencies in data envelopment analysis. Management Science, 30(9), 1078-1092. Banker, R. D., Kauffman, R. J., & Mahmood, M. A. (1993). Strategic information technology
management: perspectives on organizational growth and competitive advantage. Harrisburg, PA: Idea Group Publishing.
Banker, R. D., Charnes, A, Cooper, W. W., Swarts, J., & Thomas, D. A. (1989). An introduction to data envelopment analysis with some of its models and their uses. In J. L. Chan, & J. M. Patton (Eds.), Research in Governmental and Nonprofit Accounting (pp. 125-163). Connecticut, CT: Jai Press.
Beim, D. O., & Calomiris, C. W. (2001). Emerging financial markets. New York, NY: McGraw Hill Higher Education.
Berger, A. N., & Humphrey, D. B. (1997). Efficiency of financial institutions: international survey and directions for future research. European Journal of Operational Research, 98(2), 175-212.
Bhattacharya, U. K. (2009). A chance constraints goal programming model for the advertising planning problem. European Journal of Operational Research, 192(2), 382-395.
Bruni, M. E., Conforti, D., Beraldi, P., & Tundis, E. (2009). Probabilistically constrained models for efficiency and dominance in DEA. International Journal of Production Economics, 117(1), 219-228.
Carvallo, O., & Kasman, A. (2005). Cost efficiency in the Latin American and Caribbean banking systems. Journal of International Financial Markets, Institutions & Money, 15(1), 55-72.
Casu, B., & Girardone, C. (2002). A comparative study of the cost efficiency of Italian bank conglomerates. Managerial Finance, 28(9), 3-23.
Casu, B., & Molyneux, P. (2003). A comparative study of efficiency in European banking. Applied Economics, 35(17), 1865-1876.
Charles, V., & Kumar, M. (2012). Ranking of Peruvian banks through super efficiency DEA model variables-return-to-scale. In V. Charles, & M. Kumar (Eds.), Data Envelopment Analysis and its Applications to Management (pp. 116-135). Cambridge, UK: Cambridge Scholar Publishing.
Charles, V., Kumar, M., Zegarra, L. F., & Avolio, B. (2011). Benchmarking Peruvian banks using data envelopment analysis. JCC: The Business and Economics Research Journal, 4(2), 147-164.
Charles, V., Peretto, C., and Gherman, T. (2016). Technical Efficiency Analytics for the Public Banks in Argentina. ICPE Public Enterprise Half-Yearly Journal, 22(1), 118-139.
Charnes, A., & Cooper, W. W. (1959). Chanced-constrained programming. Management Science, 6(1), 73-79.
Charnes, A., & Cooper, W. W. (1963). Deterministic equivalents for optimizing and satisficing under chance constraints. Operations Research, 11(1), 18-39.
Charnes, A., & Cooper, W. W. (1985). Preface to topics in data envelopment analysis. Annals of Operations Research, 2(1-4), 59-94.
Charnes, A., Cooper, W. W., & Rhodes, E. (1978). Measuring the efficiency of decision making units. European Journal of Operational Research, 2(6), 429-444.
Chebil, A., Abbas, K., & Frija, A. (2013). Irrigation water use efficiency in central Tunisian’s wheat production system: A stochastic data envelopment approach. Paper presented at the 4th International Conference of the African Association of Agricultural Economists (22-25 September 2013). Hammamet, Tunisia.
Chen, T. (2002). A comparison of chance-constrained DEA and stochastic frontier analysis: bank efficiency in Taiwan. Journal of the Operational Research Society, 53(5), 492-500.
Chortareas, G. E., Girardone, C., & Garza-Garcia, J. G. (2010). Banking Sector Performance in Some Latin American Countries: Market Power versus Efficiency. Working Paper No. 2010-20. Mexico, Mexico D. F.: Banco de México. Retrieved 23 March 2014 from
http://www.banxico.org.mx/publicaciones-y-discursos/publicaciones/documentos-de-investigacion/banxico/%7B85A22835-4272-F218-10F8-412344010F8B%7D.pdf
Cook, W. D., Tone, K., & Zhu, J. (2014). Data envelopment analysis: prior to choosing a model. Omega: The International Journal of Management Science, 44, 1–4.
Cooper, W. W., Huang, Z., & Li, S. (1996). Satisfying DEA models under chance constraints. Annals of Operations Research, 66(4), 279-295.
Cooper, W. W., Deng, H., Huang, Z., & Li, S. X. (2002). Chance constrained programming approaches to technical efficiencies and inefficiencies in stochastic data envelopment analysis. Journal of the Operational Research Society, 53, 1347–1356.
Cooper, W. W., Deng, H., Huang, Z., & Li, S. X. (2004). Chance constrained programming approaches to congestion in stochastic data envelopment analysis. European Journal of Operational Research, 155(2), 487–501.
Cooper, W. W., Huang, Z. M., Lelas, V., Li, S. X., & Olesen, O. B. (1998). Chance constrained programming formulations for stochastic characterizations of efficiency and dominance in DEA. Journal of Productivity Analysis, 9(1), 53-79.
Cooper, W. W., Seiford, L. M., & Tone, K. (2007). Data envelopment analysis: a comprehensive text with models, applications, references and DEA-solver software (2nd ed.). New York, NY: Springer.
Debreu, G. (1951). The coefficient of resource utilization. Econometrica, 19, 273-292.
Dyson, R. G, Allen, R., Camanho, A., Podinovski, V., Sarrico, C., & Shale, E. (2001). Pitfalls and protocols in DEA. European Journal of Operational Research, 132(2), 245-259.
Efron, B. (1987). Better bootstrap confidence intervals. Journal of the American Statistical Association, 82(397), 171-185.
Farrell, M. J. (1957). The measurement of productive efficiency. Journal of the Royal Statistical Society: Series A, 120(3), 253-290.
Fethi, D. M., & Pasiouras, F. (2010). Assessing bank efficiency and performance with operational research and artificial intelligent techniques: a survey. European Journal of Operational Research, 204(2), 189-198.
Forster, J., & Shaffer, S. (2005). Bank efficiency in Latin America. Applied Economics Letters, 12(9), 529-532.
Friedman, L., & Sinuany-Stern, Z. (1998). Combining ranking scales and selecting variables in the DEA context: The case of industrial branches. Computers and Operations Research, 25(9), 781-791.
Fu, X., & Heffernan, S. (2007). Cost x-efficiency in China’s banking sector. China Economic Review, 18, 35–53.
Fuentes, R., & Vergara, M. (2007). Is Ownership Structure a Determinant of Bank Efficiency? Working Paper No. 456. Santiago de Chile, Chile: Central Bank of Chile. Retrieved 23 March 2014 from http://www.bcentral.cl/estudios/documentos-trabajo/pdf/dtbc456.pdf Golany, B., & Roll, Y. (1989). An application procedure for DEA. Omega: The International
Journal of Management Science, 17(3), 237–250.
Gong, B. H., & Sickles, R. C. (1992). Finite sample evidence on the performance of stochastic frontiers and data envelopment analysis using panel data. Journal of Econometrics, 51, 259-284.
Greene, W. H. (1993). Frontier Production Functions, EC-93-20. New York, NY: Stern School of Business, New York University.
Grosskopf, S. (1986). The role of the reference technology in measuring efficiency. The Economic Journal, 9, 499-513.
Grosskopf, S. (1996). Statistical inference and nonparametric efficiency: a selective survey. Journal of Productivity Analysis, 7, 161-176.
Guerrero, R., & Negrin, J. L. (2005). Efficiency of the Mexican Banking System 1997-2004: A Dynamic Estimation. Mexico, Mexico D. F.: Banco de Mexico.
Homburg, C. (2001). Using data envelopment analysis to benchmark activities. International Journal of Production Economics, 73(1), 51–58.
Horace, W. C., & Schmidt, P. (1996). Confidence statements for efficiency estimates from stochastic frontier models. Journal of Productivity Analysis, 7, 257-282.
Humphrey, D. B. (1985). Costs and scale economies in bank intermediation. In R. C. Aspinwall, & R. A. Eisenbeis (Eds.), Handbook for Banking Strategy (pp. 745-783). New York, NY: John Wiley and Sons.
Hurwicz, L. (1951). Optimality criteria for decision making under ignorance. Cowles Commission Discussion Paper. Chicago.
Jaffry, S., Ghulam, Y., & Cox, J. (2013). Trends in efficiency in response to regulatory reforms: the case of Indian and Pakistani commercial banks. Journal of Operational Research, 226, 122–131.
Kall, P. (1976). Stochastic Linear Programming. Berlin, Germany: Springer Verlag.
Kao, C., & Liu, S. (2004). Predicting bank performance with financial forecasts: a case of Taiwan commercial banks. Journal of Banking and Finance, 28(10), 2353-2368.
Kumar, M., & Charles, V. (2011). Benchmarking Indian banks using DEA in post-reform period: a progressive time-weighted mean approach. Service Industries Journal, 31(14), 2455-2485. Kumar, M., Charles, V., & Mishra, C. S. (2016). Evaluating the performance of Indian banking
sector using DEA during post-reform and global financial crisis. Journal of Business Economics and Management, 17(1), 156-172.
Land, K. C., Lovell, C. A. K., & Thore, S. (1993). Chance constrained data envelopment analysis. Managerial and Decision Economics, 14(6), 541–554.
León, C. J. (1999). Cost Efficiency of Commercial Banks in Mexico: An Application of a Nonparametric Approximation to DEA (Memo). Columbus, OH: Ohio State University. Li, S. X. (1998). Stochastic models and variable return to scales in data envelopment analysis.
European Journal of Operations Research, 104(3), 532-548.
Liu, B. (1997). Dependent-chance programming: a class of stochastic programming. Computers and Mathematics with Applications, 34(12), 89-104.
Liu, J. S., Lu, L. Y. Y., Lu, W. M., & Lin, B. J. Y. (2013). A survey of DEA applications. Omega: The International Journal of Management Science, 41, 893-902.
Micco, A., & Panizza, U. (2004). Foreign Banks: May the Host Country Win. Washington, Washington D. C.: Interamerican Development Bank.
Miller, S M., Clauretie, T. M., & Springer, T. M. (2005). Economies of Scale and Cost Efficiencies: A Panel-Data Stochastic-Frontier Analysis of Real Estate Investment Trusts. Working Paper 2005-21, University of Connecticut. Retrieved from http://digitalcommons.uconn.edu/cgi/viewcontent.cgi?article=1068&context=econ_wpaper Nunamaker, T. R. (1985). Using data envelopment analysis to measure the efficiency of
non-profit organizations: A critical evaluation. Managerial and Decision Economics, 6(1), 50– 58.
Olesen, O. B. (2006). Comparing and combining two approaches for chance constrained DEA. Journal of Productivity Analysis, 26(2), 103-119.
Olesen, O. B., & Petersen, N. C. (1995). Chance constrained efficiency evaluation. Management Science, 41(3), 442–457.
Olesen, O., & Petersen, N. (2016). Stochastic Data Envelopment Analysis – A review. European Journal of Operational Research, 251, 2-21.
Ondrich, J., & Ruggiero, J. (2001). Efficiency measurement in the stochastic frontier model. European Journal of Operational Research, 129(2), 434-442.
Post, T. (2007). Nonparametric efficiency estimation in stochastic environments: noise-to-signal estimation, finite sample performance and hypothesis testing. Journal of Banking & Finance, 31(7), 2065-2080.
Quispe-Agnoli, M., & McQuerry, E. (2001). Measuring financial liberalization in Latin America: An index of banking activity. Paper presented at the 2001 Domestic and Global Capital in Latin America Conference (1-2 November 2001). Latin America Research Group, Federal Reserve Bank of Atlanta, Miami, Florida.
Raab, R., & Lichty, R. (2002). Identifying sub-areas that comprise a greater metropolitan area: The criterion of country relative efficiency. Journal of Regional Science, 42(3), 579–594. Ram Mohan, T. T., & Ray, S. C. (2004). Productivity Growth and Efficiency in Indian Banking:
A Comparison of Public, Private, and Foreign Banks. Storrs, CT: Department of Economics, University of Connecticut.
Retzlaff-Roberts, D. L., & Morey, R. C. (1993). A goal programming method of stochastic allocative data envelopment analysis. European Journal of Operational Research, 71, 379-397.
Rivas, A., Ozuna, T., & Policastro, F. (2006). Does the use of derivatives increase bank efficiency? Evidence from Latin American banks. International Business & Economics Research Journal, 5(11), 47-56.
Rubinstein, R. Y. (1981). Simulation and Monte Carlo method. New York, NY: John Wiley & Sons.
Sathye, M. (2003). Efficiency of banks in a developing economy: the case of India. European Journal of Operational Research, 148(3), 662-671.
Schmidt, P. (1985). Frontier production functions. Econometric Reviews, 4(2), 289-328.
Sealey Jr., C. W., & Lindley, J. T. (1977). Inputs, outputs, and a theory of production and cost at depository financial institutions. The Journal of Finance, 32(4), 1251-1266.
Seiford, L. M., & Thrall, R. M. (1990). Recent developments in DEA: the mathematical programming approach to frontier analysis. Journal of Econometrics, 46(1-2), 7-38.
Sengupta, J. K. (1982). Efficiency measurement in stochastic input–output systems. International Journal of Systems Science, 13(3), 273–287.
Sengupta, J. K. (1987). Data envelopment analysis for efficiency measurement in the stochastic case. Computers & Operations Research, 14, 117-129.
Shephard, R. W. (1953). Cost and Production Functions. Princeton, NJ: Princeton University Press.
Simar, L. (1996). Aspects of statistical analysis in DEA-type frontier models. Journal of Productivity Analysis, 7, 175-185.
Simar, L., & Wilson, P. W. (1998). Sensitivity analysis of efficiency scores: how to bootstrap in nonparametric frontier models. Management Science, 44(1), 49-61.
Simon, H. A. (1957). Models of Man, Social and Rational. New York, NY: John Wiley & Sons. Smith, P. (1997). Model misspecification in data envelopment analysis. Annals of Operations