ScholarWorks
ScholarWorks
Educational Technology Faculty Publications
and Presentations
Department of Educational Technology
2020
An Integrated Framework Based on Latent Variational
An Integrated Framework Based on Latent Variational
Autoencoder for Providing Early Warning of At-Risk Students
Autoencoder for Providing Early Warning of At-Risk Students
Xu Du
Central China Normal University
Juan Yang
Central China Normal University
Jui-Long Hung
Boise State University, [email protected]
Follow this and additional works at: https://scholarworks.boisestate.edu/edtech_facpubs
Part of the Instructional Media Design Commons
Publication Information
Publication Information
Du, Xu; Yang, Juan; and Hung, Jui-Long. (2020). "An Integrated Framework Based on Latent Variational Autoencoder for Providing Early Warning of At-Risk Students". IEEE Access, 8, 10110-10122.
An Integrated Framework Based on Latent
Variational Autoencoder for Providing
Early Warning of At-Risk Students
XU DU 1, (Senior Member, IEEE), JUAN YANG 1, AND JUI-LONG HUNG 2,3
1National Engineering Research Center for E-Learning, Central China Normal University, Wuhan 430079, China 2Department of Educational Technology, Boise State University, Boise, ID 83725, USA
3National Engineering Laboratory for Educational Big Data, Central China Normal University, Wuhan 430079, China
Corresponding author: Juan Yang ([email protected])
This work was supported by the National Natural Science Foundation of China under Grant 61877027.
ABSTRACT The rapid development of learning technologies has enabled online learning paradigm to gain great popularity in both high education and K-12, which makes the prediction of student performance become one of the most popular research topics in education. However, the traditional prediction algorithms are originally designed for balanced dataset, while the educational dataset typically belongs to highly imbalanced dataset, which makes it more difficult to accurately identify the at-risk students. In order to solve this dilemma, this study proposes an integrated framework (LVAEPre) based on latent variational autoencoder (LVAE) with deep neural network (DNN) to alleviate the imbalanced distribution of educational dataset and further to provide early warning of at-risk students. Specifically, with the characteristics of educational data in mind, LVAE mainly aims to learn latent distribution of at-risk students and to generate at-risk samples for the purpose of obtaining a balanced dataset. DNN is to perform final performance prediction. Extensive experiments based on the collected K-12 dataset show that LVAEPre can effectively handle the imbalanced education dataset and provide much better and more stable prediction results than baseline methods in terms of accuracy andF1.5score. The comparison of t-SNE visualization results further
confirms the advantage of LVAE in dealing with imbalanced issue in educational dataset. Finally, through the identification of the significant predictors of LVAEPre in the experimental dataset, some suggestions for designing pedagogical interventions are put forward.
INDEX TERMS Performance prediction, early warning prediction, latent variational autoencoder, resam-pling methods, deep neural network, t-SNE.
I. INTRODUCTION
Technology innovation is reforming the world at an astonish-ing speed, includastonish-ing the field of education. The rapid devel-opment of learning technologies has enabled online education to gain great popularity. According to a report about enroll-ments in higher education in 2018, more than 6.3 million students in the United States took at least one online course [1]. In addition, the NMC horizon report also stated that online learning had experienced a significant growth surge and more than 2.7 million American K-12 students chose to take online courses [2]. Although the enrollments of online learning continue to increase in these years, online learning
The associate editor coordinating the review of this manuscript and approving it for publication was Xiao-Sheng Si .
institutions or platforms also face a more serious challenge of high dropout ratio than their traditional counterparts [3]. Therefore, the major concern of online education’s adminis-trators and instructors is how to provide in-time interventions for improving this dilemma.
Thanks to the capability of online learning systems to track and store students’ online activities, a feasible way to tackle the above issues is to get deep insights by analyzing the logs of online courses and then constructing the models for supporting instruction-related decision-making, which has attracted many research efforts [4]–[6]. Performance predic-tion or early warning predicpredic-tion is one of the most important and interesting research topics among them [7], [8]. However, there are still some research gaps in performance prediction that remain unanswered.
Learning performance prediction is fundamentally a classi-fication problem. It usually utilizes online learning activities (i.e. online behaviors or/and discussions) and classification algorithms to fulfill such tasks [6], [9]–[16]. However, tradi-tional classification algorithms, which are normally designed to maximize the overall accuracy, are suitable for balanced datasets rather than imbalanced ones [17], [18], while edu-cational dataset is often highly imbalanced [18], [19]. Imbal-anced dataset means the target cases are only a very small portion in the population compared with the non-target cases, which usually results in poor prediction since the minority category is almost inundated [17], [18]. For example, for an imbalanced dataset with a 5% at-risk rate, if a model simply predicts all students as successful students, the model can also reach a 0.95 accuracy rate. However, the model failed to identify any at-risk students. Therefore, it is very critical to focus on the imbalanced issue for improving prediction performance of the minority class.
To avoid being inundated, specific strategies have been proposed to deal with such imbalanced classification tasks [20]. The typical resampling approaches include Random Under Sampling (RUS), Random Over Sampling (ROS), and Synthetic Minority Oversampling Technique (SMOTE) [22], [23]. However, these methods have many shortcomings in dealing with imbalanced classification problems [22], [23]. RUS suffers from information loss due to the random deletion of the majority class, and ROS may result in overfitting on the minority class, while SMOTE may increase the overlap-ping between classes [23]. These resampling methods may increase false positive cases, which is a big issue in education and should be avoided for the following two reasons: (1) Inaccurate predictions result in a heavy burden for instructor’s interventions and poor intervention outcomes; (2) High false positive ratio represents labeling on-the-track students with at-risk, which may rise many unnecessary concerns from educators and parents.
In recent years, with the rapid development of deep learn-ing techniques, several generative models, includlearn-ing vari-ational autoencoder (VAE) and generative adversarial nets (GAN), have been developed in order to generate new data that are similar to those in the original dataset in the field of computer science [24], [25]. These generative approaches may provide new perspectives for solving the imbalanced issue in many fields. However, such efforts are still at the early adoption stage in educational research.
It is reported that students with different characteristics (such as prior knowledge, demographics, personality traits, engagements or efforts in online education) can achieve dif-ferent learning performance [6], [14], [15]. This indicates that each student can be characterized with a set of features. Dif-ferent combinations of the features represent difDif-ferent types of students. Therefore, it is a promising approach to identify the at-risk students by learning the latent feature distributions of those students. Both VAE and GAN can be used to address the imbalanced issue by capturing the latent distribution of data. It is known that GAN is originally designed based on the
concepts of zero-sum game and adversarial training between the generator G and the discriminator D. Many enhanced variations, such as Conditional GAN (CGAN) and Wasser-stein GAN (WGAN), soon emerged subsequently [26], [27]. However, GAN has several concerns, including unstable con-vergence, collapse problem and uncontrollable model. There-fore, this study is mainly based on the idea of VAE rather than that of GAN.
As stated earlier, different combinations of features rep-resent different types of students. Therefore, it is possible to identify the at-risk students by learning the latent feature distributions of those kind of students. The distribution of at-risk students can be represented as a probability distribution. According to the Gaussian Mixture model (GMM) [28], any distribution can be represented by an infinite dimensional Gaussian distribution [29]. Accordingly, the probability dis-tribution that denotes the latent feature of at-risk students can be further represented by a GMM. The analysis of the feature distribution of at-risk students is transformed to the estima-tion of the composiestima-tions of Gaussian components (i.e. a set of mean and variance vectors). The ideal compositions that were computed based on the theories of GMM and Bayesian probability should be as close as possible to the actual distri-bution. Then sampling mean and variance vectors from this approximation distribution can generate valid at-risk samples. The above description is similar to variational autoencoder (VAE) [24], but this study considers the latent relationships of student characteristics for learning stable latent Gaussian distributions and further generating valid at-risk samples. Therefore, the sampling component in this study is called latent variational autoencoder (LVAE).
Finally, an integrated student performance prediction framework (LVAEPre) is proposed based on LVAE in this study. This framework takes advantage of LVAE and deep neural network (DNN) in order to alleviate the imbalanced distributions of educational dataset and further provide early warning prediction of at-risk students. Specifically, LVAE component mainly aims to learn the latent feature distribu-tion of at-risk students and generate some at-risk samples for the purpose of obtaining a balanced dataset. Due to the outstanding prediction performance of DNN [16], [30], it has been applied to perform final prediction in order to explore whether the latent feature distribution of at-risk students learnt by LVAE component is helpful for accurately identify-ing and capturidentify-ing at-risk students. Finally, the effectiveness and robustness of the proposed LVAEPre framework are ver-ified through multiple sets of experiments.
The main contributions of this study are threefold: 1. This study shows that estimating the latent feature distri-bution of at-risk students is the most important for generating valid at-risk samples. The visualizations of the resampling results based on t-distributed stochastic neighboring ensem-ble (t-SNE) have shown that LVAE is an efficient approach to deal with imbalanced education data.
2. This study proposes an integrated framework (LVAEPre) for dealing with imbalanced classification in education.
An imbalanced education dataset was collected and analyzed. The experimental results have indicated that the proposed framework has good generalization ability and robustness for capturing at-risk students.
3. Four significant predictors of LVAEPre in this specific K-12 dataset have been identified via the surrogate modelling approach. It could provide meaningful insights for instructors to design pedagogical interventions.
The remaining is organized as follows: Section 2 reviews the most related literature about early warning prediction and imbalanced classification problems. Section 3 describes the proposed framework (LVAEPre) in detail. Experimental results based on the collected dataset are presented and dis-cussed in section 4. Finally, section 5 outlines the conclusion and future work.
II. RELATED WORKS
A. EARLY WARNING PREDICTION
Early warning prediction studies should provide accurate prediction outcomes at an early stage. However, the pre-vious study [16] pointed that most performance prediction studies utilized aggregated behaviors at the end of semester for predictive modelling. Given that the accumulation levels are different during and at the end of the course, utilizing student accumulated behavioral frequencies at the end of a course cannot perform real prediction to achieve the goal of ‘‘early warning’’. These studies are more likely to identify key factors rather than performance prediction. Therefore, we just focused on analyzing and reporting results of the early warning studies in the following subsections.
1) ADOPTED INPUT VARIABLES
In terms of input variables, some early warning studies adopted static variables to predict performance [31]–[34]. Static data usually include student demographics, self-report data and historical educational records, which do not update or change values frequently. Because static data can be gathered before a course or semester starts, it is a popular approach to construct an early warning model based on static data in order to provide the instructor with a list of poten-tially at-risk students before a course starts. These studies identified at-risk factors related to social economic status [31], [32], historical academic records [33], [34], and gender [31]. However, it is known that the use of static variables ignored student’s actual efforts in the course. Therefore, pre-diction models based on static data cannot provide accurate predictions.
In recent years, with the popularity of online learning, many researchers adopted online learning activities (i.e. online behaviors or discussions) for early warning prediction [6], [9]–[16]. These studies extracted variables from online learning activities for modelling, including total frequency or time spent in the Learning Management System, frequency of the content accessed, frequency of the discussions posted, frequency of the grade checked, numbers of files received
and viewed, the number of assignments completed and textual features [6], [9]–[16]. Some studies also reported significant predictors, including total time spent on LMS [14], total frequencies [15], number of postings [6], and discussion board visit frequency [6], [14]. This indicates that there are significant differences between successful and at-risk students in these significant activities. Therefore, collecting online learning logs is a feasible solution to reflect students’ learning process and efforts. Furthermore, the distribution of significant features of at-risk students is different from that of successful students.
2) EVALUATION METRICS
Many early warning studies adopted indicators for evaluating overall performance, such as accuracy, Root Mean Square Error (RMSE)), MAE (Mean Absolute Error), and AIC (Akaike information criterion) [34]–[36]. However, since the goal is to identify potentially at-risk students, indicators like recall, F-measure, and ROC (Receiver Operating Character-istic) are more appropriate. Literature [32] collected students personal and social factors to predict academic performance, but experimental results showed that four different prediction models all gained less than 40% overall accuracy. Literature [37] reported that prediction models had serious overfitting and gained less than 70% accuracy on the testing data. These models might need to be further improved as they provided many false early warning signals and missed a large portion of actual at-risk students. Without considering the imbalanced characteristic of educational dataset, it may be challenging to achieve a satisfactory prediction performance. Therefore, it is necessary to select appropriate indicators to evaluate model’s prediction performance in imbalanced education dataset.
3) PREDICTION METHODS
It is found that the majority of early warning studies have applied traditional machine learning algorithms, such as Regression, Decision Tree, Naïve Bayes, Support Vector Machine, Neural Network, K-nearest neighbor and Ran-dom Forest, for constructing performance prediction mod-els [6], [9]–[15].
On the other hand, Deep learning, as a promising branch of machine learning, has been widely used in audio recog-nition [38], image classification [39], and e-commerce rec-ommendations [40]. However, deep learning is relatively new to educational research. For example, RNN was adopted for knowledge tracing in intelligent tutoring systems [41]–[43]; CNN was applied for extracting textual features of learning resources for content-based recommendation [44]; DNN was employed for predicting performance and the results indi-cated that DNN models outperformed traditional machine learning algorithms in terms of the capability of identify-ing at-risk students [16].These studies have shown the great potential of deep learning in outperforming other machine learning algorithms. Therefore, it is promising to construct prediction models based on DNN in order to improve predic-tion performance.
B. IMBALANCED CLASSIFICATION PROBLEMS
When predicting academic performance or dropout, the col-lected education data, which often belongs to imbalanced dataset, can certainly result in imbalanced classification prob-lems. Given an imbalanced education dataset consisting of N samples (i.e. students): D ={(xi, Ci), i∈[1, N]}, where
xi denotes the input features of the ith student, and each
student has a corresponding class information CiCi. In this
study, we consider the early warning prediction problem as a binary classification issue (i.e.C={0, 1}), and assume the negative (positive) class to be the majority (minority) class. In many educational cases, the number of negative samples is much larger than the number of positive samples. If a prediction model just simply classifies all the samples as the majority class, it may still obtain high overall classification accuracy [22]. However, the model has no practical applica-tion value.
To date, many research efforts have been focused on addressing the imbalanced classification problems at the data level [20]. It was called ‘resampling’. The basic idea is to resample either the majority class or the minority class in order to obtain relatively balanced distributions among classes. RUS and ROS are two widely used resampling meth-ods [20]. RUS is to randomly delete the majority samples in order to balance the distributions of the two classes. In con-trast, ROS is to randomly select samples from the minority class and to duplicate the selected samples to achieve a balance. Many researchers have pointed out that these two random resampling methods are not good solutions for imbal-anced classification problems, because RUS suffers from information loss due to the random deletion of the majority class, while ROS may result in overfitting on the minority class [22], [23]. SMOTE as an improved method of ROS ran-domly creates artificial samples along a line joining a minor-ity sample and a selected nearest neighbor [45]. However, SMOTE can significantly increase the overlapping between classes that makes classification more difficult [22].
Considering that the ensemble techniques can improve the classification performance of any weak classifier, several advanced ensemble-based methods (such as SMOTEBoost and RUSBoost) have been proposed for addressing the above issues of random-based methods [23], [45]. SMOTEBoost combines the SMOTE and the standard boosting procedure to improve the classification performance on the minority sam-ples by increasing weights of misclassified minority samsam-ples [45]. The RUSBoost is very similar to the SMOTEBoost, but the only difference is the method to alleviate the distributions of imbalanced dataset. In other words, RUSBoost applies RUS, which randomly removes samples from the majority class [23]. Therefore, RUSBoost decreases the size of the training set, while SMOTEBoost increases the size of the training set [23], [45]. The experimental results indicated that SMOTEBoost and RUSBoost performed better than AdaBoost, RUS and SMOTE in handling imbalanced data [23]. Although the above ensemble methods (i.e. SMOTE-Boost and RUSSMOTE-Boost) have been proposed for a long time,
there are few applications and discussions in the field of education, in which imbalanced dataset is quite common.
C. SUMMARY
The literature reveals that: (1) Most performance prediction studies are more likely to identify important factors rather than to perform early warning. (2) Without considering the imbalanced characteristic of educational dataset, it may be challenging to achieve a satisfactory prediction performance in the predictive model. (3) Many early warning studies have adopted biased indicators to evaluate model’s performance. (4) Deep learning has shown great potentials for improving prediction ability. (5) Although there are many traditional resampling methods to adjust the distributions of imbalanced data, few studies have focused on whether these methods can work well in the field of education.
In this study, an integrated framework (LVAEPre) is proposed in order to address the above research gaps. This framework aims at adjusting the distribu-tions of imbalanced education data, constructing early warning prediction model and providing early warning predictions.
III. THE PROPOSED LVAEPre FRAMEWORK
This section begins with an overview of the proposed frame-work (LVAEPre) and then focuses on introducing each com-ponent in detail.
A. THE OVERVIEW OF LVAEPre
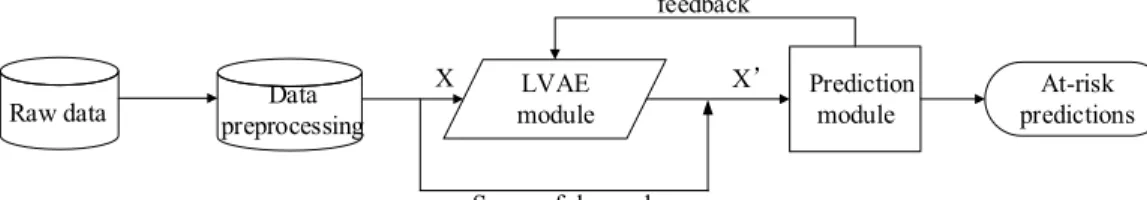
The architecture of LVAEPre is shown as Figure 1, which consists of three components, including data preprocessing, LVAE component and prediction method. The data pre-processing component is responsible for transforming the raw logs into appropriate data forms for subsequent mod-elling and analysis. Then LVAE component generates at-risk samples based on the latent feature distribution of at-risk students. Finally, DNN algorithm is employed to construct the prediction model for providing early warning of at-risk students.
Ideally, the prediction results need to be fed back to the LVAE module to adjust its parameters for better prediction. However, this paper just focuses on the prediction perfor-mance based on LAVE, so the feedback part will be further studied in the future work.
B. DATA PREPROCESSING
Firstly, a unique ID that combines student ID and course ID are used to link all types of data sources (such as grade data, behavioral data and discussions) together to complete data log cleaning. Secondly, it is critical to find a possible way to generate behavioral features based on the log data. Consider-ing that different courses and even the same course designed by different instructors may have different learning activity designs and requirements, extracting candidate learning fea-tures based on the statistics of learning activity categories in the raw logs is recommended in order to avoid extremely
FIGURE 1. The overview of the proposed LVAEPre framework.
sparse data. In addition, it is difficult to find a generalized threshold for specific learning activity under this concern. For example, one student in class A had accessed the learning system 100 times, which was a very high engagement in this class. Another student in class B had also accessed 100 times, but he did not meet the requirement of his class. Therefore, this adopts a modified normalization method by normalizing the values of student’s learning behaviors into 0-1 within each course in order to address these concerns. It takes into account the characteristics of educational data to make the participa-tion levels of different courses comparable, so the proposed transformation method is more appropriate for educational data.
C. RESAMPLING MECHANISM OF LVAE COMPONENT
Assume the dataset consists of N i.i.d. samples of at-risk students(x1,x2, . . . ,xN), and the studentnis represented by a
K-dimensional vector xn1,xn2, . . . ,xnK, which includes prior knowledge, demographics, personality traits, online learning behaviors, textual information extracted from online discus-sions and other information. The latent features behind the distribution of variables in each vector implicates the stu-dent’s intrinsic characters as well as his/her learning process and status.
Considering that a given distribution can be synthe-sized by an infinite dimensional Gaussian distribution [29], we assume that the feature distribution of the at-risk stu-dents p(x) is represented by a Gaussian Mixture model shown as p(x)=X z p(z)p(x|z)= Z p(z)p(x|z)dz (1)
wherez is a vector sampled from a latent space following a standard normal distribution. The conditional distribution
p(x|z) is also a Gaussian distribution with mean µ(z) and varianceσ(z). Accordingly,p(z) represents the weight of dis-tributionp(x|z).
We hope the generated cases have the same latent features as the samples in the dataset, in other words, the distribu-tion of the generated cases is same as that of the original at-risk samples. Therefore, thep(x|z) should maximize the probabilityp(x)of each sample in the dataset. Considering the encoder, we assume that q(z|x) can be any distribution and is independent ofp(x), so logp(x) can be rewritten as
equation (2). logp(x) = Z z q(z|x) logp(x)dz = Z z q(z|x) log p(x,z) q(z|x) dz+ Z z q(z|x) log(q(z|x) p(z|x))dz (2) The second item in equation (2) denotes the KL divergence betweenq(z|x) andp(z|x), which is always greater than or equal to 0. The first item in equation (2) is the variational lower bound Lb. Therefore, logp(x) can be rewritten as
equation (3).
logp(x)=Lb+KL(q(z|x)||p(z|x)) (3)
When the approximate distributionq(z|x) is close to the real distributionp(z|x), logp(x) is also close to Lb.
Mean-while,Lbcan be rewritten as equation (4).
Lb = Z z q(z|x) log p(z) q(z|x) dz+ Z z q(z|x) log(p(x|z))dz = −KL(q(z|x)||p(z))+Eq(z|x)(logp(x|z)) (4)
It is obvious that when the distribution q(z|x) is also a standard normal distribution (i.e. the KL divergence is equal to 0), Lb can obtain its maximum Eq(z|x)(logp(x|z)). This
means when given an at-risk samplex, we need to sample
zfrom the distributionq(z|x), which makes the reconstructed
x similar to the originalx (i.e. maximizing the probability ofp(x|z) ).
In summary, LVAE component aims to learn the optimal latent Gaussian distribution q(z|x) based on the given at-risk samples, which is the encoder network. Assuming zmean
and zvar denote the mean vector and variance vector of the
distributionq(z|x), latent vector z that is sampled from the distributionq(z|x) can be represented as equation (5).
z=zmean+zlogvarε (5)
whereεis sampled from a standard normal distribution. Then maximizingp(x|z) based on the latent vectors z is necessary in order to make the reconstructed at-risk sample as similar as possible to the original at-risk sample, which is the decoder network in LVAE.
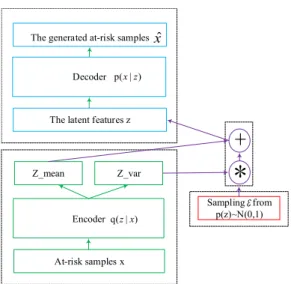
The architecture of LVAE is shown in Figure 2. Compared with the high dimensions of pictures in the field of computer science, educational data has relatively low dimensions of
FIGURE 2. The architecture of resampling network in LVAE component.
input features. In this study, both the encoder and decoder networks just have one hidden layer respectively.
D. PREDICTION METHOD
Literature review indicates that few studies have employed deep learning algorithms for early warning prediction, but deep learning shows great potential than traditional counterparts. This study adopts full-connected deep neu-ral network (DNN) as prediction method in the LVAEPre framework. In this study, DNN has three hidden layers with dropout and L2 regularization, but the optimal parameters of the DNN architecture need to be determined in the training process.
Therefore, the proposed LVAEPre framework uses the data processed by LVAE to train the prediction model based on DNN in order to achieve more accurate identification for at-risk students. The trained prediction model needs to be verified on the validation dataset with original imbalanced ratio to demonstrate the generalization ability of the LVAEPre framework.
IV. EXPERIMENTS AND RESULTS
In this section, several experiments have been carried out based on a collected education dataset with 8.7% at-risk ratio to verify the effectiveness and robustness of the proposed LVAEPre framework. The visualizations of different resam-pling results based on t-SNE have also been compared to further demonstrate the advantage of LVAE in dealing with imbalanced education data. Therefore, the baseline methods, evaluation metrics and data description are introduced first. Then the experimental results are reported and discussed in detail.
A. BASELINE METHODS
LVAEPre mainly consists of LVAE and DNN. LVAE com-ponent aims to fulfill the resampling task based on the latent feature distribution of at-risk students, and DNN is to
perform the binary classification task. Therefore, the bench-mark methods need to be selected from both resampling and prediction aspects to verify the effectiveness of the LVAEPre framework from multiple viewpoints.
SMOTE and RUS are the commonly used resampling methods in dealing with imbalanced classification problems. SMOTEBoost and RUSBoost are the combination of Boost-ing and resamplBoost-ing methods in recent years in order to address the issues of SMOTE and RUS [23], [45]. Although there are many variants of boosting, the most influential one is AdaBoost [46]. The basic idea of AdaBoost is to correct the mistakes of previous weak learners [46]. Suppose the first weak learnerh1is trained based on the training datasetD1,
then the error ofh1can be calculated. The error ofh1is used
to calculate the weight ofh1, and the distribution of training
dataset is updated toD2, which focuses on the mistakes of h1. Then a weak learnerh2is trained based onD2. AdaBoost
will continue to generate multiple weak learners and its corre-sponding weights until the termination condition is satisfied (such as error is less than the pre-set threshold or the numbers of weak learners have reached the pre-set numbers). On the other hand, Decision Tree (DT) is often selected as the best prediction model in performance prediction studies [6], [10]. Therefore, DT is chosen to train weak learners in AdaBoost in this study.
In order to provide a reference point for the results of the LVAEPre framework, multiple combinations of the above commonly used methods are employed to generate base-line methods in order to demonstrate the effectiveness of LVAEPre from multiple viewpoints. First, using DT and DNN without any resampling methods to generate the initial base-line results is to verify whether the resampling methods and LVAE are beneficial to the improvement of prediction per-formance. Then the performance of the proposed LVAEPre is compared with that of baseline methods. The baseline methods include:
• SMOTE-DT: The resampled dataset that is generated
based on SMOTE is classified by DT classifier.
• SMOTEBoost: The resampled dataset that is generated based on SMOTE is classified by AdaBoost.
• SMOTE-DNN: The resampled dataset that is gener-ated based on SMOTE is classified by DNN.
• RUS-DT: The resampled dataset that is generated based on RUS is classified by DT classifier.
• RUSBoost: The resampled dataset that is generated
based on RUS is classified by AdaBoost.
• RUS-DNN: The resampled dataset that is
gener-ated based on RUS is classified by DNN.
• LVAE-DT: The resampled dataset that is generated
based on LVAE is classified by DT.
• LVAE-AdaBoost: The resampled dataset that is
gener-ated based on LVAE is classified by AdaBoost.
All the experimental results will be reported later based on the original validation dataset for the purpose of facilitating comparison and analysis.
B. METRICS FOR PERFORMANCE EVALUATION
Measuring the overall prediction accuracy is commonly used in performance prediction. However, the dataset for early warning prediction is typically imbalanced or highly imbal-anced. It is not appropriate to only use the overall accuracy to measure model’s prediction performance. Because if a model simply predicts all students as successful students, this model can obtain a high accuracy rate, but this result cannot make sense to provide early warning signals.
In addition, it is crucial to accurately identify the minority class without sacrificing the benefits of the majority class in imbalanced education dataset. Precision is the ratio of all predicted positive cases whose actual values are also positive, and recall is the ratio of positive students being captured by the model. In many classification tasks, high precision and high recall rates cannot be achieved at the same time. Therefore, F1.5 score is selected as a harmonic mean of
precision and recall [7]. In general, the high value of F1.5
score, the better the prediction performance of models.
accuracy= TP+TN TP+FP+TN+FN (6) precision= TP TP+FP (7) recall = TP TP+FN (8) F1.5 = 1+1.52TP 1+1.52 TP+1.52FN +FP (9)
where ‘‘positive’’ denotes at-risk student, and ‘‘negative’’ means successful student. True positive (TP) denotes that a student whose status is at-risk and the model also correctly predicts the student as at-risk. True negative (TN) indicates that a student whose status is successful and the model also correctly predicts the student as successful. False posi-tive (FP) means the number of successful students misjudged by the model (false early warning), and False negative (FN) is the number of at-risk students misjudged by the model (missed at-risk students).
In this study, both accuracy andF1.5values are used to
syn-thetically evaluate and compare models’ overall performance. Finally, all models are optimized by the validation results to avoid overfitting.
C. DATA DESCRIPTION
Data was collected from more than 600 fully online courses offered through a K-12 virtual school located in the United States. These courses were hosted on the Blackboard learn-ing management system (LMS) in the 2014-2015 and 2015-2016 academic years and lasted for 16 weeks. The major data sources included: (1) student behavioral data, (2) student discussion posts in the discussion forums, and (3) student final grades. First, the timing of the early warning prediction in this study was in the middle of the semester, so LMS logs that were recorded after 8thweek were removed. Then a unique ID combining student ID and course ID were
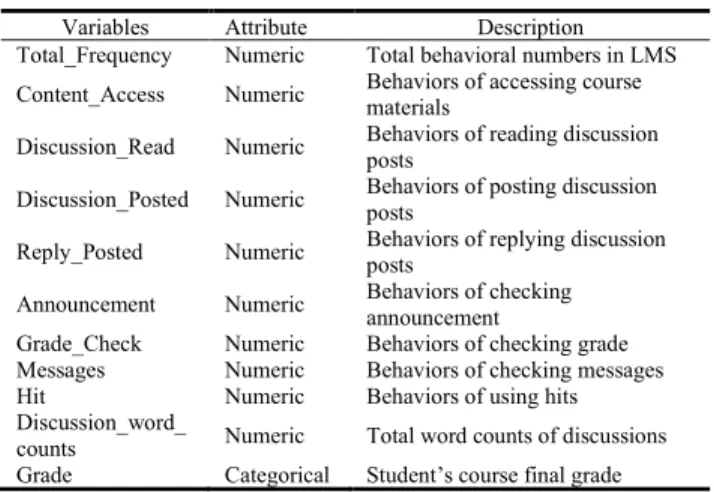
TABLE 1.The generated features from the raw data.
used to link all three types of data sources together, which preserved 11688 students with 10,329,074 behavioral logs and 164,745 discussion posts for analyzing and modelling. After data preprocessing, ten learning features were extracted from the raw logs, which indicates that each student could be represented by a 10-dimensional input vector. The generated features are shown in Table 1.
For early warning modelling, students’ final grades, which were originally stored in numeric format, need to be trans-formed into a binary format. This study selects 60 as the passing score to distinguish at-risk and successful students. At-risk students are labeled as ‘‘1’’ (positive), and success-ful students are labeled as ‘‘0’’ (negative). This threshold generates 8.72% at-risk students. It means the imbalanced ratio of the dataset is higher than 9. Based on the criteria of imbalanced datasets [47], the collected dataset is a highly imbalanced dataset, which makes it very difficult to correctly identify at-risk students. Therefore, the proposed LVAEPre framework are expected to address this imbalanced classifi-cation task.
Stratified sampling approach is employed to split dataset into the original training and validation datasets. It is gener-ally recommended that splitting 70% is for model training and the remaining is for validation [48], [49]. The original training dataset is used to train the LVAEPre framework, while the original validation dataset with 8.7% at-risk ratio is used to verify the effectiveness and robustness of the proposed framework.
D. EXPERIMENTAL RESULTS AND DISCUSSION
1) PREDICTION PERFORMANCE OF LVAEpre
After data preprocessing, the training dataset with 10-dimensional input features are fed into the LVAEPre frame-work and baseline methods for training prediction models. The validation results of baseline methods and LVAEPre are shown in Table 2. Among them, the criterion of DT classifier is Gini index, and the base classifier of AdaBoost is also DT with Gini index. The numbers of weak learners and learning rate in AdaBoost are optimized by grid search. The search range of numbers of weak learners is from 50 to 100 with
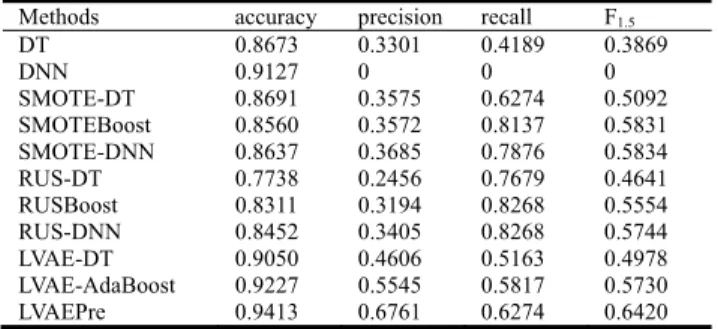
TABLE 2. Comparison of validation results between LVAEpre and baseline methods.
a step size of 10, and search range of learning rate is from 0.5 to 1.5 with a step size of 0.1. Then the optimal numbers of weak learners and leaning rate are 70 and 0.9 respectively. Similarly, the parameters of DNN are also determined by grid search, and the final architecture of DNN has three hidden layers with 100, 100 and 10 neurons respectively, and three dropout layers among hidden layers and output layer with 0.5, 0.5 and 0.7 dropout rates respectively to avoid overfitting.
Firstly, the results of the first two rows in Table 2 show that DT and DNN have poor prediction performance without LVAE or SMOTE or RUS to adjust the imbalanced distri-butions of the original training dataset, especially for DNN that cannot capture any at-risk students at the 8th week. The last nine rows in Table 2 are the validation results of baseline models and LVAEPre, which have employed LVAE or SMOTE or RUS approaches to alleviate the distributions of two classes. The F1.5 scores clearly indicate that both
traditional resampling methods and LVAE component are helpful for improving prediction performance of imbalanced education dataset. Therefore, adjusting the distributions of imbalanced education data can improve the prediction perfor-mance of the minority class. This finding is consistent with the previous study [9].
Then the prediction performance of different classifiers under the same resampling method is also compared. It is found that AdaBoost performs significantly better than DT when using the same resampling method. Based on the idea of AdaBoost, it is not surprising to this result. Many studies have also claimed that ensembled methods, such as AdaBoost and Random Forest, usually perform better and more robust than single classifier [16]. Furthermore, Table 2 shows that deep learning models perform slightly better than AdaBoost under the same data condition, which is line with previous findings [16], [30], [50]. It is concluded that DNN is a promis-ing method for buildpromis-ing prediction models than traditional machine learning algorithms in education.
Finally, it is found that LVAEPre has the most outstanding prediction performance in terms of the overall accuracy and
F1.5 score through comparing the results of the last nine
rows. This means the proposed LVAEPre framework can make an optimal tradeoff between the predictions of the two classes, so LVAEPre obtains the lowest misclassification rate and the relatively high recall rate as shown in Table 2.
Other methods that are based on SMOTE or RUS have high recall rates but extremely low precision rates. It indicates that these methods misclassify a high percentage of success-ful students to achieve high capability of capturing at-risk students.
Further examining the collected dataset, there are 1,020 at-risk students and 10,668 successful students. Take the SMOTE-DNN method as example, the recall rate is 0.7876 and the precision rate is 0.3685. That means 803 (1020∗0.7876) at-risk students can be captured by the model, and 2179 (803/0.3685) students were predicted as at-risk. In other words, 1376 (2179-803) successful students were misclassified as at-risk. Increasing false positive cases might not be a big issue in others fields, such as telephone marketing or mail marketing. Within the cost limit, the marketing cam-paign can focus on the population with the highest response rates to maximize profits. However, it could be a big issue in the field of education, since no one likes to be labeled as ‘‘at-risk’’, especially when he or she is on the right learning track. Furthermore, misclassifying too many successful stu-dents can also result in a very heavy burden for instructor’s interventions. These concerns certainly make models based on SMOTE or RUS difficult to implement in educational practice. Therefore, LVAEPre can not only effectively han-dle imbalanced education data, but also provide better early warning predictions than other baseline methods.
2) COMPARISON OF VISULIZATION RESULTS BASED ON DIFFERENT RESAMPLING APPRAOCHES
The above experiments show that the proposed LVAEPre framework performs better than other baseline methods. Since LVAEPre consists of LVAE and DNN, the out-standing performance of LVAEPre is also contributed by these two aspects. Given that the above experimental results have also indicated that DNN performs better than other traditional machine learning algorithms under the same data condition, the three resampling methods (i.e. LVAE, SMOTE and RUS) will be compared in order to reveal potential reasons for the outstanding performance of LVAEPre. These three resampling methods all aim to make a new balanced data based on the original imbal-anced data. Therefore, observing the visualization results of data distribution before and after resampling may be the most intuitive solution to compare different resampling methods.
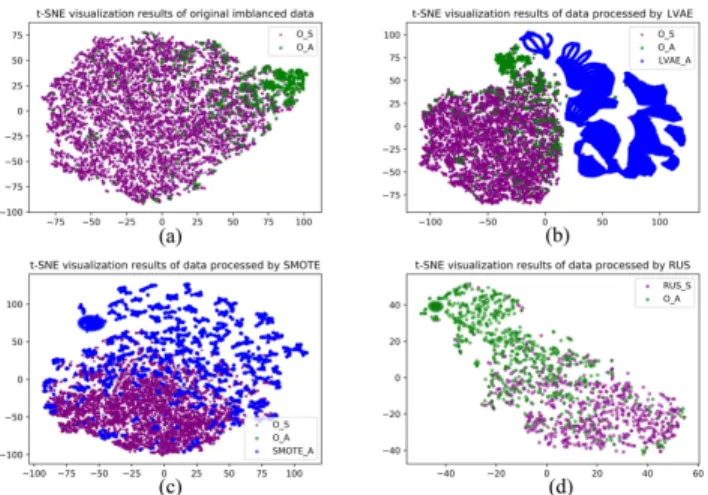
Because t-SNE is capable of capturing the local struc-ture of the high-dimensional data very well and revealing global structure such as the presence of clusters at several scales [51], it has been considered as a powerful visualiz-ing approach to preserve both global and local structures of data in low-dimensional space [52]. In this study,t-SNE is employed for presenting visualization results of training datasets under different resampling approaches. The visu-alization result of the original imbalanced training dataset with 8.7% at-risk rate is also presented as the benchmark. Figure 3 shows the comparison results.
FIGURE 3. The t-SNE visualization results of datasets under different resampling methods.
The symbols of ‘‘O_S’’, ‘‘O_S’’, ‘‘LVAE_A’’, ‘‘SMOTE_A’’ and ‘‘RUS_S’’ in Figure 3 denote the success-ful students in the original training dataset, the at-risk students in the original training dataset, the at-risk samples generated by LVAE, the at-risk samples generated by SMOTE, and the remaining successful students after resampling by RUS respectively.
Figure 3(a) not only shows the highly imbalanced charac-teristic of the original training dataset, but also indicates that there is no significant distribution difference between suc-cessful students and a small number of at-risk students. This means that it is extremely difficult to accurately capture at-risk students in the original imbalanced dataset. Figure 3(b-d) present the data distribution of the balanced training datasets that are generated based on LVAE, SMOTE and RUS respectively.
Firstly, Figure 3(b-c) shows that both LVAE and SMOTE can increase the whole sample size of training dataset via generating at-risk samples, but RUS significantly decreases the sample size as shown in Figure 3(d). This is consistent with the previous view in [23], [45]. Then, Figure 3(b) shows that LVAE has learnt the latent feature distribution of at-risk students very well and generated valid at-risk samples so that the two types of students have relatively obvious boundaries. However, Figure 3(c) shows that SMOTE results in a serious overlapping between two types of students, which make a great number of successful students very similar to at-risk students. Similarly, RUS randomly deletes a large number of successful samples in order to obtain a balanced dataset, but it also makes the difference between the two types of students less obvious. Therefore, the visualization results could explain (1) why prediction models based on SMOTE and RUS can misclassify lots of successful students as at-risk; and further explain (2) why prediction models based on SMOTE and RUS can achieve high abilities (i.e. high recall rates) in capturing at-risk students. In addition, because LVAE can generate a relatively clear boundary between two types of students, LVAEPre could achieve high recall rate without
increasing false positive cases. In general, LVAE is more promising than other resampling methods in education. It also reveals why LVAEPre outperforms other baseline models.
3) ROBUSTNESS OF LVAEpre
The results of Table 2 are based on the selected stratified splitting rule (i.e. 70% for training and 30% for validation). In order to verify whether the proposed LVAEPre framework has good robustness in providing stable prediction results under different training samples, another two sets of addi-tional experiments based on different splitting rules (i.e. 60%/40% and 80%/20%) were also carried out. Figure 4 visu-alizes the validation results of the LVAEPre framework and baseline methods in terms of four evaluation metrics under different splitting rules (i.e. different samples for training and validating LVAEPre).
Figure 4 shows that the proposed LVAEPre framework has good robustness on the different validation datasets, and LVAEPre outperforms other baseline methods under different splitting rules in terms of overall accuracy andF1.5 score.
In addition, Figure 4 also indicates that more training samples (i.e. 70% or 80% dataset for training) will make the advan-tages of LVAEPre framework more obvious, because more training samples will contain more at-risk students, which can make the latent probability distributions of at-risk students learnt by LVAE more accurate. Other findings in Figure 4 are consistent with that in Table 2. For example, using tradi-tional resampling methods or LVAE can improve model’s ability in capturing at-risk students, and DNN performs better than traditional machine learning algorithms under the same resampling method.
4) IDENTIFICATION OF SIGNIFICANT PREDICTORS
The above experimental results demonstrate the effectiveness and robustness of the proposed LVAEPre framework. How-ever, the prediction results of the LVAEPre framework are like a ‘‘black box’’, which cannot provide instructors with meaningful insights on how to design effective interventions. Therefore, this subsection seeks to open the ‘‘black box’’ via the surrogate modelling method, which is a commonly used approach to extract significant predictors of a complex model [53]. Due to the advantage of visualizing decision process, Decision Tree is often selected as the method of surrogate analysis to ‘‘simulate’’ rules that were learned by complex models. Therefore, the DT model in surrogate analysis kept the same input variables with LVAEPre, but the target vari-ables were the predicted results of LVAEPre. The DT model in surrogate analysis is able to simulate the LVAEPre results with 100% accuracy. Because the surrogate tree is also very deep and complex, only the top five layers are represented in Figure 5.
Figure 5 shows the most significant factors include ‘Total_Frequency’, ‘Discussion_word_counts’, ‘Check_ grade’ and ‘Hit_count’. To enhance readability, the major at-risk paths are reported in the following.
FIGURE 4. The validation results under different splitting rules.
FIGURE 5. The surrogate modelling results of LVAEPre.
• Rule 1-1: Total_Frequency<=0.061 (0/1: 0.476/0.524) • Rule 2-1: 1-1 + Discussion_word_counts <=0.197 (0/1: 0.2407/0.7593) • Rule 3-1: 1-1 +2-1+ Check_grade <= 0.173 (0/1: 0.105/0.895) • Rule 4-1: 1-1 +2-1+3-1 + Hit <= 0.359 (0/1: 0.0694/0.9306)
Rule 1-1 means if a student’s total frequency is in the lower 6.1% in the class, the at-risk probability increases from 7.47% to 52.40%. When Rule 1-1 is satisfied and the student’s discussion word counts are in the lower 19.7% in the class, the at-risk probability further increases to 75.93% (Rule 2-1). When both rules 1-1 and 2-1 are satisfied and the student’s
check grade frequency is in the lower 17.3%, the at-risk probability increases to 89.50% (Rule 3-1). Finally, if rules 1-1, 2-1 and 3-1 are satisfied and the student’s hit frequency is in the low 35.9% in the class, the risk chance would further increase to 93.06%.
Because total behavior frequency has often been used to represent behavioral engagement level [54]–[56], and many researchers have claimed that high behavioral engagement level has positive correlations with high learning performance [54], [57], it is not surprised that if a student seldom accesses to the online learning system, he/she is unlikely to perform well. In addition, the ‘Discussion_word_counts’ variable is a general signal about a student’s discussion engagement level
[58]. Long postings usually need a considerable amount of time investment in constructing and presenting their ideas or thoughts, which involves high level of critical thinking to support their arguments with sufficient evidence [59], [60]. Improving student’s critical thinking is helpful for understating the relationships between concepts, using con-cepts to explain phenomena, and restricting knowledge in a more coherent way [61], [62]. Researchers have also found that there is a positive significant relationship between stu-dent’s critical thinking level and academic performance [63]. In addition, the variables of ‘Check_grade’ and ‘Hit’ can reflect student’s learning strategies. For example, if a student frequently checks grade, he/she is likely to have high self-regulated learning skills and often performs self-monitoring, self-reflection and self-evaluation [64], which could result in the high ability of planning, managing and controlling their learning process and learning performance [65]. Therefore, the identification of these significant variables could provide meaningful guidance and assistance for designing instruc-tional activities.
In summary, through the analysis of significant predictors of LVAEPre in this specific K-12 dataset, instructors could design some intervention programs to help at-risk students in the second half of the semester, such as requiring students to frequently access online learning system, encouraging stu-dents’ to share and express their opinions and thoughts in their learning process, and employing learning dashboards or other learning widgets to drive student’s high learning engagements.
V. CONCLUSION AND FUTURE RESEARCH
This study has proposed an integrated prediction frame-work (LVAEPre) in order to alleviate the imbalanced issue of educational dataset and further to provide accurate early warning prediction of at-risk students. The effectiveness and robustness of the proposed framework have been demon-strated by comparing its prediction performance with ten baseline methods. The comparison of t-SNE visualization results further confirms the advantage of LVAE in dealing with imbalanced education data. LVAEPre also has many benefits, including higher sensitivity rate, lower false positive error, and lower misclassification rate (i.e. higher overall accuracy rate). In addition, four significant predictors are identified via the surrogate modelling approach, which could provide meaningful insights for instructors to design appro-priate interventions. But due to the limitation of available datasets, more educational data from different learning con-texts are expected to further verify this framework in the future work. Furthermore, future research might also focus on the following directions: (1) how to generate other textual fea-tures for further improving prediction ability, (2) final grades were adopted as the target variable to reflect student’s learn-ing status, but in the future, more complex target variables can be considered, such as increasing or decreasing trends or prediction probability changes throughout the semester.
REFERENCES
[1] J. E. Seaman, I. E. Allen, and J. Seaman, ‘‘Grade increase: Tracking dis-tance education in the United States," inBabson Survey Research Segment. Babson Park, MA, USA: Babson College, 2018.
[2] S. A. Becker, A. Freeman, C. G. Hall, M. Cummins, and B. Yuhnke,
NMC/CoSN Horizon Report: 2016 K, Austin, TX, USA: The New Media Consortium, 2016.
[3] K. Phirangee, ‘‘Students’ perceptions of learner-learner interactions that weaken a sense of community in an online learning environment,’’Online Learn., vol. 20, no. 4, pp. 13–33, 2016.
[4] A. Cohen, ‘‘Analysis of student activity in web-supported courses as a tool for predicting dropout,’’Educ. Technol. Res. Develop., vol. 65, no. 5, pp. 1285–1304, Oct. 2017.
[5] I. Y. T. Hsiao, Y. J. Lan, C. L. Kao, and P. Li, ‘‘Visualization analytics for second language vocabulary learning in virtual worlds,’’Educ. Technol. Soc., vol. 20, no. 2, pp. 161–175, 2017.
[6] J.-L. Hung, M. C. Wang, S. Wang, M. Abdelrasoul, Y. Li, and W. He, ‘‘Identifying At-risk students for early interventions—A time-series clus-tering approach,’’ IEEE Trans. Emerg. Topics Comput., vol. 5, no. 1, pp. 45–55, Jan. 2017.
[7] F. Marbouti, H. A. Diefes-Dux, and K. Madhavan, ‘‘Models for early prediction of at-risk students in a course using standards-based grading,’’
Comput. Edu., vol. 103, pp. 1–15, Dec. 2016.
[8] X. Du, J. Yang, B. E. Shelton, J. L. Hung, and M. Zhang, ‘‘A systematic meta-review and analysis of learning analytics research,’’Behav. Inf. Tech-nol., early access, doi:10.1080/0144929X.2019.1669712.
[9] M. G. Brown, R. M. Demonbrun, S. Lonn, S. J. Aguilar, and S. D. Teasley, ‘‘What and when: The role of course type and timing in students’ Academic performance,’’ inProc. 6th Int. Conf. Learn. Anal. Knowl., Edinburgh, U.K., 2016, pp. 459–468.
[10] A. Alsheddy and M. Habib, ‘‘On the application of data mining algorithms for predicting student performance: A case study,’’Int. J. Comput. Sci. Netw. Secur., vol. 17, no. 10, pp. 189–197, 2017.
[11] E. B. Costa, B. Fonseca, M. A. Santana, F. F. de Araújo, and J. Rego, ‘‘Evaluating the effectiveness of educational data mining techniques for early prediction of students’ Academic failure in introductory program-ming courses,’’Comput. Hum. Behav., vol. 73, pp. 247–256, Aug. 2017. [12] R. J. Waddington, S. Nam, S. Lonn, and S. D. Teasley, ‘‘Improving early
warning systems with categorized course resource usage,’’J. Learn. Anal., vol. 3, no. 3, pp. 263–290, 2016.
[13] J. Luo, S. E. Sorour, K. Goda, and T. Mine, ‘‘Predicting student grade based on free-style comments using Word2Vec and ann by considering prediction results obtained in consecutive lessons,’’ inProc. 8th Int. Conf. Educ. Data Mining, Madrid, Spain, 2015, pp. 396–399.
[14] D. Kim, Y. Park, M. Yoon, and I.-H. Jo, ‘‘Toward evidence-based learning analytics: Using proxy variables to improve asynchronous online discus-sion environments,’’Internet Higher Edu., vol. 30, pp. 30–43, Jul. 2016. [15] J. W. You, ‘‘Identifying significant indicators using LMS data to predict
course achievement in online learning,’’Internet Higher Edu., vol. 29, pp. 23–30, Apr. 2016.
[16] J.-L. Hung, B. E. Shelton, J. Yang, and X. Du, ‘‘Improving predictive modeling for at-risk student identification: A multistage approach,’’IEEE Trans. Learn. Technol., vol. 12, no. 2, pp. 148–157, Apr. 2019.
[17] C. Márquez-Vera, A. Cano, C. Romero, and S. Ventura, ‘‘Predicting student failure at school using genetic programming and different data mining approaches with high dimensional and imbalanced data,’’Appl. Intell., vol. 38, no. 3, pp. 315–330, Apr. 2013.
[18] C. Máquez-Vera, A. Cano, C. Romero, A. Y. M. Noaman, H. M. Fardoun, and S. Ventura, ‘‘Early dropout prediction using data mining: A case study with high school students,’’Expert Syst., vol. 33, no. 1, pp. 107–124, Feb. 2016.
[19] Q. Zhou, W. Quan, Y. Zhong, W. Xiao, C. Mou, and Y. Wang, ‘‘Predicting high-risk students using Internet access logs,’’Knowl. Inf. Syst., vol. 55, no. 2, pp. 393–413, May 2018.
[20] H. He and E. A. Garcia, ‘‘Learning from imbalanced data,’’IEEE Trans. Knowl. Data Eng., vol. 21, no. 9, pp. 1263–1284, Jun. 2009.
[21] P. Zhou, X. Hu, P. Li, and X. Wu, ‘‘Online feature selection for high-dimensional class-imbalanced data,’’Knowl.-Based Syst., vol. 136, pp. 187–199, Nov. 2017.
[22] W. W. Ng, G. Zeng, J. Zhang, D. S. Yeung, and W. Pedrycz, ‘‘Dual autoen-coders features for imbalance classification problem,’’Pattern Recognit., vol. 60, pp. 875–889, Dec. 2016.
[23] C. Seiffert, T. M. Khoshgoftaar, J. Van Hulse, and A. Napolitano, ‘‘RUS-Boost: A hybrid approach to alleviating class imbalance,’’IEEE Trans. Syst., Man, Cybern. A, Syst. Hum., vol. 40, no. 1, pp. 185–197, Jan. 2010. [24] D. P. Kingma and M. Welling, ‘‘Auto-encoding variational Bayes,’’ inProc. Int. Conf. Learn. Represent. (ICLR), Ithaca, NY, USA, 2014. [Online]. Available: https://arxiv.org/abs/1312.6114
[25] I. J. Goodfellow, J. Pouget-Abadie, M. Mirza, B. Xu, D. Warde-Farley, S. Ozair, A. Courville, and Y. Bengio, ‘‘Generative adversarial nets,’’ in
Proc. Int. Conf. Neural Inf. Process. Syst., 2014, pp. 1–9.
[26] M. Mirza and S. Osindero, ‘‘Conditional generative adversarial nets,’’ 2014,arXiv:1411.1784. [Online]. Available: https://arxiv.org/abs/1411. 1784
[27] M. Arjovsky, S. Chintala, and L. Bottou, ‘‘Wasserstein GAN,’’ 2017,
arXiv:1701.07875. [Online]. Available: https://arxiv.org/abs/1701.07875 [28] H. Kwon, M. Woo, Y. H. Kim, and S. Kang, ‘‘Statistical leakage analysis
using Gaussian mixture model,’’IEEE Access, vol. 6, pp. 51939–51950, 2018.
[29] S. Sun and X. Xu, ‘‘Variational inference for infinite mixtures of gaussian processes with applications to traffic flow prediction,’’IEEE Trans. Intell. Transp. Syst., vol. 12, no. 2, pp. 466–475, Jun. 2011.
[30] L. C. Yu, C. W. Lee, H. I. Pan, C. Y. Chou, P. Y. Chao, Z. H. Chen, S. F. Tseng, C. L. Chan, and K. R. Lai, ‘‘Improving early prediction of academic failure using sentiment analysis on self-evaluated comments,’’
J. Comput. Assist. Learn., vol. 34, no. 4, pp. 358–365, 2018.
[31] A. A. Aziz, N. H. Ismail, F. Ahmad, and H. Hassan, ‘‘A framework for students’ Academic performance analysis using Naïve Bayes classifier,’’
J. Teknologi, vol. 75, no. 3, pp. 13–19, 2015.
[32] A. A. Saa, ‘‘Educational data mining & students’ performance prediction,’’
Int. J. Adv. Comput. Sci. Appl., vol. 7, no. 5, pp. 212–220, 2016. [33] R. Asif, S. Hina, and S. I. Haque, ‘‘Predicting student academic
perfor-mance using data mining methods,’’Int. J. Comput. Sci. Netw. Secur., vol. 17, no. 5, pp. 187–191, 2017.
[34] H. Nawang, M. Makhtar, and S. N. W. Shamsudin, ‘‘Classification model and analysis on students’ performance,’’J. Fundam. Appl. Sci., vol. 9, no. 6S, pp. 869–885, 2017.
[35] A. Pardo, N. Mirriahi, R. Martinez-Maldonado, J. Jovanovic, S. Dawson, and D. Gašević, ‘‘Generating actionable predictive models of academic performance,’’ inProc. 6th Int. Conf. Learn. Anal. Knowl., Edinburgh, U.K., 2016, pp. 474–478.
[36] C. Lang, N. Heffernan, K. Ostrow, and Y. Wang, ‘‘The impact of incor-porating student confidence items into an intelligent tutor: A randomized controlled trial,’’ inProc. 8th Int. Conf. Educ. Data Mining, Madrid, Spain, 2015, pp. 144–149.
[37] C. Brooks, C. Thompson, and S. Teasley, ‘‘A time series interaction anal-ysis method for building predictive models of learners using log data,’’ in
Proc. 5th Int. Conf. Learn. Anal. Knowl., Poughkeepsie, NY, USA, 2015, pp. 126–135.
[38] A. Torfi, S. M. Iranmanesh, N. Nasrabadi, and J. Dawson, ‘‘3D convolu-tional neural networks for cross audio-visual matching recognition,’’IEEE Access, vol. 5, pp. 22081–22091, 2017.
[39] J. Yang, F. Xie, H. Fan, Z. Jiang, and J. Liu, ‘‘Classification for dermoscopy images using convolutional neural networks based on region average pool-ing,’’IEEE Access, vol. 6, pp. 65130–65138, 2018.
[40] B. Purkaystha, T. Datta, M. S. Islam, and M. E. J. Mukta, ‘‘Product recommendation: A deep learning factorization method using separate learners,’’ inProc. 17th IEEE Int. Conf. Comput. Inf. Technol., Helsinki, Finland, Dec. 2017, pp. 1–5.
[41] M. Khajah, R. V. Lindsey, and M. C. Mozer, ‘‘How deep is knowledge tracing?’’ inProc. 9th Int. Conf. Educ. Data Mining, North Carolina, NC, USA, 2016, pp. 94–101.
[42] X. Xiong, S. Zhao, E. G. V. Inwegen, and J. E. Beck, ‘‘Going deeper with deep knowledge tracing,’’ inProc. 10th Int. Conf. Educ. Data Mining, North Carolina, NC, USA, 2016, pp. 545–550.
[43] L. Wang, A. Sy, L. Liu, and C. Piech, ‘‘Learning to represent student knowledge on programming exercises using deep learning,’’ inProc. 10th Int. Conf. Educ. Data Mining, Wuhan, China, 2017, pp. 324–329. [44] J. Shu, X. Shen, H. Liu, B. Yi, and Z. Zhang, ‘‘A content-based
recommen-dation algorithm for learning resources,’’Multimedia Syst., vol. 24, no. 2, pp. 163–173, Mar. 2018.
[45] N. V. Chawla, A. Lazarevic, L. O. Hall, and K. W. Bowyer, ‘‘SMOTEBoost: Improving prediction of the minority class in boosting,’’Lect. Notes Com-put. Sci., vol. 2838, pp. 107–119, 2003.
[46] H. He and Y. Ma, ‘‘Ensemble methods for class imbalance learning,’’ in Imbalanced Learning: Foundations, Algorithms, and Applications. Hoboken, NJ, USA: Wiley, 2013.
[47] A. Fernández, S. García, M. J. Del Jesus, and F. Herrera, ‘‘A study of the behaviour of linguistic fuzzy rule based classification systems in the framework of imbalanced data-sets,’’Fuzzy Sets Syst., vol. 159, no. 18, pp. 2378–2398, Sep. 2008.
[48] M. S. Tehrany, B. Pradhan, and M. N. Jebur, ‘‘Spatial prediction of flood susceptible areas using rule based decision tree (DT) and a novel ensemble bivariate and multivariate statistical models in GIS,’’J. Hydrol., vol. 504, pp. 69–79, Nov. 2013.
[49] H. Nampak, B. Pradhan, and M. A. Manap, ‘‘Application of GIS based data driven evidential belief function model to predict groundwater potential zonation,’’J. Hydrol., vol. 513, pp. 283–300, May 2014.
[50] Y. Lecun, L. Bottou, Y. Bengio, and P. Haffner, ‘‘Gradient-based learn-ing applied to document recognition,’’ Proc. IEEE, vol. 86, no. 11, pp. 2278–2324, Nov. 1998.
[51] L. van der Maaten and G. Hinton, ‘‘Visualizing data using t-SNE,’’J. Mach. Learn. Res., vol. 9, pp. 2579–2605, Nov. 2008.
[52] W. S. Saif, T. Alshawi, M. A. Esmail, A. Ragheb, and S. Alshebeili, ‘‘Sep-arability of histogram based features for optical performance monitoring: An investigation using t-SNE technique,’’IEEE Photon. J., vol. 11, no. 3, Jun. 2019, Art. no. 7203012.
[53] P. Hall, W. Phan, and S. Ambati. (2017).Ideas on Interpreting Machine Learning. O’Reilly. Accessed: Mar. 25, 2019. [Online]. Available: https://www.oreilly.com/ideas/ideas-on-interpreting-machine-learning [54] J.-L. Hung, Y.-C. Hsu, and K. Rice, ‘‘Integrating data mining in program
evaluation of K-12 online education,’’J. Educ. Technol. Soc., vol. 15, no. 3, pp. 27–41, 2012.
[55] J.-L. Hung and K. Zhang, ‘‘Revealing online learning behaviors and activ-ity patterns and making predictions with data mining techniques in online teaching,’’J. Online Learn. Teach., vol. 4, no. 4, pp. 426–437, 2008. [56] E. Webb, A. Jones, P. Barker, and P. Van Schaik, ‘‘Using e-learning
dialogues in higher education,’’Innov. Edu. Teach. Int., vol. 41, no. 1, pp. 93–103, Feb. 2004.
[57] M. Scheffel, H. Drachsler, J. De Kraker, K. Kreijns, A. Slootmaker, and M. Specht, ‘‘Widget, widget on the wall, am I performing well at all?’’
IEEE Trans. Learn. Technol., vol. 10, no. 1, pp. 42–52, Jan. 2017. [58] K. Xie, ‘‘What do the numbers say? The influence of motivation and peer
feedback on students’ behaviour in online discussions,’’Brit. J. Educ. Technol., vol. 44, no. 2, pp. 288–301, Mar. 2013.
[59] J. Hewitt, C. Brett, and V. Peters, ‘‘Scan rate: A new metric for the analysis of reading behaviors in asynchronous computer conferencing environ-ments,’’Amer. J. Distance Educ., vol. 21, no. 4, pp. 215–231, Nov. 2007. [60] V. Ekahitanond, ‘‘Promoting university students’ critical thinking skills
through peer feedback activity in an online discussion forum,’’Alberta J. Educ. Res., vol. 59, no. 2, pp. 247–265, 2013.
[61] M. Alavi and A. Tiwana, ‘‘Knowledge integration in virtual teams: The potential role of KMS,’’ J. Amer. Soc. Inf. Sci., vol. 53, no. 12, pp. 1029–1037, Oct. 2002.
[62] E. A. Davis, ‘‘Scaffolding students’ knowledge integration: Prompts for reflection in KIE,’’Int. J. Sci. Educ., vol. 22, no. 8, pp. 819–837, Aug. 2000.
[63] Z. Ghazivakili, R. N. Nia, F. Panahi, M. Karimi, and H. Gholsorkhi, ‘‘The role of critical thinking skills and learning styles of university stu-dents in their academic performance,’’J. Adv. Med. Edu. Professionalism, vol. 2, no. 3, pp. 95–102, 2014.
[64] D. H. Schunk, ‘‘Self-regulated learning: The educational legacy of Paul R. Pintrich,’’Educ. Psychologist, vol. 40, no. 2, pp. 85–94, Jun. 2005. [65] R. F. Kizilcec, M. Pérez-Sanagustín, and J. J. Maldonado, ‘‘Self-regulated learning strategies predict learner behavior and goal attainment in Massive Open Online Courses,’’Comput. Edu., vol. 104, pp. 18–33, Jan. 2017.
XU DUreceived the Ph.D. degree in communi-cation engineering from the Huazhong University of Science and Technology, China, in 2002. He is currently a Professor with the National Engi-neering Research Center for E-Learning, Central China Normal University, China. His research interests include smart environment and mobile learning, resource scheduling and recommen-dation, machine learning, and educational data mining.
JUAN YANG received the master’s degree in communication engineering from the Huazhong University of Science and Technology, China, in 2015. She is currently pursuing the Ph.D. degree with Central China Normal University, China. Her research interests include machine learning, deep learning, and educational data mining.
JUI-LONG HUNGreceived the Ed.D. degree in instructional and educational technology with a minor in information systems from Texas Tech University, USA, in 2007. He is a Professor with the Department of Educational Technology, Boise State University, and a Researcher of the research centers such as the Center for Advanced Analytics and Business Intelligence, Texas Tech University, the Data Mining Laboratory, University of Central Florida, USA, and the National Engineering Lab-oratory for Educational Big Data, Central China Normal University, China. His research interests include educational data and text mining, and learning analytics.