1
The impact of scale effects on the prevailing internet-based
banking model in the US
Alexandre Momparlera*, Francisco J. Climentb and José M. Ballesterb
a Departament of Corporate Finance, Universitat de València,
Avda. Tarongers s/n, 46022, Spain.
b Department of Financial Economics, Universitat de València,
Avda. Tarongers s/n, 46022, Spain.
*Corresponding author Email: [email protected] Phone#: (34) 963828369
2
The impact of scale effects on the prevailing internet-based
banking model in the US
Internet-based banks use a technology-intensive production process that may benefit from scale effects as they grow larger. This paper analyzes whether the predominant Internet-primary bank in the USA generates technology-based economies of scale. There is evidence of both favorable and adverse technology-based scale effects. As the leading Internet-primary bank gets larger, the financial performance gap with traditional banks shrinks while some of its critical competitive advantages wear down. The results suggest that unless the prevailing Internet-primary bank preserves the distinctive advantages of the Internet-based business model as it improves financial performance, it might end up converging with its branching competitors.
Key words: IT, banking, financial services, Internet
1.
Introduction
The barriers to nationwide branch banking, have made the impact of Internet banking more pronounced in the USA than in Japan and the European Union, where branching is generally allowed. As Internet has lowered the geographic barriers that hinder free competition of banks, rivalry within the banking industry has become more intense in the USA. The ability to boost profitability is no longer ensured by the small number of nearby competitors (Moore, 1998).
3 Branching banks have implemented full-service Internet banking, largely, as a long-term defensive survival strategy (Pyun, 2002). In the beginning, many bankers did not find their website operations reducing their cost of serving their customers. Rackley (2000) claims that as much as 30 percent of Internet banks report that their website and related Internet operations are unprofitable. The most important driving force in support of full-service Internet banking has been the need to create powerful barriers to customer defection (Schechunoff, 2000). The strategy was to tie the bank’s customers to its own website; as stated by Pyun (2002), once a customer becomes used to a bank’s website, the likelihood that the customer will take the time and effort to move to another financial institution significantly decreases.
All in all, Internet has already become an important distribution channel to the US banking industry. For the most part, US financial institutions follow a multi-channel distribution model, in which Internet complements the traditional channels (mainly branches and ATMs). Only a small number of banks deliver banking services primarily over the Internet. Although most Internet-primary banks operating in the US are already profitable, they still have a long way to overcome the financial performance gap that keeps their profitability—in terms of both ROA and ROE—far below the branching banks’.
In his study for the period 1997-1999, De Young (2001) compares financial performance of both Internet-primary and branching banks in the USA. He concludes that the average Internet-primary bank is significantly less profitable than the average branching bank. The results of the study also bring to light two fallacies about the Internet-primary business model: overall overhead expenses are not necessarily lower, and overall deposit interest rates are not necessarily higher, compared with branching banks. In addition, the results of the paper
4 indicate that Internet-primary banks tend to grow faster than traditional branching banks. Even though these results cast doubt on the future viability of a high-growth low-profitability business model, De Young points out that the data sets analyzed are not sufficient by themselves to support such strong conclusions. The author suggests that the new business model is very young and the financial performance of Internet-primary banks may improve as they mature.
A more recent paper by De Young (2005) investigates—through empirical tests—the existence of technology-based experience effects and technology-based scale effects that may benefit more those banks that make a more intensive use of technology—Internet primary banks—than branching banks. The econometric analysis performed for the period 1997-2000, finds strong evidence of technology-based scale effects but not of technology-based experience effects. Furthermore, the results of the study suggest that Internet-primary banking success depends on attaining sufficient scale and strong management practices.
From a different standpoint, a report by Furst et al. (2002) presents the Internet banking background in the USA banking system. The authors also investigate whether offering Internet banking affects banks’ profitability, evaluating financial performance of Internet banks versus non-Internet banks. In addition, they establish the key factors explaining profitability in the third quarter of 1999. This report also examines banks’ plans for offering Internet banking and the impact of Internet banking on the banking industry’s structure.
Other recent papers in the fields of banking and management that have inspired and motivated our research are grouped in accordance with their focus: efficiency and productivity (Chen, 2009; Figueira and Nellis, 2009; and Sufian, 2009); client satisfaction and service quality,
5 customer equity and brand equity (Liu and Wu, 2009; Nadiri et al., 2009; Proença and de Castro, 2007; Roofthooft, 2010; Wang et al., 2009); small business banking (Locke and Boulanaour, 2009); economies of scale and internal firm organization (Peris-Ortiz and Rueda-Armengot, 2010); and perceived risk and trust for Internet banking (Yousafzai et al., 2009).
In this study the financial performance of the leading US Internet-primary bank is compared with a branching bank benchmark. In addition, the existence of technology-based scale effects is investigated through panel data analysis as these effects may enhance more the performance of the foremost Internet-primary bank than that of the branching bank benchmark. Panel data analysis is a method of studying a particular subject within multiple sites, periodically observed over a defined time frame. As Internet-primary banking is a young business model that emerged in the USA in 1995, the use of data for 2002-2008 is likely to be more significant than any previous research performed over earlier and shorter time frames. Another important premise is the clear distinction between Internet-primary banking and Internet traditional banking, which is a requirement to identify and evaluate the different business models in the banking industry. Moreover, we have noticed that the main studies on Internet-primary banking in the US have omitted the leading Internet-primary financial institution: ING Bank. In our analysis, we focus entirely on this financial institution (the largest Internet-primary bank operating in the US) because of its overwhelmingly superior asset size and peculiar business model. We understand that within the US Internet-primary segment, ING Bank is in a class of its own.
The remainder of the study proceeds as follows. First, under the last heading of this introduction the current structure of the Internet-primary banking segment is portrayed. Then, an initial analysis of the data is provided. Next, we present the statistical model used in the
6 empirical analysis. After that, we present the main results of the empirical analysis. And finally, we put forward the main conclusions of the study.
The Internet-primary banking segment
In the last update of May 2005, FDIC’s Internet-primary list includes fifteen institutions. Three institutions, out of these fifteen, have been left out of our study because banking is not their principal activity but an auxiliary activity. Four more institutions have been excluded because of mergers or acquisitions with branching banks, which resulted in loss of independence and abandonment of the Internet-primary strategy. In this way, we are left with eight financial institutions which comprise our Internet-primary sample.
Table 1
Basic data as of December 31, 2008
Total Assets
($ thousands) ($ thousands) Deposits ($ thousands) Net Income Employees Branches
ING Bank, fsb 82.416.721 71.769.528 -1.111.401 2.328 1
Lydian Private Bank 2.116.737 1.278.515 -12.440 144 1
Principal Bank 2.326.856 2.142.709 15.598 129 1
The Bancorp Bank 1.790.156 1.539.617 -41.156 305 1
Nexity Bank 1.057.240 678.368 -11.381 107 1
Bank of Internet 1.218.939 633.870 5.493 51 1
First Internet Bank 542.235 440.329 1.748 44 2
Ebank 153.000 136.669 -7.123 18 1
Source: FDIC database.
Table 1 presents basic financial data on the Internet-primary institutions. The data clearly shows the overwhelming leverage of ING Bank in the US Internet-primary banking segment. ING Bank’s total assets and deposits account for 89.95% and 91.29% respectively of aggregate figures for the Internet-primary segment considered.
7
2.
Initial analysis of the data
The source of the data is the FDIC database. We analyze the data with the help of descriptive statistics. We also perform Levene’s test of homogeneity of variance and an ANOVA analysis with SPSS 15.0 software in order to find out whether there are statistically significant differences between the means of the different groups of banks. ANOVA analysis is an analysis of variance that tests the hypotheses that a difference between the means of two independent samples is attributable to chance.
The results of Levene’s test (p<0,05) show that in terms of ROA and ROE there is homogeneity of variance between the two samples of banks (online and branching). However, the results of the ANOVA (p<0,05) indicate that, for both ROA and ROE, there are statistically significant differences between the means of online bank and the branching bank samples. These findings provide evidence that the branching bank sample and the online bank sample perform differently in terms of ROA and ROE.
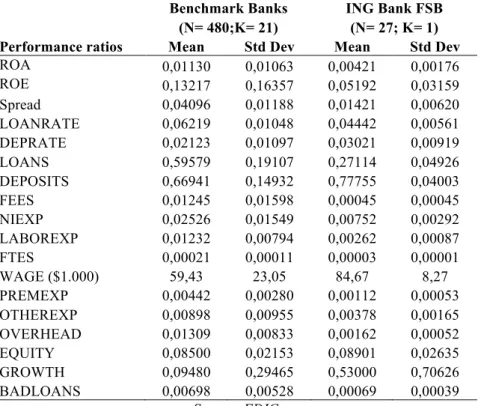
To begin the analysis of the two samples, Table 2 exhibits the means and standard deviations for the variables used in the regression tests, based on quarterly data from 2002:Q1 through 2008:Q3. The 18 rows contain financial performance ratios used as endogenous variables in the regressions. The statistics displayed in column 1 (“Benchmark Banks”) describe the population of similar size branching banks and thrifts (with 2002:Q1 assets within a range defined by ING Bank’s assets ± 10%) that operate with more than one branch in the U.S. markets during the sample period.i Significant differences between the means of the benchmark banks and ING Bank provide evidence of a performance gap between the main Internet-only bank and comparable size branching banks.
8
Table 2: Performance ratios
Benchmark Banks ING Bank FSB (N= 480;K= 21) (N= 27; K= 1)
Performance ratios Mean Std Dev Mean Std Dev
ROA 0,01130 0,01063 0,00421 0,00176 ROE 0,13217 0,16357 0,05192 0,03159 Spread 0,04096 0,01188 0,01421 0,00620 LOANRATE 0,06219 0,01048 0,04442 0,00561 DEPRATE 0,02123 0,01097 0,03021 0,00919 LOANS 0,59579 0,19107 0,27114 0,04926 DEPOSITS 0,66941 0,14932 0,77755 0,04003 FEES 0,01245 0,01598 0,00045 0,00045 NIEXP 0,02526 0,01549 0,00752 0,00292 LABOREXP 0,01232 0,00794 0,00262 0,00087 FTES 0,00021 0,00011 0,00003 0,00001 WAGE ($1.000) 59,43 23,05 84,67 8,27 PREMEXP 0,00442 0,00280 0,00112 0,00053 OTHEREXP 0,00898 0,00955 0,00378 0,00165 OVERHEAD 0,01309 0,00833 0,00162 0,00052 EQUITY 0,08500 0,02153 0,08901 0,02635 GROWTH 0,09480 0,29465 0,53000 0,70626 BADLOANS 0,00698 0,00528 0,00069 0,00039 Source: FDIC
Profitability at the Internet-only leading bank was much lower than the higher profitability at the typical branching bank in the benchmark. On average, ROA and ROE were about 70 and 800 basis points lower respectively. However, a closer look at the components of profitability indicates that ING Bank has successfully applied many elements of the Internet-primary business model, such as low interest margins, low fees, low labor expense, high wages, low overhead ratios, and fast asset growth.
For the period analyzed, average asset growth rates reveal that ING Bank’s growth is in accordance with the high growth generally associated with the Internet-primary banking business model. ING Bank’s average growth rate is about 5.6 times that of the branching bank benchmark. Nevertheless, in light of the historical trends (see Figure 1), ING Bank’s growth rates have declined over time whereas branching bank’s have been fairly stable, which
9 suggests that the extremely high growth ING Bank experienced in the beginning of its operations in the US is not sustainable in the long run. As a result, ING Bank’s growth rates are much more homogeneous to the benchmark’s towards the end of the time path than at the outset.
Figure 1
Concerning ROA historical trends (see Figure 2), although ING Bank’s is somewhat erratic, there is a gradual closing of the profitability gap mostly attributable to the remarkable fall of the benchmark’s over the sampling period.
10 Figure 2
Figure 3
The ROE time path (see Figure 3) follows a similar pattern as that of ROA, that is, there is a narrowing gap between ING Bank and the comparable branching bans up to the 24th quarter (December, 2007), when ING Bank’s ROE beats that the benchmark. The subsequent quarters
11 show increasingly volatile records that may be related with the financial crises that started by September 2007.
The profitability gaps can be explained by the different trends in the two main sources of income (interest margins and fees) for each, the benchmark and the Internet-only bank. The benchmark’s interest margin (SPREAD) averaged 267 basis point higher that ING Bank’s. The spread time path shows that ING Bank has always operated with both lower loan rates and higher deposits rates than the average branching bank in the benchmark. Even though there is some convergence over the last two years (see Figure 4), a significant spread gap still remains, showing that the prevailing Internet-primary banking model in the US keeps operating with a much slimmer interest margin than comparable branching banks.
Figure 4
Despite offering more attractive prices, ING Bank generated fewer loans (LOANS was about 32 percentage points lower). However, the Internet-only bank was more successful than the
12 average branching bank at attracting deposits (DEPOSITS was nearly 11 percentage points higher). On the one hand, the low level of loan generation is consistent with the low-involvement nature of banking without branch offices.
Table 3: Loan portfolio
(quarterly data from 2002:Q1 trhough 2008:Q3)
Benchmark Banks ING Bank FSB
Performance ratios Mean Std Dev Mean Std Dev
% business 0,16622 0,17009 0,00016 0,00047
% real estate 0,71055 0,26013 0,97456 0,02796
Source: FDIC
Mortgages, auto loans, credit cards, and other transaction loans can be underwritten using underwriting automated techniques easily deployed over the Internet, but relationship lending to small businesses requires person-to-person contact. The loan portfolio data presented in Table 3 shows that while commercial and industrial loans make up 16.6% of branching banks’ total loans they are virtually nil for ING Bank. On the other hand, the higher level of deposit generation by ING Bank could be due to higher interest rates and to the simple nature of this kind of transaction.
13 Figure 5
In relation to the fees historical records (see Figure 5), benchmark banks’ trend indicates a slow deterioration of this source of income during the studied period. Although fee income is a negligible source of income to ING Bank (0.04%), it provides benchmark banks with a source of income (1.24%) that complements interest margin income. Low or no fees is one of the distinct characteristics of the Internet-primary business model which is confirmed by ING Bank’s records. It is very likely that the emergence of the Internet-primary banking model has had an impact on branching bank’s declining fee income.
Benchmark banks’ total non-interest expense ratio is 177 basis points higher than ING Bank’s, which may indicate lower “labor expense” and reduced “premises and equipment expense” typical of the Internet-primary model. Indeed, this is confirmed by the much lower average labor expense ratio (see Table 1). The labor expense historical trends clearly illustrate that this remains a major difference between the two banking models. The time paths for both ING Bank and the benchmark (see Figure 6) have been fairly parallel over the 27-quarter
14 period and the large existing gap did not shrink in any way. In addition, ING Bank has achieved a significantly lower labor expense while paying salaries that exceeded by 25,240$, on average, those paid by branching banks (see Table 1).
Consistent with lower labor expense as a distinctive trait of the Internet-primary model, the full-time employees divided by total assets ratio (FTES in Table 1) is, on average, about seven times higher for benchmark banks. If we invert this ratio to obtain the “assets managed by employee” historical trends (see Figure 7), it is noteworthy that ING Bank’s grows continuously until the 17th quarter (March, 2006) of our sampling period and starts declining thereafter. Although branching banks have experienced steady growth in assets managed by employee, ING Bank’s higher efficiency in the use of human resources sets apart these two ways of banking.
15 Figure 7
3.
Methodology
Panel data analysis is a method of studying a particular subject within multiple sites, periodically observed over a defined time frame. Within the social sciences, panel analysis has enabled researchers to undertake longitudinal analyses in a wide variety of fields. In economics, panel data analysis is used to study the behavior of firms over time. With repeated observations of enough cross-sections, panel analysis permits the researcher to study the dynamics of change with short time series. The combination of time series with cross-sections can enhance the quality and quantity of data in ways that would be impossible using only one of these two dimensions (Gujarati, 2003).
16 Panel data analysis endows regression analysis with both a spatial and temporal dimension. The spatial dimension pertains to a set of cross-sectional units of observation. These could be countries, states, firms, commodities, groups of people, or even individuals. The temporal dimension pertains to periodic observations of a set of variables characterizing these cross-sectional units over a particular time span.
Pooled-data model
This model assumes that the intercept and the slope of the individuals are constant and consistent for all of them, i.e. are treated as a single data-point cloud.
The model in the multivariate case has the following specification:
€ Yit =α+Xkit⋅βk+uit Where: ⎥ ⎥ ⎥ ⎥ ⎦ ⎤ ⎢ ⎢ ⎢ ⎢ ⎣ ⎡ = Nt t t it Y Y Y Y ! 2 1 , ⎥ ⎥ ⎥ ⎥ ⎥ ⎥ ⎦ ⎤ ⎢ ⎢ ⎢ ⎢ ⎢ ⎢ ⎣ ⎡ = knt nt nt t k t t t k t t kit X X X X X X X X X X ! " # " " ! ! 2 1 2 22 12 1 21 11 , ⎥ ⎥ ⎥ ⎥ ⎦ ⎤ ⎢ ⎢ ⎢ ⎢ ⎣ ⎡ = Nt t t it β β β β ! 2 1 , ⎥ ⎥ ⎥ ⎥ ⎦ ⎤ ⎢ ⎢ ⎢ ⎢ ⎣ ⎡ = Nt t t it u u u u ! 2 1 ,is a vector
containing the random perturbations of each individual.
It is assumed that E (uit) = 0 with constant variance σ2u and that the variable Xkit is
uncorrelated with the random disturbance uit. Furthermore the homoscedasticity and not
autocorrelation between each of the groups’ disturbances, nor temporarily. Therefore, OLS estimators are consistent and efficient.
17 Sometimes the pooled-data model does not provide a realistic representation of the data because it takes the data as a point cloud over which econometric regression is performed.ii Yet, at times, although each bank has a different starting point, they all behave in a similar way over time. And this is why there are both fixed effects and random effects models which study each institution individually.iii
Fixed-effects model
This analysis focuses on the individual effects αi, regarded as unobservable factors that
remain constant over time; these effects are specific to each of the individuals and are correlated with the explanatory variables. Therefore, the inference is dependent on the individual effects values αi in the sample.
Under these assumptions the model can be expressed as follows:
€
Yit =αi+Xkit⋅βk+uit
If we calculate the regression using OLS, estimators of the model are not consistent due to specification problems, because the impact of explanatory variables and fixed effects on these estimates cannot be set apart.
(Cov(xit, αi)≠0).
One possible solution to the problem would be to introduce dummy variables. But in order to avoid the introduction of many dummy variables, fixed effects models can be estimated by the following transformation:
1. Temporal averages for each individual are computed
€ Yi =αi+βi⋅ Xki+ui Where € Yi = 1 T t=1Yit T
∑
and € Xki = 1 T t=1Xkit T∑
18 2. The variables are transformed in deviations from the time average for each individual
so that individual effects are eliminated.
(
)
(
kit ki)
it i T k it i it Y X X u u Y − =∑
⋅ − + − =1 β3. OLS is applied to the transformed model, obtaining consistent and efficient estimators. i
i
i =Y −β⋅X
αˆ ˆ where βˆ =
(
βˆ1!βˆk)
Random effects model
The differences between individuals respond to purely random factors, i.e. Cov (Xit, αi)= 0.
Where
€
αi =α+εi, εi=NI(0,δ
2
ε)
Where the model is specified as:
€
Yit =α+εit+
∑
βk⋅Xkit+uit =α+∑
βk⋅Xkit+wit where wit=uit +εit, under the assumption:€
E
[ ]
εituj =0 for every i, t and j,€ E
[ ]
εitεjs =0 If t ≠ s or i ≠ j, € E u[ ]
iuj =0 If i ≠ j Therefore 2 2 2 u w δ δ δ = ε +The consistent and efficient estimation method in this model is the generalized least squares (weighted).
There are two econometric tests that help us choose the best model from the aforementioned models: the homogeneity test and the Hausman test, the former comparing fixed effects versus pooled-data models, and the latter random effects versus fixed effects models.
19
Homogeneity test
H0: α1= α2=…= αN(
)
(
)
rNT K g R G F K T N R r R R − ⋅ ≈ − ⋅ − − , 2 2 2 / 1 /Where r is the number of restrictions (r = N-1), N•T are the observations and K the total number parameters in the general model, which is the fixed effects model, the pooled-data being the restricted model.
If H0 is rejected, the pooled data model is chosen, otherwise, we would choose the fixed
effects model.
Hausman test
ivH0: Independence between αi and xi, i.e. the random effects model being consistent and
efficient. € βEF −βEA
(
)
'⋅ MEF −MEA(
)
−11⋅ βEF −βEA(
)
≈χρ2( )MThe freedom degrees of χ2 is defined by the Rank of the matrix ρ(MEF-MEA) where:
βEF is the vector of estimators of fixed effects model.
βEA is the vector of estimators of the random effects model.
MEF is the variance covariance matrix of fixed effects model. MEA is the variance covariance matrix of random effects model.
If H0 is rejected, we choose the random effects model.
20
Regression model
The regression model used for research is as follows:
€
PERFORMANCEI,T =α+β1∗ONLINEi+β2∗lnASSETSi,t+β3∗ONLINEi∗lnASSETSi,t
+β4∗%BUSSINESSi,t+β5∗%REALSTATEi,t+β6∗LOANSi,t+β7∗ALLOWANCEi,t
+β8∗UNEMPLOYMENTt+β9∗YEARt +β10∗QUARTERt+εi,t
Where PERFORMANCE can be one of the 18 financial performance ratios previously calculated. The subscript i indicates the name of the bank observed, and the subscript t stands for time in quarters. ONLINE is a dummy variable that takes the value 1 when we refer to ING Bank and 0 otherwise, and β1 indicates the difference of being an online bank to be a traditional bank, where β1 is statistically significant.
The lnASSETS controls for the effects of operating scale on bank performance. ONLINE*lnASSETS captures possible economies of scale resulting from the technology used (Internet). The terms %REALSTATE and %BUSSINESS are included to control the effects of loan portfolio structure on banks’ earnings and the growth rates. LOANS and ALLOWANCE are standard measures of bank riskiness. UNEMPLOYMENT is included to control the economic conditions during the study period. QUARTER and YEAR are dummy variables that controls the cyclical and seasonal influences on bank performance not captured by the other control variables.
21
4.
Empirical analysis results
Appendix 3 displays the estimated values of β from the regression of the equation. The signs of the estimated β values are largely consistent with the performance gaps inferred by the difference of means tests in Table 2. However, the performance gaps inferred by the regression are more statistically significant and have different magnitudes because they are conditioned on the exogenous regression variables.
In terms of Return On Assets, there are technology-based scale effects that enhance the profitability of ING Bank. The adverse generic scale effects affecting the spread are due to the fact that as banks grow larger they are able to operate with thinner interest spreads. However, the favorable technology-based scale effects are shrinking the spread gap between ING Bank and branching banks. On the one hand, the adverse generic scale effects on loan rates have to do with the ability of larger banks to lend at lower rates than smaller banks. On the other hand, there are technology-based scale effects that suggest an increasing ability of ING to lend at higher rates as it grows larger. Also, there are generic scale effects which suggest that the larger the bank the lower the interest rates paid on deposits which suggests that size has an impact on clients confidence: the larger the bank the greater the clients’ confidence. And this is why clients are willing to accept lower deposit rates from larger banks. In terms of the amount of assets invested in loans, we may say that the higher the asset volume the lower the percentage of loans to total assets. Similarly, banks with higher asset volume are less dependent on client deposits as a source of funds than smaller banks. Concerning fee income to total assets, we find generic scale effects indicating that larger banks generally obtain lower fees to total assets ratios, which suggests that larger banks are able to operate with lower fee income than smaller banks.
22 Regarding non-interest expense we find both favorable generic scale effects and adverse technology-based scale effects. These findings suggest that although ING still operates with lower interest expense than branching banks, it is not being successful at restraining non-interest expense as it grows, which indicates an erosion of ING’s competitive advantage. Again, with regard to labor expense we find both favorable generic scale effects and adverse technology-based scale effects that reduce ING’s initial advantage in labor expense. This is a critical difference between the two business models and challenges the idea that online banks are able to grow without significant labor expense increases. As to the number of full-time employees over total assets, the data indicates that there are generic scale effects, meaning that as banks grow larger, the average employee is able to manage higher assets volume. However, we also observe the existence of adverse technological scale effects that signals an increasing loss of efficiency in human resources management as ING grows. We also find noteworthy the existence of favorable generic scale effects in terms of expense on premises and equipment. While there are favorable generic scale effects on other non-interest expenses (non-labor and non-premises), ING does not obtain any significant technology-based scale effects.
Quite surprisingly, the results for overhead indicate that thanks to favorable generic scale effects larger banks operate with lower physical assets to total assets while there are no significant technology-based scale effects. In terms of equity, technology-based scale effects indicate that as ING gets bigger it can operate with a lower level of capitalization. Although the results show favorable generic scale effects on growth, meaning that larger banks grow at higher rate, there are unfavorable technology-based scale effects indicating that ING growth rates are slowing down as it gets bigger. Finally, in reference to bad loans, on the one hand,
23 we observe that there are favorable generic scale effects, that is, banks are able to reduce bad loans as they grow. On the other hand there are adverse technology-based scale effects suggesting that ING ratio of bad loans gets worse as it gets larger.
5.
Conclusions
As the Internet expands, traditional branching banks in the USA have entered the Internet banking business as a defensive move. In fact, most of them adopted Internet banking as a component of a multichannel distribution strategy. There are only a few banks which have implemented an Internet-primary business model.
The structure of the Internet-primary banking sample is characterized by the overwhelming predominance of a single large institution (larger than all the other Internet-primary institutions combined) with a distinct business model which deserves individual consideration. Thus, we have chosen to match ING Bank with a branching bank benchmark.
A potential source of value in Internet-primary banks comes from automation and increased scale. Since automated processes typically require large fixed investments but reduce variable costs, e-commerce applications may substantially reduce per-unit costs or increase the optimal size of the firm.
24 This study attempts to identify and estimate the implications of scale at the leading Internet-primary bank throughout the 2002-2008 period. The framework used to address scale effects allows increased size to improve performance in two different ways: through general scale effects, which are available to all banks regardless of their business model, and technology-based scale effects, which are available only to Internet-primary banks.
An empirical analysis tests for the existence of these scale effects for the leading Internet-only bank in the US, using 21 similar-size branching banks as a performance benchmark. On the one hand, there is evidence of favorable technology-based scale effects that yield a differentially greater improvement of ING Bank’s financial performance relative to branching bank’s in terms of return on assets and spread. On the other hand, there is evidence that adverse technology-based scale effects are narrowing down the performance gap between ING Bank and branching banks in terms of non interest expense, labor expense, and efficiency in human resources management, which may entail the eventual loss of ING Bank’s distinctive competitive advantages. In addition, while there is evidence that generic scale effects help reduce the bad loans ratio, adverse technology-based effects show increasing bad loans ratio for ING Bank.
Regarding the level of capitalization, there is evidence that technology-based effects allow for lower levels of capitalization as ING Bank grows. This is consistent with reports that initially capital regulations were applied more strictly to Internet-primary banks. As regulators have gained experience and become more comfortable with this business model, the superior capital requirements have been relaxed, making the model more attractive to investors.
25 Finally, although there is evidence of favorable generic scale effects on growth, there are also technology-based scale effects that diminish ING Bank growth rates, suggesting that ING Bank cannot sustain past sky-scraping growth rates as it gets larger.
Nevertheless, the obtained results should be considered with caution. As this case study focuses on a financial institution with unique characteristics, our findings cannot be generalized to other Internet-primary financial institutions.
The mixed picture we obtain from our analysis, whereby ING Bank is improving financial performance while losing some distinctive competitive advantages, is pointing towards a gradual convergence between the leading Internet-primary bank and comparable branching banks in the USA.
Acknowledgments
Financial support from the Ministry of Science and Technology of Spain (research project ECO2009-14457-C04-04) is gratefully acknowledged.
26
6.
References
Arellano M (2003) Panel data econometrics. Oxford University Press, Oxford. Baltagi B.H. (2001) Econometric analysis of panel data, 2nd edn. Wiley, New York.
Chen SH (2009) Establishment of a performance-evaluation model for service quality in the banking industry. The Service Industries Journal 29 (2), 235-247.
De Young R (2001) The financial performance of pure play Internet banks. Economic Perspectives 25 (1), first quarter, Bank of Chicago.
De Young R (2005) The performance of Internet-based business models: evidence from the banking industry. Journal of Business, University of Chicago 78 (3), 893-947.
Figueira C, Nellis, J (2009) Bank merger and acquisitions activity in the EU: much ado about nothing?. The Service Industries Journal, 29 (7), 875-886.
Furst K, Lang W, Nolle D (2002) Internet banking: developments and prospects. Program on Information Resources Policy. Center for Information Policy Research & Harvard University, Cambridge.
Gujarati D (2003) Basic Econometrics. 4th ed. New York: McGraw Hill.
Hausman JA (1978) Specification tests in econometrics. Econometrica 46: 1251–1271. Hsiao C (2007) Panel data analysis—advantages and challenges. Test 16 (1): 1-22.
Liu TC, Wu LW (2009) Cross-buying evaluations in the retail banking industry. The Service Industries Journal 29 (9): 903-922.
Locke S, Boulanaour Z (2009) Cost of small business banking: a New Zealand study. Service Business 3 (3): 211-227.
27 Moore RR (1998) Concentration, technology and market power in banking: Is distance dead?.
Financial Industry Studies, Federal Reserve of Dallas, December, 1-24.
Nadiri H, Kandampully J, Hussain K (2009) Zone of tolerance for Banks: a diagnostic model of service quality. The Service Industries Journal 29 (11), 1547-1564.
Peris-Ortiz M, Rueda-Armengot C (2010) Organisational capabilities and transaction costs in the analysis of activities and their externalisation: implications for the service industry. Service Business, vol. 4 (2): 105-122.
Proença JF, de Castro LM (2007) The business-to-business relationship dimensions in financial services markets. Service Business 1 (1): 63-78.
Pyun CS (2002) Internet banking in the U.S., Japan and Europe. Multinational Business Review, Fall: 73-81.
Rackley T (2000) Planning is key to cyberbanking success. Bank system and technology 37 (2).
Roofthooft W (2010) Customer equity: a creative tool for SMEs in the services industry. How small and medium enterprises can win the battle for innovation. Service Business 4 (1): 37-48.
Sheshunoff A (2000) Internet banking—an update from the frontlines. ABA Banking Journal, January: 51-52.
Sufian F (2009) Sources of TFP growth in the Malaysian Islamic banking sector. The Service Industries Journal 29 (9): 1273-1291.
Wang CH, Hsu LC, Fang SR (2009) Constructing a relationship-based brand equity model. Service Business 3 (3): 275-292.
Yousafzai S, Pallister J, Foxall G (2009) Multi-dimensional role of trust in Internet banking adoption. The Service Industries Journal 29 (5): 591-605.
29
APPENDIX 1
FINANCIAL PERFORMANCE RATIO DEFINITIONS
1. ROA: return on assets (annualized). 2. ROE: return on book equity (annualized). 3. SPREAD: LOANRATE minus DEPRATE.
4. LOANRATE: interest and fees received on loans divided by total loans (annualized). 5. DEPRATE: interest paid on deposits divided by total deposits (annualized).
6. LOANS: total loans divided by total assets. 7. DEPOSITS: total deposits divided by total assets.
8. FEES: non-interest income divided by total assets (annualized).
9. NIEXP: total non-interest expense divided by total assets (annualized).
10.LABOREXP: salary and benefits expense divided by total assets (annualized). 11.FTES: number of full-time-equivalent employees divided by total assets. 12.WAGE: salary and benefits expense divided by FTES (annualized).
13.PREMEXP: expense on premises and equipment divided by total assets (annualized). 14.OTHEREXP: all “other” (i.e., non-labor and non-premises) non-interest expenses
divided by total assets (annualized).
15.OVERHEAD: book value of physical assets divided by total assets. 16.EQUITY: book value of equity divided by total assets.
17.GROWTH: asset growth rate (annualized).
31
APPENDIX 2
Exogenous Variables
ü %BUSSINESS: commercial and industrial loans divided by total loans.
ü %REALSTATE: real estate loans divided by total loans.
ü LOANS: total loans.
ü LOAN LOSS ALLOWANCE: allowance for loan and lease losses.
ü UNEMPLOYMENT: US rate of unemployment.