Human Sensory Assessment Methods in Urban Planning – a Case Study in Alexandria Benjamin S. Bergner, Jan-Philipp Exner, Martin Memmel, Rania Raslan, Dina Taha, Manar Talal, Peter
Zeile
(Dipl.-Ing. Benjamin S. Bergner, University of Kaiserslautern, CPE, bergner.benjamin@t-online.de) (Dipl.-Ing. MSc. Jan-Philipp Exner, University of Kaiserslautern, CPE, exner@rhrk.uni-kl.de)
(Dipl.-Math. Martin Memmel, German Research Center for Artificial Intelligence (DFKI GmbH), FB Knowledge Management, memmel@dfki.uni-kl.de)
(Eng. Rania Raslan, PhD Candidate, Department of Architecture, Faculty of Engineering, Alexandria University, rania.raslan@alexu.edu.eg)
(BSc. Manar Talal, Department of Architecture, Faculty of Engineering, Alexandria University, arch_m.talal@hotmail.com) (Dr. Dina Taha, Department of Architecture, Faculty of Engineering, Alexandria University, ditaha@alexu.edu.eg)
(Dr.-Ing. Peter Zeile, University of Kaiserslautern, CPE, zeile@rhrk.uni-kl.de) 1 ABSTRACT
With the advancement of digital and sensor technologies, architecture as well as planning domains are continuously endeavoring to reach new horizons. Various kinds of sensor networks are producing data, which can be relevant for urban environments. This data can concern a variety of fields such as infrastructure, mobility, or climate. Primarily, data should be gathered to supply people with information about their environment. With the help of this data and information, surrounding impacts, which influence peoples’ perception, can be identified. The main problem is the lack of comprehensive methods for measuring how people feel in their cities, and how they react on certain urban impacts. The main interest of urban planning should not be limited to infrastructures, buildings, and spaces, but rather concentrate on the people who use those buildings and spaces. It is therefore necessary to develop new methods for measuring “people’s feelings” in the city with specific indicators and parameters. The presented joint German Egyptian project between the University of Kaiserslautern and Alexandria University aims at exchanging experiences and knowledge in the field of Human Sensory Assessment and its potential use for urban planning. Technologies and methodologies for data collection, analysis, and visualization are part of the research. Within the project, emotional data has been gathered and analyzed for a walk of locals and foreigners on one of the main promenades of Alexandria. The goal is to study if and how different cultural backgrounds might affect the perception of the participants in different urban spaces.
2 INTRODUCTION
Improving the living conditions in our cities should be the main goal of every planner, developer, politician, and citizen. This research makes use of emerging technologies of geo- and mobile-data processing within the field of urban planning to efficiently collect and visualize qualitative data rather than only quantitative data. An example from the field of emission control explains the circumstances: A sound impact can be clearly classified in decibel labels with the help of sensors, but it is not quite clear to what extent sound is felt as personal burden. There are other parameters in a city like green areas or fountains that can positively influence the feelings in an urban environment. This project focuses on collecting information about cities with up-to-date applications and methods. It is also discussed if and how residents and foreigners respond differently to the same urban settings and situations. In this collaborative project of German and Egyptian University partners, the exchange of experiences and knowledge between both groups within the fields of urban planning and computer science was another important aim. Therefore, different state-of-art applications for data collection through geo- and mobile-data processing methods were developed and tested. Within the project, data has been gathered, analyzed, and compared for several urban spots in Egypt and Germany. The aim of the project was not only to test the data processing methods, but also to compare measured emotional stress in the given case studies. They enable to figure out the existence of indications, which can define to what extent different cultural environments can influence the perception of the surrounding situations.
3 STATE OF RESEARCH
Background research on using human sensory assessment methods in urban planning to identify “points of (negative) emotions” was already conducted by several research groups, starting with the “Mental Maps” by Kevin Lynch in his “Image of the city” (Lynch, 1960), where participants sketched a map out of their mind of the investigated city. Yet critics claim this technique needed drawing skills to produce the map. Results of
tracking people with the help of GPS technology were delivered by Phillips et al. (2001) and by Elgethum et al. (2003). The approach to digitally map feelings like fear in a city was introduced by Sorin Matei. In his “Mental Maps Concept”, he visualized for the first time feelings on a digital map and created a three-dimensional model for a better understanding of the environment in the city of Los Angeles (Matei et al., 2001). Unfortunately, he gave his approach the technical term “mental map” similar to Lynch. The difference is that Lynch created maps “out of the mind” and Matei made “emotional maps”.
As a result of the developments in recent years, from “ubiquitous computing” towards ”pervasive sensing”, small, connected, flexible sensors (like smartphones) build the basis for pervasive sensing approaches of urban areas (Martino et al., 2010). Goodchild refers to this phenomenon as "Citizens as Sensors" (Goodchild, 2007). Other authors use the term “People-Centric Urban Sensing” (Lane et al., 2006, Campbell et al. 2006) or simply “urban sensing” (Cuff et al. 2008). Citizens that want to be involved in a planning process, can now produce and deliver data, and thus are more in the focus of planning considerations. They act as active sensors for the urban environment. Based on the development of mobile communication techniques, Mark Weisers vision of “ubiquitous computing” comes true (Weiser 1991). This contextual shift, described as “urban sensing”, can be a trigger for a “fundamental transition from science and engineering into the realms of politics, aesthetics, interpretation, and motivation” (Cuff et al. 2008, p.1).
The first one who combined emotional data with the help of physiological parameters (skin resistance level) and GPS data was Christian Nold in his art project Biomapping (Nold, 2008 and 2009). Other examples for collecting “human sensor data” in cities were provided by the MIT Senseable City Lab (Martino et al., 2010 and Resch et al., 2011). Characteristical features and peculiarities of the Geoweb are “the development and changing nature of map-based data ups” and the explanation of “the basic concepts behind map mash-ups, how geospatial data gathering and analysis has changed and how new technologies and standards are impacting on this” (Batty et al. 2010, p. 1089).
4 METHODOLOGY AND TECHNICAL SPECIFICATION
With the help of the psycho physiological monitoring, a practicable method was created to identify geo-referenced stress reactions in a city (Zeile et al. 2009, Bergner 2010, Zeile et al. 2011, and Exner et al. 2012). The experimental research consistently shows that emotional reactions are associated with changes in specific physiological parameters, like skin conductivity and skin temperature, resulting from the activity of the autonomic nervous system (Kreibig, 2010). In several projects, the method, the analysis, and the workflow were tested in pre-studies (Taha et al 2012a and Taha et al 2012b), or tailored to a specific target group (Bergner & Zeile 2012). However, the analysis is still to a large part carried out manually, which consumes a large amount of time. One task was to speed up the workflow by implementing some automated analyses, with the aim to improve quantitative and qualitative test methods concerning human sensory assessment. Furthermore, another research task was to figure out the possibilities for identifying a difference of participants’ measured emotions, especially based on their country of origin and cultural background. The main focus is to find efficient ways to analyze the difference between participants from different cultural backgrounds, both in local and foreign environments. In order to do this, the study took place at the Eastern Harbour/Cornice in Alexandria.
4.1 Scientific Approach
Human sensory assessment is based on the usage of body sensors for measuring human physiological data (in this case skin conductivity and skin temperature) in real-time. Besides the physical activity, reasons for changes in physiological data are found in psychological processes (Kreibig, 2010). Trigger is a humans’ emotion in context of their current environments. In the research project at hand, the sensor wristband “BMS Smartband” (Bodymonitor Systeme, 2013) was utilised. The wristband records physiological data in a TXT-file, which can be analyzed in a further step to find emotion patterns. The synchronization of the resulting emotion data with geo positions gathered by means of mobile GPS trackers is obligatory. The participants were also equipped with cameras for linking the collected emotion data with the perceived surrounding environment.
In previous studies, the transformation of raw physiological data to resulting emotion data (linked with geo position) was a time intensive and not fully automated process. Combining different processing steps in a defined workflow, and especially the reduction of complexity regarding the exchange of data between
different software components, was an elementary success of the project. Furthermore, whole data sets can directly be linked with individual video data of the participants to separate identified emotion sequences. A qualitative analysis of the trigger for specific emotions can thus conveniently be conducted afterwards for every study participant. Finally, the resulting data can automatically be formatted to allow the generation of heat maps that visualize identified stress hot spots in urban spaces.
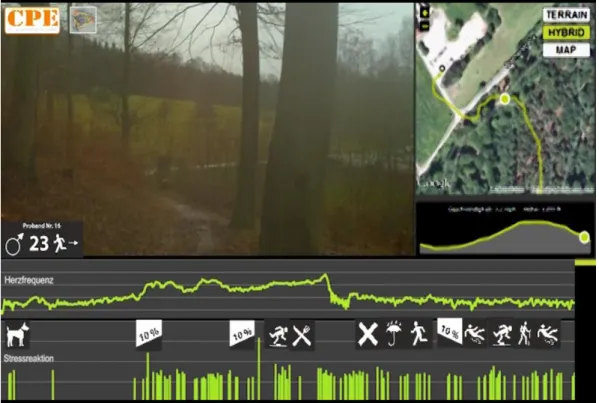
For an identification of the original triggers of stress in these urban areas, a closer look to the individual runs is essential. Therefore, it was necessary to create a new workflow of analyzing the corresponding movie files, in which all the tracks in the line of sight of the respective participant were recorded. In earlier projects, the analysis of the movies was manually carried out by comparing the timestamps of the movie, the GPS tracker and the timestamp of the Smartband which delivers the data of the individual stress level of each participant. For the visual comparison of the results, all datasets were integrated in a movie timeline (Figure 1). As a result, it is possible to synchronize heart rate, skin conductance, and stress responses with GPS and the video signal. In addition, the visual detection of individual impacts on stress – like bad road conditions, orientation problems etc. – is possible (compare Exner et al. 2012).
Fig. 1: Retrospective individual video analyses of a test run during a hiking tour of one proband (Exner et al. 2012) 4.2 Technical Specification
One of the main tasks was to develop tools that facilitate the carried out tasks: (1) Automatically synchronizing the datasets of GPS-Tracker, camera, and Smartband, and (2) Identification of the stress phases of the track, and automatic extraction of movie snippets of the corresponding time periods. Based on this, the identified stress points have to be stored in a geo-database and then visualized. This task was done to aggregate all the individual stress points in a so called “stress hotspot heatmap”, in which all the individual stress spots were combined by a point density analysis (similar to RADAR Sensing, compare Zeile et al. 2012). Some of these tasks can be realized using the RADAR platform (Memmel & Groß 2011), which is based on the ALOE framework (Memmel & Schirru 2007).
The data processing was mainly realized using Perl scripts that can be applied on any common operating system to provide the flexibility to also allow a web-based processing of data in the future. Perl is a general-purpose, interpreted programming language that offers powerful means to analyze and manipulate data, especially by means of regular expressions. Using this as basis, the tools could quickly be developed, and required adaptation request could instantly be considered in situ. To merge all the different data sources, the data has to be synchronized on a common frequency. In our studies, a one-second span was used. In case there are unwanted time gaps in the data provided by the GPS tracker, a further preprocessing step can be conducted by applying the “GPS Interpolation” script. Using the generated CSV as an input, this script
automatically interpolates missing data by taking into account the last and next known position and timestamp of an identified gap.
Once the data is correctly aggregated, a software called “StressPhaseIdentifier” can be applied to identify stress phases based on a previously conducted analysis on changes of humans’ physiological data. The script provides an enhanced CSV file with information about the stress phases, a short overview of all identified stress phases, and statistical information such as the average length of a phase. In addition, the script can also automatically extract corresponding video snippets when the user provides a respective file. In this case, an offset has to be specified to match the timestamps of GPS and video data. The extraction of snippets was realized using the “ffmpeg library” that is available on any common UNIX-based system. Finally, the file with identified stress phases can be used as input for the “GenerateHeatmapInput” component that will automatically generate a JSON representation usable as input for the generation of heatmaps within the RADAR system (Figure 2).
Figure 2: An exampe for a heat map of aggregated stress reactions in the market and old town area, Alexandria – Egypt 5 CASE STUDY: EMOTIONAL MAPPING IN ALEXANDRIA
This study is a continuation of a previous test carried out in 2011 (Taha, Raslan, & Bergner, 2012b). Both tests took place on the promenade along the Eastern Harbor in Alexandria. The Eastern Harbor Promenade, or as called “El Cornice” by Alexandrians, is an average of a 4.0 km stretch along the water front (3.87 km on the sea side and 4.30 km on the inner side), from the Citadel on its west end to the Bibliotheca Alexandrina on the east (Figure 3). It is a path heavily used by pedestrians and vehicles alike, as well as for locals and city visitors. Characteristics for the inner side of the path are that it is almost completely planted with palms or trees, and that there exists almost 40 intersections without crossing aids along the path. The outer (waterfront) side is only partially planted with palm trees in its first half, and again towards the end of the path, across the Bibliotheca Alexandrina. There exists only two minor intersections along this side of the walk by the recreational zone is section four. The carried out study aims at drawing two comparisons: The first is between both sides of the promenade, and how they differently affect pedestrians, while the second comparison is drawn between locals and foreigners, to study if and how background, culture, or previous acquaintance with the place might influence the emotions of pedestrians.
For this general comparison of the test runs and the collected emotion data of the study participants, the analysis was carried out with the statistical indicators “average time span between stress reactions” and “average duration of stress reactions”. With the help of these indicators, the differences between the test groups was figured out in a statistical approach.
Figure 3: The Study Area with Street Sections along the Path 5.1 Pre-study
A similar study was carried out one year prior to this study with only two Egyptian female participants. The previous study took place on Thursday, November 3rd 2011, around 8:30 am. The exemplary results of last year’s study can be found in (Taha, et al., 2012b) and are recapitulated as hypothesis for future research as follows: Passing cars don’t affect the participants. Shady areas as well as sunny parts of the course have no influence on people’s wellbeing in November weather conditions. The area with high volume of traffic area around the monument of unknown soldier was expected as a stress hot spot, but in this experiment, there was no change in skin response of the participant. The wider perception of the waterfront participant involves more spatial impressions, more stress signals are measured here.
5.2 Study Eastern Harbour
The experiment took place on Sunday, November 18th 2012 around 8:30 am. Both studies were executed on normal working days. It started at the west side of the Eastern Harbor (green node) and ended almost 45 minutes later at Bibliotheca Alexandrina at the east side of the Harbor (blue node). The weather conditions were pleasant that day, with a clear sky and moderate temperature. A group of seven persons participated in this test: Three Egyptian females and four German males. Each participant was equipped with one video camera, one GPS tracker, as well as one SMART-Band. Three participants took the outer side of the path (the one closer to the waterfront), while four participants took the inner path (the one adjacent to the buildings). Each group included locals as well as foreigners. Besides the testing of the above mentioned new workflow and techniques, another task in this set-up was to re-examine the hypotheses of the above mentioned study. Especially the points if there are more impacts on the waterfront side and how people feel in the high dense traffic areas should be proofed, because these results from the former study were unexpected at that time. Another interesting task was, if there is a speed reduction of the urban flaneurs, if the have to cross small intersections and are there differences between locals and foreigners.
5.3 Findings and Analysis
5.3.1 Speed, Stress Reaction durations and Intervals
When comparing both sides of the promenade, it is noticeable that participants taking the outer and longer side of the walk had more uniform speed and were relatively faster than those taking the inner side (4.65 km/h and 4.14 km/h), who had bigger variations in their speed (Table 1, Figures 4 & 5). The average speed of both groups was around 4.5km/h, which is, accordingly to literature, a normal average speed for pedestrians (Knoblauch, Pietrucha, Nitzburg, 2007). Stress reactions on the outer side were less in number (127.75 vs. 146.75), longer in duration (5.6 vs. 4.9 sec) and with bigger time span intervals (16.99 vs. 13.58 sec) than those on the inner side of the promenade (Table 1).
Average Duration of Stress Reaction (sec)
Average Time Span between Stress Reactions (sec) Average Speed (km/h) Number of Reactions Outer Path 5.60 16.99 4.65 127.75 Inner Path 4.90 13.58 4.14 146.75 Foreigners 5.12 13.80 4.24 150.75 Locals 5.38 16.77 4.45 123.75
Table 1: Average stress analysis indicators based on walked path and nationality
When comparing the readings of foreigners and locals, it is noticed that the speed discrepancy might be negligible, where it varied between 4.24 km/h for foreigners, and 4.45 km/h for locals. As for stress reactions, foreigners demonstrated a bigger number (150.75 vs. 123.75), slightly shorter duration (5.12 vs. 5.38 sec), and smaller time span intervals (13.8 vs. 16.77 sec) between stress reactions than locals.
Figure 5: Speed and stress response by time for two participants on the inner side of the promenade
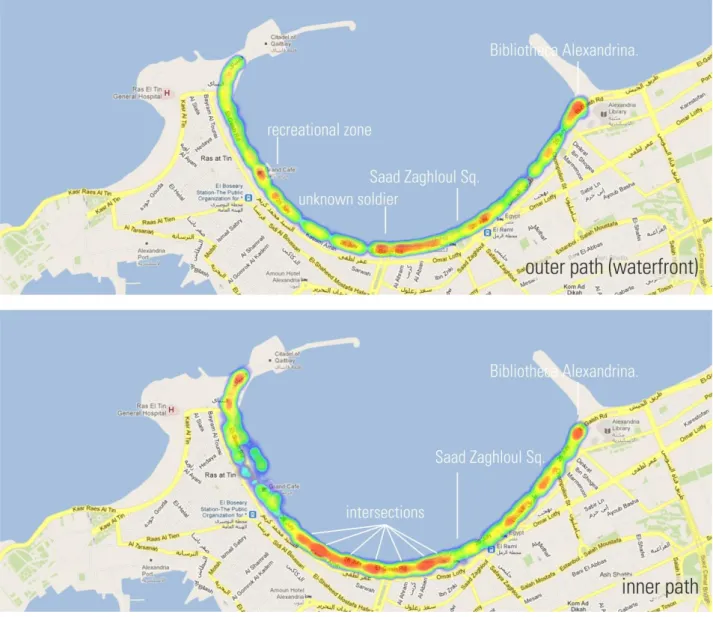
Figure 6: Heat maps for outer path vs. inner path along the waterfront
5.3.2 Stress Reactions Locations
As evident from charts, heat maps, and tables (Figures 4, 5, and 6 and Table 1), stress reactions were present all through the path on both sides- although not uniform. Coinciding with our expectations, however contradicting with a previous study carried out on the same path (Taha, et al., 2012b). More stress reactions were sensed on the inner side of the path than on the outer side. Along the outer side of the path, intense
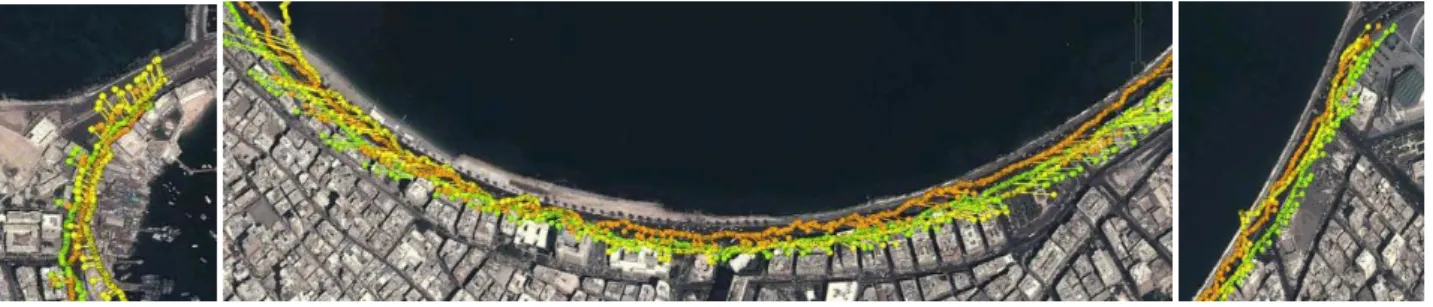
stress reactions were sensed when participants had to cross the street by the recreational zone at point four, and by crossing the major Cornice Avenue by Bibliotheca Alexandria towards the end of the walk. Another high intensity stress zone can be found through the middle part of the path between the French Gardens and Saad Zaghloul Square (Figures 6 & 7).
Figure 7: Locations of intense stress reactions along the outer path. (Left) Recreational area, (middle) between French Gardens and Saad Zaghoul Square and (right) crossing El Cornice to reach endpoint at Biblioteca Alexandrina on “inner path”
As for the inner side of the path, intense stress reactions are higher in number and cover a larger part of the path. Again, they occur at street intersections (Figures 6 & 8), which significantly occur more often on this side of the path, as well as at sections with bad or missing pavements, where the study participants had to walk side by side with passing-by vehicles.
Figure 8: Locations of intense stress reactions along the inners path. (Left) Citadel area, (middle) between Court House area and Saad Zaghloul Square, (right) Bibliotheca Alexandrina
Through the middle part of the path, more vehicles were passing by, and more public trasportation micro-busses were stopping to let passengers in and out of the cars. This caused a higher level of noise and crowdiness than on both end of the path, and caused higher number in stress reactions during this part and on both the inner and the outer sides of the path.
One of the questions this project is trying to answer is if and how locals and foreigners respond differently to the same urban settings and situations. From the preliminary results of this carried out test, it is evident that foreigners faced a higher number of stress reactions than locals (Table 1). These were distributed along the whole path, although in higher intensities in locations of major street crossings, high densities of pedestrians and vehicles and in noisy zones. On the other hand, locals faced a less number in stress reactions, and were concentrated in the middle part of the path, where high levels of noise and dense numbers of vehicles and pedestrians were present (Figure 9).
5.4 Results
The results of this study, although to a certain limit, contradict with those of the year before (Taha, et al., 2012b), but nevertheless they are more reasonable and cope with the initial expectations made for stressful situations within urban environments. Major intersections, like the intersections at the Unknown-Soldier Monument represent two of the major streets with a high traffic density, where the traffic situation gets often quite chaotic, even for locals. The first intersection – walking direction from the right side of the image) to the left side of image) – is a hub for all sorts of public transportation: taxis, mini-buses and larger buses. While crossing this intersections, the study participants had to take care of mini-buses parked at the intersection, loading and unloading passengers, as well as other vehicles coming from the main street, taking a right-turn (coming from the blind spot) into the side-street. On the second intersection, participants had to dodge vehicles, since there are no means to slow vehicles down by traffic signals or speed tables. Both intersections caused stress situations for both foreigners as well as locals (Figure 10).
Figure 9: Heat maps for foreigners vs. locals along both sides of the path
Figure 10: Equal Stress responses at the crossings of the Unknown Soldier Monument for locals (red & orange) and foreigners (green & yellow)
Figure 11: Increased number of stress responses for foreigners (green, yellow & blue) than for locals (red, orange & dark red) at minor crossings, as well as at the Cornice Avenue crossing
Other situations were pretty different between foreigners and locals. Crossing minor intersections on the inner side of the path presented almost no stress reactions for locals, while they presented stressful situations for foreigners. Another evident situation was the crossing of the Cornice Avenue across Bibliotheca Alexandrina. For a foreigner participant, the crossing of the avenue was an extremely stressful situation, where more than 20 stress reactions were measured during the process of deciding and actually crossing the avenue. On the other hand, for the local participant, only three stress reactions were measured (Figure 11). At intersections, where it was hard to anticipate from which direction vehicles are coming, or when they are coming from a blind spot of the study participants, both foreigners and locals faced almost the same level of stess. While at other intersections, where locals might be accustomed to crossing streets where no street signals are present, foreigners show a higher level of stress than locals.
Unlike previous measurements (Taha et al., 2012b), there were more stress responses on the sidewalk of the inner path than on the sidewalk near the waterfront in this study. This concurs with our initial assumptions that having to cross street intersections, and passing by sections where the sidewalk is blocked by cars or has bad or missing pavements, would cause more stress situations. Hence in this study, stress reactions were recorded all through the path on the inner side, while they were mainly recorded in outer side only when noise was caused through the middle part of the path. This doesn’t refute the hypothesis that a wider perception angle might cause higher stress reactions (compare Taha et al., 2012b). Finally, the authors are aware of the fact that there is a need for further studies with more participants with different local circumstances for further validation of the given hypothesis.
6 CONCLUSION
The presented method of human sensory assessment in urban planning shows a high potential for a better understanding of urban space and the perception of its users. In the case studies, it was researched if different cultural backgrounds influence the perception of space. Besides the mentioned restraints relating the resilience of the gathered data, the results indicate that being in one’s native environment or in an estranged one, does not influence how Egyptians or Germans experience their surroundings. In general, German participants have shorter stress reactions than the Egyptian participants, but the frequency of stress reactions of the German participants is higher. Individual stress reactions can now be identified in an efficient way in the optimized workflow. To achieve more quantitative results for statements about urban environment, a higher number of participants is needed. The next step in research will be the combination of the fields “Human Sensory Assessment” and “CAVE-Technologies” (Cave Automatic Virtual Environment – Technologies) for an objective verification of the gathered data and for an exclusion of impacts, which do not belong to the “real” built and architectural environment. This can be applied to interior spaces as well as open urban spaces. Users can navigate through spaces in real-time to simulate a virtual tour. With this setting, it might be possible for the first time to create an urban environment in which the user only reacts on the (virtual) built environment. This means, a laboratory situation, free of external influences will be created.
As a conclusion, the presented method repertoire has a high chance to become an important component for urban planning and sociological analysis in perception of space. It can give planners tools for a more comprehensive view of interdependencies between people and their urban environment.
7 ACKNOWLEDGEMENT
The authors are thankful for the support of the German-Egyptian-Scientific-Program (GESP), funded by DAAD and STDF during the research. In addition, the authors would like to express their gratitude to the German Research Foundation (DFG – Deutsche Forschungsgemeinschaft) for supporting the project “Development of methods for spatial planning with GeoWeb and Mobile Computing (Städtebauliche Methodenentwicklung mit GeoWeb und Mobile Computing)”.
8 REFERENCES
BATTY, M., SUCHID, A. CROOKS, A., HUDSON-SMITH, A., JACKSON, M., MILTON, R, MORLEY, J.: Data mash-ups and the future of mapping. Tech Watch. Bristol, United Kingdom, 2010.
BODYMONITOR SYSTEME: Bodymonitor System. Available in <http://bodymonitor.de> Accessed in 12 February 2013. CAMPELL A.T., EISENMANN S.B., LANE N.D., MILUZZO E., PETERSON R.A.: People-centric urban sensing [Internet]. In:
Proceedings of the 2nd annual international workshop on Wireless internet. Boston, Massachusetts: ACM, p.18, 2006. CUFF, D., HANSEN, M. & KANG, J.: Urban Sensing: Out of the Woods. In: Communications of the ACM, 51(3), p. 24-33, 2008. ELGENTHUN, K., FENSKE, R. A., YOST, G. and PALCISKO, G. J. (2003). Time-location analysis for exposure assessment
studies of children using a novel global positioning system instrument, Environmental Health Perspectives, Vol. 111, No. 1, 115-122.
EXNER, J.-P., BERGNERr, B., ZEILE, P. und BROSCHART, D.: Humansensorik in der räumlichen Planung, in: Strobl, J. ; Blaschke, T. ; Griesebner, G. (Hrsg.): Angewandte Geoinformatik 2011, p. 690-699, Berlin – Salzburg 2012. GOODCHILD, M. F.: Citizens as Sensors: The World of Volunteered Geography, Geo- Journal, 69 (4), p. 211-221.New
York/Heidelberg, 2007.
KNOBLAUCH, R., PIETRUCHA, M., & NITZBURG, M.: Fields Studies of Pedestrian Walking Speed and Start-Up Time. TRB, National Research Council, Vol. 1538, pp. 27-38. Washington. DC, 2007.
KREIBIG, S. D.: Autonomic nervous system activity in emotion: A review. Biological Psychology, 84 (3), p. 394-421, 2010. LANE ND, EISENMANN SB, MUSOLESI M, MILUZZO E, CAMPBELL AT. Urban sensing systems: opportunistic or
participatory? , in: Proceedings of the 9th workshop on Mobile computing systems and applications. Napa Valley, California: ACM; 2008, p. 11-16. Available in <http://portal.acm.org/citation.cfm?id=1411763>. Accessed in 12 February 2013.
LYNCH, K. (1960) The Image of the City, MIT Press, Cambridge, MA.
MARTINO, M., BRITTER, R., OUTRAM, C., ZACHARIAS, C., BIDERMANN, A.: (2010): Senseable City: Digital Urban and Modelling.
MATEI, S., BALL-ROKEACH, S. and QIU, J. (2001): Fear and misperception of Los Angeles urban space: A spatial statistical study of communication-shaped mental maps, Communication Research, Vol. 28, No. 4, 429-463.
MEMMEL, M., SCHIRRU, R.: ALOE – A Socially Aware Learning Resource and Metadata Hub. In Martin Wolpers, Ralf Klamma and Erik Duval (Eds.): Proceedings of the EC-TEL 2007 Poster Session. CEUR workshop proceedings, 2007. MEMMEL, M.; GRO? F.: RADAR – Potentials for Supporting Urban Development with a Social Geocontent Hub, in: Schrenk, M.;
Popovich, Vasily, V.; Zeile, P. (Eds.): Proceedings REAL CORP 2011, p. 777-784, ISBN 978-3-9503110-1-3, Schwechat, (Austria), 2011.
NOLD, C. (2008) Biomapping, Available in <http://www.biomapping.net/> Accessed in 25 February 2011
NOLD, C. (2009) Emotional Cartography – Technologies of the Self, Published under Creative Commons License, ISBN 978-0-9557623-1-4S. Available in <http://emotionalcartography.net/EmotionalCartography.pdf> Accessed in 25 February 2011
RESCH, B., MITTLBÖCK, M., KRANZER, S., SAGL, G., HEISTRACHER, T., BLASCHKE, T. (2011) „People as Sensors“ mittels Personalisierten Geo-Trackings, Salzburg, in: Strobl, J.; Blaschke, T.; Griesebner, G. (Hrsg.): Angewandte Geoinformatik 2011, Berlin – Salzburg, 682-687.
TAHA, D., RASLAN, R., BERGNER, B. S.: The Egyptian Revolution from the Perspective of an Urban Planner: Demonstrations on the Streets of Alexandria, Egypt, in: Schrenk M., Popovich V., Zeile P., Elisei, P. (Eds.): Proceedings REAL CORP 2012, p. 851-858, Schwechat (Austria), 2012a.
TAHA, D.; RASLAN, R.; BERGNER, B. S.: Humans as sensors to enhance the Built Environment: a Case Study of the Eastern Harbor, Alexandria, Egypt; in: Schrenk M., Popovich V., Zeile P., Elisei, P. (Eds.): Proceedings REAL CORP 2012, p. 367-375, Schwechat (Austria), 2012b.
WEISER, M. (1991) The computer for the twenty-first century. Scientific American, 9/1991, 94.
ZEILE, P., EXNER, J.-P. and STREICH, B. (2009) Human as sensors? The measurement of physiological data in city areas and the potential benefit for urban planning. Proceedings 11th International Conference on Computers in Urban Planning and Urban Management. Centre of Urban Studies and Urban Planning, The University of Hong Kong, Hong Kong. ZEILE; P.; MEMMEL, M.; EXNER, J.: A New Urban Sensing and Monitoring Approach: Tagging the City with the RADAR
SENSING App.; in: Schrenk M., Popovich V., Zeile P., Elisei, P. (Eds.): Proceedings REAL CORP 2012, p. 17-25, Schwechat, (Austria), 2012.