Common Ownership and Corporate Social
Responsibility
August 12, 2019
Abstract
This paper studies the effect of common ownership on corporate social responsibility (CSR). We find that common ownership is positively associated with a firm’s social performance. Additional tests strength the causal interpretation of the results. The empirical evidence is consistent with the predictions from a model in which CSR serves as a strategic tool for a firm to strengthen its product market position.
1
Introduction
Corporate social responsibility (CSR) becomes increasingly important for corporations in recent years (Hong, Kubik and Scheinkman, 2012). For example, in 2013, Coca-Cola set the goal of reducing its carbon footprint by 25% by the year 2020. To achieve this goal, Coca-Cola improved its supply chain and invested in trucks that are powered by other fuels in 2014. But what drives firms to be socially responsible? Prior studies identify important determinants such as financial constraints and corporate governance (Hong et al., 2012; Cheng et al., 2016). In this paper, we contribute this strand of literature and examine how a firm’s social performance is affected when it shares common owners with other industry peers, a phenomenon referred as common ownership.
Common ownership in the U.S. economy increases dramatically in the past three decades (Backus, Conlon and Sinkinson,2019). This secular trend has attracted attentions from both academia and policy makers. The current discussions mainly focus on the anti-competitive effect of common ownership and policy remedies have been proposed (Azar et al.,2018,2019; Posner et al., 2017). However, less attention has been devoted to the effects of common ownership on corporate policies, which could in turn affect the structure of product market. Our paper tends to further our understanding in this area.
To examine the relation between common ownership and a firm’s CSR policy, we first develop a theoretical model and then provide empirical evidence. In the model, we focus on the strategic role of CSR (Baron, 2001; Planer-Friedrich and Sahm, 2019). There are two firms in the economy and they are linked through common owners. They produce homogeneous goods and engage in Cournot competition. For each firm, its CSR policy is modeled as the weight that its manager puts on consumer surplus in addition to profits accrued to shareholders in her objective function. The competition between the two firms is modeled as a two-stage game. In the first stage, each manager simultaneously commits to a CSR policy and, in the second stage, each manager simultaneously makes the strategic output decision. The subgame perfect equilibrium (SPE) shows that an increased common
ownership leads a firm to behave more socially responsible. This prediction also holds in oligopoly competition and common ownership is also predicted to have a larger impact on a firm’s social performance when the product market is more competitive.
In the model, a firm’s CSR policy serves as a commitment device to expand its output aggressively in the second stage. If a firm chooses a higher level of CSR, then its rival’s output would be reduced ceteris paribus since quantities are strategic substitutes. A higher common ownership has two opposing effects. On one hand, it increases the marginal cost of improving a firm’s CSR policy since the manager puts more weight on its rival’s profit in her objective function. On the other hand, it also increases the marginal benefit of behaving more socially responsible as a firm’s commitment to expand output becomes more credible, resulting in an increase in its own profit. In equilibrium, common ownership has a larger impact on the marginal benefit than the marginal cost. Therefore, a firm’s optimal level of CSR is higher when it is more linked to industry peers through common owners.
We then test the model predictions. We measure a firm’s social performance with the data from MSCI ESG STAT database. We focus on the ratings for the categories of environment, community, human rights, diversity, and employee relations. We follow Lins, Servaes and Tamayo (2017) and construct a time-series consistent measure for a firm’s CSR policy. Our main measure of common ownership is the average weight that a firm puts on its industry rivals’ profits (Backus, Conlon and Sinkinson, 2019). We use the 3-digit SIC code as the definition of an industry in our main specification.
Our findings are several folds. First, consistent with the theoretical prediction, we find a strong positive association between common ownership and a firm’s CSR performance. Specifically, a one-standard-deviation increase in the measured common ownership (0.171) is associated with 0.030 increase in the CSR score, representing a 6.24% increase relative to its standard deviation (0.477).
Second, we examine which dimensions of a firm’s social performance are more affected by common ownership. We first estimate how common ownership affects the strengths and
concerns of CSR, respectively. The results show that a firm significantly improves its CSR strengths when the measured common ownership increases. However, common ownership has little effects on CSR concerns. We then examine how common ownership affects each category of CSR individually. We find that a higher common ownership is associated with a higher score for all of the five CSR categories that we consider.
Third, our results are robust to alternative industry definitions, common ownership mea-sures, and empirical specifications. In the first set of tests, we use the 4-digit CRSP SIC code or the Hoberg-Phillips Text-based Network Industry Classifications (TNIC) code (Hoberg and Phillips, 2010, 2016) to construct our main common ownership measure. The posi-tive association between common ownership and a firm’s CSR score is robust. We then show that our results are robust to alternative measures of common ownership including the newly developed measure in Gilje, Gormley and Levit (2019). Finally, our result is also ro-bust to controlling for additional firm-level characteristics or the industry×year fixed effects. Adding this set of fixed effects controls for any shock, including the market structure, in an industry-year cell and further mitigates omitted variable concerns.
Fourth, we examine how the effect of common ownership on CSR varies with product market competition. We define a 3-digit SIC industry to be competitive if its HHI is in the bottom tercile or the number of firms in the industry is in the top tercile in a year. The results show that, compared to firms in non-competitive industries, the estimated marginal effect of common ownership on a firm’s CSR score is higher for firms in competitive industries. The empirical evidence is consistent with the prediction from an oligopoly model.
Finally, we follow Azar et al. (2018) and use the merger between Blackrock (BLK) and Barclays Global Investors (BGI) as a natural experiment to strengthen the causal inter-pretation of the empirical results. In particular, we use a difference-in-differences (DiD) specification to estimate how this merger affects a firm’s social performance. For each firm in the sample, we calculate the implied increase in the common ownership from a hypo-thetical combination between BLK and BGI one year before the actual merger. A treated
(control) firm is defined as the one with an implied increase in the common ownership falling in the top (bottom) tercile. The DiD estimations show that, compared to control firms, the CSR performance for treated firms increase more after the merger. The dynamic treatment effects also suggest that the parallel assumption is unlikely to be violated in our sample.
Our paper is related to the extant literature of CSR. Prior studies have documented several important determinants of CSR. Hong, Kubik and Scheinkman (2012) show that financial constraint drives CSR investment and the evidence supports the thesis that corpo-rations do good when they do well. Cheng, Hong and Shue(2016) show that CSR investment reduces when a firm’s corporate governance improves. Their interpretation of the results is that CSR spendings are partly due to agency problems. Dyck, Lins, Roth and Wagner (2019) use data from 41 countries and find that institutional investors shape firms’ envi-ronmental and social performance. In particular, they find that firms with higher levels of institutional ownership are more socially responsible. Flammer(2015) examines the effect of product market competition on CSR. By utilizing large import tariff reductions in the U.S. manufacturing sector, she finds that U.S. manufacturers increase their social performance as a response. Different from Flammer (2015), we study how ownership structure affects CSR after conditional on the product market structure. Our paper contributes to the literature by showing that common ownership among industry peers is an important driving force for a firm’s social performance.
Our paper is also related to the literature on examining the real effects of common owner-ship. Schmalz(2018) provides a summary of the recent development. Azar et al. (2018) and Azar, Raina and Schmalz(2019) document the anti-competitive effects of common ownership in the airline and banking industries, respectively. However, several papers raise concerns about the results including Dennis, Gerardi and Schenone (2018), Kennedy, O’Brien, Song and Waehrer(2017),Gilje et al. (2019),Koch, Panayides and Thomas(2019), andGramlich and Grundl (2017). Antón, Ederer, Gine and Schmalz (2018a) show that common owner-ship reduces the sensitivity of executives’ wealth to their own firms’ performance. The same
group of authors also document that a higher level of common ownership improves firms’ incentives to innovate (Antón, Ederer, Gine and Schmalz, 2018b). Their evidence confirms the theoretical predictions inLópez and Vives (2019). Eldar, Grennan and Waldock (2019) document the bright side of common ownership as well and show that startups benefit from investors that hold stakes in competitors. Our paper contributes to this emerging literature by showing that common ownership also alters firms’ incentives to invest in CSR, an impor-tant corporate strategic decision. Our results are consistent with the theoretical predictions from a model in which CSR serves as a strategic tool to strengthen a firm’s position in the product market. Our evidence furthers our understanding on how common ownership affects corporate strategic behavior, which could in turn affect the product market competition in the long-run.
The remainder of this paper is organized as follows: Section 2 describes the theoreti-cal model. Section 3 discusses the data sources and sample selection. Section 4 contains empirical specification and estimation results, and Section 5 concludes.
2
A Motivating Model
In this section, we present a simple model and derive a firm’s optimal CSR policy in the presence of common ownership. Our model builds on the ones inPlaner-Friedrich and Sahm (2019) and López and Vives (2019). Throughout the model, we assume that there are two firms producing homogeneous goods and engage in Cournot competition.
Consumer Utility: We assume that there is one representative consumer in the
econ-omy and her utility of consuming goods 1 and 2 is u(q1, q2) =a(q1+q2)−2b(q12+q22+ 2q1q2).
qi is firmi’s output quantity consumed by the consumer. The consumer choosesq1 andq2 to
maximize her utility after paying the prices for the goods. The optimization problem yields the inverse demand function: p = a−b(q1 +q2). The consumer surplus in the society is
Product Market Competition: For each firm, we assume that the marginal cost of production, c, is the same for both firms. The profit of each firm i is givenπi = [a−b(q1+
q2)−c]qi. We assume that the parameters a, b, and c are unknown to each manager ex
ante but are revealed to her when she makes the strategic output choice. This assumption is necessary to justify the existence of the equilibrium that deviates from the usual Cournot equilibrium (Fershtman and Judd, 1987) .
Ownership: The ownership structure in the economy closely follows the one in López
and Vives (2019). We assume that there are S≥2 investors. Each firm has a controlling shareholder and each investor is assumed to hold α fraction of the other firm’s outstanding shares. For firmi, we denote γis and βis as the voting share and cash-flow share of investor
s. We denote Πs as the profits accrued to shareholder s. We further assume that the
proportional control assumption holds, that is, γis =βis. Then the profits accrued to all of
the shareholders in firmi are:
X ∀s γ1sΠs = X ∀s γ1s( X ∀g βgsπg) = X ∀s γ1sβ1sπ1 + X ∀s γ1sβ2sπ2 ∝π1+ P ∀sβ1sβ2s P ∀sβ12s | {z } λ12 π2 (1)
Given the assumption that the share holdings are symmetric in the economy, then λ = λ12 = λ21 = 2α[1
−(S−1)α]+(S−2)α2
[1−(S−1)α]2+(S−1)α2 . λ is interpreted as the common ownership between these
two firms and we assume that 0≤λ <1.
Model Setup: We consider a two-stage game:
(1) In the first stage, the risk-neutral managers of firms 1 and 2 simultaneously commit to a certain level of CSR, θ1 and θ2, and a Nash equilibrium describes the outcomes. Each
manager maximizes the profits accrued to the shareholders of her firm: E[πi+λπj]. The
expectation is taken with respect to the joint distribution of the parameters a, b, and c. When making the CSR choices, each manager anticipates that the quantity chosen in the second stage is a function of both θ1 and θ2.
(2) In the second stage, parametersa,b, andcare revealed to both managers. The levels of CSR committed by both managers are public information. The two managers simultaneously choose the output quantities q1 and q2 to maximize their objective functions. If manager i
commits CSR to θ1 in the first stage, then her objective function is πi+λπ−i +θiCS. The
optimalq1 and q2 are described in a Nash equilibrium.
Model Solution: We solve for the subgame-perfect equilibrium (SPE) by backward
induction. In the second stage, given θ1 and θ2, manager i’s maximization problem is as
follow.
Max
qi
(a−bQ−c)(qi+λq−i) +θibQ2/2
subject to Q=q1+q2
The F.O.C. is given as:
−bqi−bλq−i+ (a−bQ−c) +θibQ= 0 (2)
Then the response function of qi is given as
qi =
(a−c)−b(λ+ 1−θi)q−i
(2−θi)b
(3) Equation (3) shows that, when λ > 0, each firm’s response function moves inward com-pared to the case in which there is no common ownership. As a result, a higher common ownership facilitates the cooperation between two firms, resulting in a lower equilibrium ag-gregate output and a higher equilibrium price. Summing equation (2) over i on both sides, we can get the aggregate output Q as:
Q= 2(a−c) b(3−P2
i=1θi +λ)
(4) Substituting equation (4) into equation (3), then we have:
qi = 1 1−λ × a−c b × 1 +θi−θ−i−λ 3−Pn i=1θi+λ (5) πi = 1 1−λ × (a−c)2 b × (1 +θi−θ−i −λ)(1−Pni=1θi+λ) (3−Pn i=1θi +λ)2 (6) We now move back to the first stage of the game and solve for the optimal {θj}2i=1. For
manager i,θi is chosen to maximize E[πi+λπ−i], anticipating thatqi is a function of{θj}2i=1
and takingθ−i as given. The expectation is take with respect to the joint distribution of the
parameters a, b, and c. We denoteE[(a−bc)2] as µ.
Max θi E[πi+λπ−i] =µ× [1 +λ−P2 i=1θi][1 +λ+θi−θ−i] (3−P2 i=1θi+λ)2 ∝ (1−θ−i+λ) 2−θ2 i (3−θ−i−θi +λ)2
The F.O.C is given as:
−θi(3−θ−i+λ) + (1−θ−i+λ)2 = 0 (7)
Equation (7) shows that the usual Cournot outcomes do not arise in the equilibrium. If manager 2 chooses θ2 to be zero, then manager 1 always has incentives to choose θ1 >0 as
a response. We consider the symmetric equilibrium, θ∗i =θ∗. Substituting θ∗ into equation (7), we have:
2θ∗2−(3λ+ 5)θ∗+ (1 +λ)2 = 0
Proposition: In the SPE of the two-stage game between two symmetric firms, the
opti-mal level of CSR, θ∗, is: (1)
θ∗ = (3λ+ 5)−
√
λ2+ 14λ+ 17
1
(2) Increasing in common ownership, λ.
∂θ∗ ∂λ ∝3
√
λ2+ 14λ+ 17−(λ+ 7)>0
In the model, CSR serves as a strategic tool for a firm. If a manager commits to a higher level of CSR in the first stage, then she would behave more aggressively when making the strategic choice in the output market. Since the quantities are strategic substitutes, ceteris paribus, an increase in a firm’s committed CSR level would reduce the rival’s output.
An increased λ affects both the marginal benefit (MB) and marginal cost (MC) of in-creasingθi. A higher λ would dampen manageri’s incentives to commit to a higher θi since
she will put more weight on the rival’s profits in her objective function. But at the same time, an increased λ could increase the marginal effect of θi on its own profit. For θ2 = 0,
Figure1presents MB and MC of increasing θ for low and highλs. As it shows, the marginal benefit increases more than the marginal cost when λ increases. Therefore, the optimal θi
increases with λ. Our result is similar to Theorem 4 in Fershtman and Judd (1987): the manager’s incentive to expand output is increased when the product market competition is lower. In our case, an increased λ reduces the competition between the firms and each manager has more incentives to behave more aggressively in the output market.
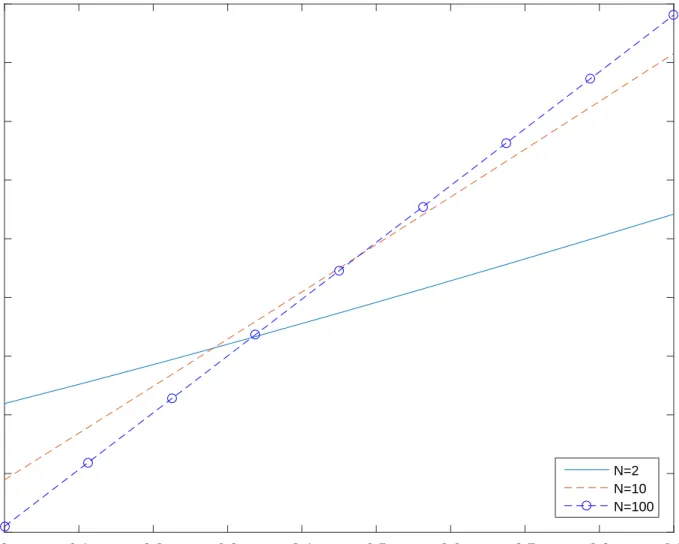
Oligopoly Case: If we generalize the model to a market with n firms, then the optimal
level of CSR is characterized as follows:
α= (2n−1)(1 + (n−1)λ) +n(n−1) β = (1 + (n−1)λ)2 + (n−2)(1 + (n−1)λ) θ∗ = α− q α2−4n(n−1)β 2n(n−1)
When n→∞ and λ=0, thenθ∗ = 0 and is consistent with the results in Fershtman and 1There are two roots of this equation. We choose this root based on the constraint that the equilibrium
Judd (1987). However, when λ > 0, we have θ∗ > 0. Figure 2 presents the comparative statics of θ∗ with respect to n. The results show that the effect of common ownership on CSR increases when the number of firms in the market increases, that is, the market becomes more competitive.
Summary and Discussion: This simple model generates two testable hypotheses and
we will empirically test them in the following sections.
(1) A firm’s CSR performance is positively associated with common ownership
(2) The effect of common ownership on a firm’s CSR performance is stronger when the product market is more competitive.
In the model, we only examine the short-run effect of common ownership on a firm’s CSR choice. If we allow the free entry with a fixed cost, then we can endogenize the number of firms in the market in the long-run. Based on equation 2, the equilibrium number of firms in the long-run would be lower than the one in which CSR is not allowed. Therefore, our model provides a mechanism through which common ownership may reduce future product market competition.
3
Data and Measurements
In this section, we describe the data used in the empirical analysis .
Corporate Social Responsibility Data: To measure a firm’s social performance, we
use the CSR ratings data from the MSCI ESG STAT database (MSCI thereafter). The data starts since the year 1991. From 1991 to 2002, MSCI only covers S&P 500 firms and, since 2003, it expands the coverage to Russell 3000 firms. For each covered firm, MSCI classifies its ESG performance into 13 categories: environment, community, human rights, diversity, employee relations, product, controversial business involvement (alcohol, firearm, gambling, military, nuclear power, and tobacco), and corporate governance. Within each category, MSCI considers both the strengths and concerns.
Following Lins et al. (2017), we focus on the first five categories to construct the CSR measure. Within each category, the raw ratings data for strengths and concerns are not directly comparable in time series within the same firm. The maximum rated numbers of strengths and concerns vary over time. To construct a time-series consistent measure, we normalize the strength (concern) raw score in each category by the maximum number of rated strengths (concerns) in a year across all the covered firms. Within each category, the normalized measure ranges from 0 to 1 for both strength and concern. The normalized score for each category is defined as the difference between the normalized strength and concern ratings, varying from -1 to 1. A firm’s CSR score is defined as the sum of the normalized scores across the five categories and it ranges from -5 to 5.
Institutional Ownership Data: The institutional ownership data is from Thomson
Reuters Institutional 13F Holdings data. The data is available from 1980 to 2012. We end the sample at 2012 because there are known issues with the data since 2013. In each year, we use the last quarter data for each firm to construct the measure (Gilje et al.,2019).2 We focus on common stocks (share codes are 10 or 11 in CRSP), traded on NYSE, AMEX, and NASDAQ, and require that there are at least two firms in an industry-year cell. Following Gilje et al. (2019), we also aggregate the ownership data for BlackRock and add the last quarter data for Barclays in 2003 and JP Morgan in 2008 to further clean the data. Following Azar et al.(2018), we only focus on institutions that own at least 0.5% of a firm’s outstanding shares. This is equivalent to assume that a firm only cares about the profits of shareholders that hold sizable shares in the firm.3
Common Ownership: There are various measures of common ownership proposed in
the literature. The mostly commonly used one is modified HHI delta (MHHID) developed in O’Brien and Salop (2000). Recently, Backus et al. (2019) revisit the common ownership theory and propose to use the weight that a firm puts on the profit of another firm (not necessarily the industry rival) as the measure for common ownership. Gilje et al. (2019)
2we use PERMNO as the definition for a firm.
construct a model that incorporates investors’ attention for the stocks in their portfolios and develop a new measure. Other papers also propose several reduced-form measures (Antón and Polk,2014; He and Huang, 2017).
In this paper, we follow Backus et al. (2019) and use the average weight that a firm puts on its industry rivals’ profits as the main measure of common ownership. The main advantage of this measure is that it is directly linked to the common ownership theory and empirically measures the parameter λ in equation (1) of our model. Other papers including Gramlich and Grundl (2017) and Kennedy et al. (2017) also use this measure to study the anti-competitive effects of common ownership.
If we generalize the expression in equation (1) to the case in which there are N firms, then the weighted-average profits accrued to firm f’s shareholders are as follows:
X ∀s γf sΠs = X ∀s γf s( X ∀g βgsπg) = X ∀s γf sβf sπf + X ∀s γf s X ∀g6=f βgsπg ∝πf + X ∀g6=f P ∀sγf sβgs P ∀sγf sβf s πg
γf s andβf sare voting and cash-flow shares of shareholdersin firmf. The term
P
∀sγf sβgs
P
∀sγf sβf s
is the weight that firm f puts on its rival g’s profit if there are investors that hold shares in both firms. To develop a firm-level measure, we then calculate the simple average of the weights that a firm puts on each of its rival’s profit. In the baseline estimations, we define an industry as a 3-digit CRSP SIC code. In robustness tests, we also defined an industry as a 4-digit CRSP SIC code or a TNIC industry inHoberg and Phillips (2010) andHoberg and Phillips (2016). We denote N as the number of rivals in the same industry, then our main measure for firm f is constructed as follows:
λf = 1 N X g6=f P ∀sγf sβgs P ∀sγf sβf s (8) It is straightforward to use the ownership data in the 13F database to measure βf s.
assumptions to estimateγf s. In the baseline estimations, we follow Backus et al. (2019) and
assume the proportional control assumption holds, that is, βf s = γf s for any f and s. But
our results are robust to alternative assumptions such as γf s =
q
βf s orγf s =βf s2 .
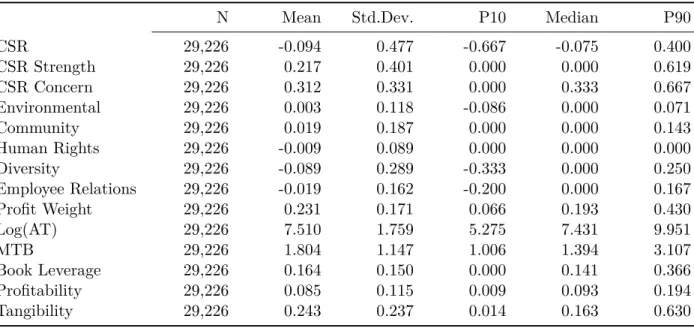
The final sample spans from the year 1991 to the year 2013. There are 26,947 firm-year observations (3,930 unique firms) with non-missing variables in the empirical analysis. The summary statistics of variables used in the analysis are reported in Table1. The measure of a firm’s social performance, CSR, has slightly negative mean (-0.094) and median (-0.075). The statistics show that the average and median firm in our sample has more CSR concerns than CSR strengths. The results are consistent with the ones in Lins et al. (2017). For the common ownership measure, Profit Weight, the statistics show that an average firm in our estimation sample puts around 23.5% on its rivals’ profits and the standard deviation of this variable is 0.169.
Figure3presents the average of Profit Weight across all the firms in each year from 1980 to 2012. It shows that U.S. public firms put more weights on their industry rivals’ profits overtime. In the year 1980, the average weight is 7% and the number increases to 45% in the year 2012, a six-fold increase. This increasing trend of the common ownership is consistent with the results in Backus et al. (2019).
4
Empirical Strategy and Results
To estimate the effect of common ownership on CSR, we start with running the following OLS specification:
CSRit =α+βCOit−1+ Γ0Xit−1+µi+ηt+it
CSRitis the CSR score detailed in Section3for firmiin yeart. COit−1 is the independent
variable of interest and is the lagged common ownership measure described in Section 3. Xit−1 is a vector of lagged control variables including firm size, market-to-book ratio, book
leverage, profitability, and tangibility. The list of control variables followsDyck et al.(2019). The variable definitions are available in Appendix. µi and ηt represent firm and year fixed
effects. Standard errors are clustered at the firm level to account for the serial correlation within a firm over time. All continuous variables are winsorized at the 1% and 99% percentiles to mitigate the effects of outliers.
4.1
Baseline Results
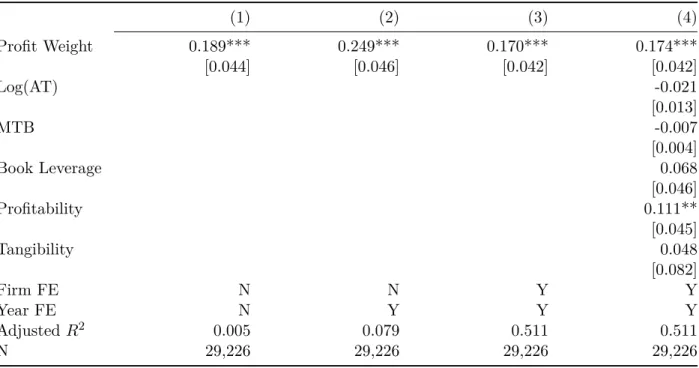
In this subsection, we report the baseline results on how common ownership affects CSR. The estimations are reported in Table 2. In column (1), we do not control for any fixed effects or firm characteristics. The estimations represent the simple bivariate correlation between common ownership and CSR. The estimated coefficient is 0.189 and highly statistically significant. The evidence from the raw data suggests that a firm engages in more CSR activities if it puts a larger weight on its rivals’ profits. In column (2), we add the year fixed effects and explore the cross-sectional variation in the measured common ownership incentive in each year. The estimated coefficient becomes larger compared to the one in column (1) and is 0.249.
In column (3), we further include the firm fixed effects to absorb any unobservable, time-invariant firm characteristics. The magnitude of the coefficient on Profit Weight becomes smaller but still remains highly statistically significant. Finally, in column (4), we control for a vector of lagged observable firm characteristics that could affect a firm’s social performance. The estimated coefficient on Profit Weight becomes 0.174 and is still significant at the 1% level. In terms of economic significant, the result suggests that a one-standard-deviation increase in the measured common ownership (0.171) is associated with 0.030 increase in the CSR score. This is translated to a 6.24% increase relative to the standard deviation of CSR score (0.477). Overall, the estimations in Table 2 suggest that when a firm is more linked to its rivals through common owners, its CSR performance tends to become better. The estimations are consistent with the theoretical prediction from the model.
4.2
Decomposing CSR Score
In the next two tables, we decompose a firm’s CSR score and empirically examine which dimension of CSR is more affected by common ownership. We use the specification in column (4), Table 2 to estimate the effects.
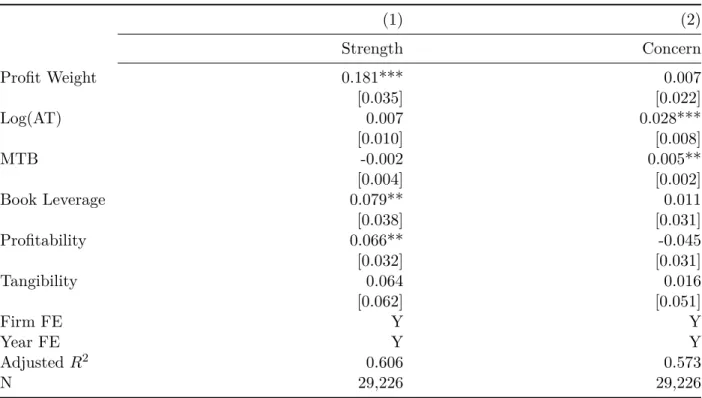
In Table 3, we examine the effects of common ownership on CSR strengths and con-cerns, respectively. The estimations suggest that a firm significantly improves its CSR strengths when common ownership increases. In particular, a one-standard-deviation in-crease inProfit Weight is associated with a 7.72% increase relative to the standard deviation of CSR strengths. However, the results show that common ownership has little impacts for CSR concerns. The estimated coefficient on Profit Weight is 0.007 and statistically insignif-icant. The results show that the improved CSR performance associated with an increased common ownership is driven by the improvement in CSR strengths rather than through reducing CSR concerns.
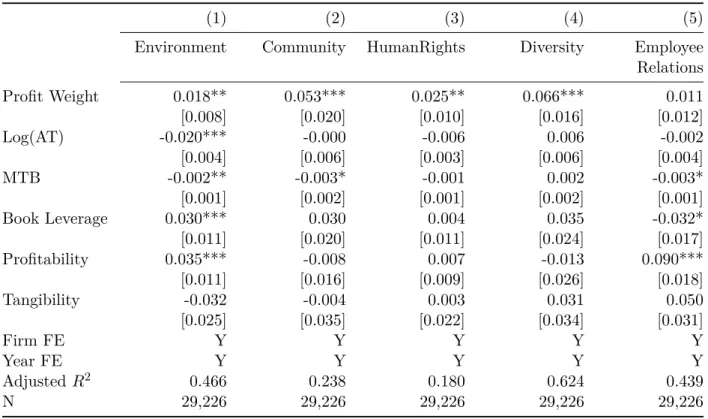
In Table4, we examine the effect of common ownership on each of the five net scores that composite of a firm’s net CSR score. The estimations show that firms tend to improve per-formance in each dimension when common ownership incentives is increased. The estimated effect of common ownership on employee relations is weaker and not statistically significant.
4.3
Robustness Checks
In this subsection, we perform several robustness checks to the main results in Table 2. The results are reported in Table 5.
Industry Definition: In the baseline results, we define an industry as a 3-digit CRSP
SIC code. In columns (1) and (2) of Table5, we report the results using alternative industry definitions. We use the definition of 4-digit CRSP SIC code in column (1) and Hoberg-Phillips TNIC definition in column (2).4 The results are qualitatively similar to the one in
column (4), Table2and still statistically significant. The economic magnitudes are, however, 4For the 4-digit CRPS SIC codes, we drop the ones with zeros in the last digits.
smaller.
Alternative Common Ownership Measures: In columns (3)-(5), we check whether
the baseline results are robust to alternative measures for common ownership. In column (3), we assume that a firm’s manager only maximizes the profits of shareholders that hold at least 5% of a firm’s outstanding shares. In column (4), we assume that a firm’s manager only maximizes the profits of top 5 shareholders. In column (5), we use the newly developed measure inGilje et al.(2019) (GGL). Specifically, the GGL measure is constructed as follow. Let βf s be the cash-flow right of shareholder s in firm f and αf s be firm f’s weight in
shareholder s’s portfolio. We assume that the attention of a firm’s manager is linear in αf s.
We call the measure as GGL-Linear and is defined as N1 P
∀g6=f
P
sβf sαf sβgs. The estimated
coefficients on the alternative common ownership measures are still positive and statistically significant.
Alternative Specifications: In column (6), we control for additional firm-level
charac-teristics including cash holding, cash flows, capital and R&D investment, and institutional ownership. Our results are robust to the additional controls. In column (7), we control for industry×year FEs instead of only year FEs. This specification absorbs any industry-year shock including product market competition in an industry-industry-year cell. The estimated coefficient on profit Weight is 0.148 and highly statistically significant.
Overall, the results in Table 5 suggest that our baseline results are robust to alternative industry definitions, common ownership measures, and specifications.
4.4
Cross-sectional Tests
In this subsection, we test the second hypothesis generated from the model: the effect of common ownership on a firm’s CSR performance is higher when the product market is more competitive. We use two measures for product market competitiveness. The first one is, Low HHI, is a dummy variable equal to one if the HHI at the 3-digit CRSP SIC-year level is in the bottom tercile in a year and zero otherwise. The second measure is High Number of
Firms, which is a dummy variable equal to one if the number of firms at the 3-digit CRSP SIC-year level is in the top tercile in a year and zero otherwise.
The results are reported in Table6. The estimations show that, compared to firms in less competitive industries, the effect of common ownership on a firm’s CSR score is larger for firms in more competitive industries. The empirical evidence is consistent with the model prediction. Specifically, the results in column (1) show that the marginal effect of common ownership on CSR is 0.074 for firms in which Low HHI is zero. But for firms in which Low HHI is one, the marginal effect of common ownership is 0.231 (=0.157+0.074) and the difference between these two coefficients is statistically significant at 10% level. The results in column (2) are qualitatively similar.
4.5
Blackrock and Barclays Global Investors Merger
The evidence so far suggests that firms improve CSR performance when common ownership is higher and is consistent with the model prediction. However, we cannot interpret the evidence as that an increased common ownership causes a firm to increase CSR investment. One concern is that the evidence may be consistent with the reverse causality argument that institutional owners may decide to acquire shares when firms perform better in CSR.
In this subsection, we present evidence that strengths the causal interpretation of the rela-tion between common ownership and CSR. Specifically, we use the merger between Blackrock (BLK) and Barclays Global Investors (BGI) as a natural experiment to mitigate the endo-geneity concerns in the OLS estimations. The detailed background of this merger is available in Azar et al. (2018). The merger was announced in June 2009 and was completed in De-cember 2009, we follow the design in Azar et al. (2018) and calculate the implied increase in common ownership for each firm in the year 2008. Specifically, we first calculate the weight that a firm puts on the its industry rivals’ profits in the year 2008. We then calculate the profit weight for each firm assuming that BLK and BGI were already merged in the year 2008. For each firm, the difference between the hypothetical and actual profit weights is
labeled as the implied increase in profit weight because of the hypothetical merger. We then sort the implied increase in profit weights into terciles. The firms with implied increases in profit weights in the top and bottom terciles are in the treatment and control groups, respectively.
To estimate the effect of BLK-BGI merger on a firm’s CSR performance, we estimation the following difference-in-differences (DiD) specification. We restrict the sample to be from three years before the merger to three years after the merger, seven years in total. We also require that there is at least one observation before and after the merger for each firm in the sample. The identifying assumption is that the implied increase in a firm’s profit weight is uncorrelated with the error term in the firm’s CSR score conditional on a vector of pre-merger firm-level characteristics. In particular, we estimate the following equation:
CSRit =α+β0T reatedi×P ostt+β1T reatedi+β2P ostt+ Γ0Xi2008+it (9)
T reatedi is a dummy variable equal to one if firm i is in the treatment group and zero
otherwise. P ostt is a dummy variable equal to one if year t is 2010, 2011, or 2012 and zero
otherwise. Xi2008 is a vector of firm characteristics for firmiin the year 2008. We cluster the
standard errors at the firm level. Table 7reports the estimations. The estimated coefficient of interest is the one onT reatedi×P ostt.
In column (1), we do not control for the pre-merger firm characteristics. The coefficient on Treated×Post is 0.149 and highly statistically significant. It suggests that, compared to firms that are least affected by the merger between BLK and BGI, the firms that are most affected by the merger increase its CSR score by 0.149 afterwards. In column (2), we control for the pre-merger firm characteristics in the year 2008 and the estimated effect on a firm’s CSR performance is similar to the one in column (1). In column (3), we control for the year fixed effects to absorb the variable P ostt. The estimated coefficient on T reatedi ×P ostt
barely changes. Finally, in column (4), we add both the firm and year fixed effects. The coefficient onT reatedi×P osttbecomes 0.134 and still remains highly statistically significant.
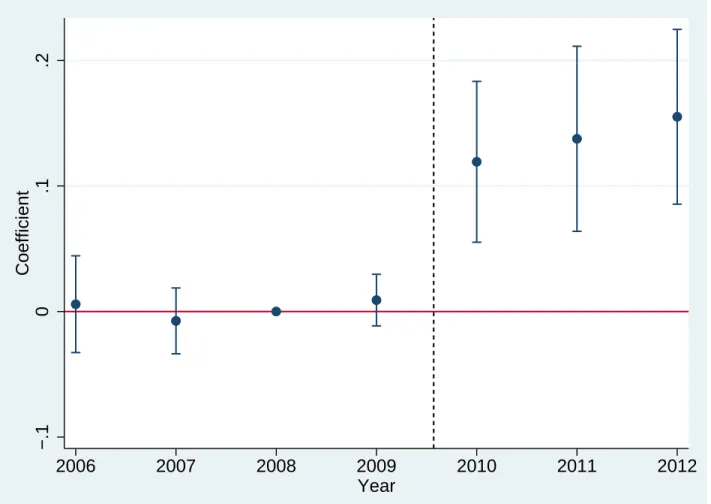
To further illustrate that the parallel assumption for the DiD estimation is unlikely to be violated in our sample, we estimate the dynamic treatment effects using the year 2008 as the base year. We include both the firm and year fixed effects in the estimations. The results are presented in Figure4. The figure shows that between the years 2006 and 2009, the estimated differences in the CSR scores between firms in the treatment and control groups jump around zero and statistically insignificant. Since the year 2010, the differences increase and are between 0.12 and 0.15. They are also highly statistically significant.
Overall, the evidence in Table 7 and in Figure 4 suggests that a firm improves its CSR performance following a potentially exogenous increase in its measured common ownership. These estimations further strengthen the causal interpretation of the baseline results in Table 2.
5
Conclusion
This paper examines how common ownership affects corporate social performance. To answer this question, we first build a model and then provide empirical evidence. In the model, CSR serves as a strategical tool for a firm to commit expanding output in the product market. The model predicts that an increased common ownership drives a firm to behave more socially responsible and the effect is larger for firms in more competitive industries.
Our empirical evidence supports the theoretical predictions. We use the weight that a firm puts on its industry rivals’ profits as the main measure for common ownership. The estimations show that the association between the measured common ownership and a firm’s CSR score is positive and the estimated effect is more stronger in more competitive industries. We further use the BLK-BGI merger as a natural experiment to strengthen the causal interpretation of the results.
Our evidence suggests that common ownership shapes a firm’s CSR policy and is con-sistent with the notion that a firm uses CSR strategically to strengthen its position in the
production market. Our evidence furthers our understanding on how common ownership af-fects corporate strategic behavior, which could in turn affect the product market competition in the long-run.
Figure 1: Duopoly Model Intuition
This figure presents the marginal benefit and marginal cost of committing to a higher level of CSR for firm 1 holding firm 2’s choice of θ2 as constant. We setθ2 = 0, a= 1, b = 1, and
c= 0. The x-axis is CSR level for firm 1 ranging from 0 to 0.9.
0
0.1
0.2
0.3
0.4
0.5
0.6
0.7
0.8
0.9
CSR Level for Firm 1
-0.3
-0.2
-0.1
0
0.1
0.2
0.3
0.4
MB-Low lambda MC-Low lambda MB-High lambda MC-High lambdalambda=0.1
lambda=0.6
Figure 2: Oligopoly Solutions
This figure presents how the effect of common ownership on CSR varies with the product market structure. The x-axis is common ownership ranging from 0 to 0.9.
0 0.1 0.2 0.3 0.4 0.5 0.6 0.7 0.8 0.9
Common Ownership (lambda)
0 0.1 0.2 0.3 0.4 0.5 0.6 0.7 0.8 0.9 CSR (theta) N=2 N=10 N=100
Figure 3: Trend of Profit Weights
This figure presents the average of the weight that a firm puts on its rivals’ profits from 1980 to 2012. .1 .2 .3 .4 .5 Profit Weight 1980 1990 2000 2010 Year
Profit Weight: 1980−2012
Figure 4: Dynamic Treatment Effects
This figure presents the dynamic treatment effects of the financial institutions mergers on firms’ CSR scores. −.1 0 .1 .2 Coefficient 2006 2007 2008 2009 2010 2011 2012 Year
Table 1: Summary Statistics
This table reports the summary statistics of variables used in the estimations. Variable definitions are in Appendix.
N Mean Std.Dev. P10 Median P90
CSR 29,226 -0.094 0.477 -0.667 -0.075 0.400 CSR Strength 29,226 0.217 0.401 0.000 0.000 0.619 CSR Concern 29,226 0.312 0.331 0.000 0.333 0.667 Environmental 29,226 0.003 0.118 -0.086 0.000 0.071 Community 29,226 0.019 0.187 0.000 0.000 0.143 Human Rights 29,226 -0.009 0.089 0.000 0.000 0.000 Diversity 29,226 -0.089 0.289 -0.333 0.000 0.250 Employee Relations 29,226 -0.019 0.162 -0.200 0.000 0.167 Profit Weight 29,226 0.231 0.171 0.066 0.193 0.430 Log(AT) 29,226 7.510 1.759 5.275 7.431 9.951 MTB 29,226 1.804 1.147 1.006 1.394 3.107 Book Leverage 29,226 0.164 0.150 0.000 0.141 0.366 Profitability 29,226 0.085 0.115 0.009 0.093 0.194 Tangibility 29,226 0.243 0.237 0.014 0.163 0.630
Table 2: Common Ownership and Corporate Social Responsibility
This table reports the effect of common ownership, Profit Weight, on CSR score. Standard errors in parentheses are robust and clustered at the headquarters state level. ***, **, and * represent significance at 1%, 5%, and 10% levels, respectively.
(1) (2) (3) (4) Profit Weight 0.189*** 0.249*** 0.170*** 0.174*** [0.044] [0.046] [0.042] [0.042] Log(AT) -0.021 [0.013] MTB -0.007 [0.004] Book Leverage 0.068 [0.046] Profitability 0.111** [0.045] Tangibility 0.048 [0.082] Firm FE N N Y Y Year FE N Y Y Y Adjusted R2 0.005 0.079 0.511 0.511 N 29,226 29,226 29,226 29,226
Table 3: Common Ownership and CSR Strengths and Concerns
This table reports the effect of common ownership,Profit Weight, on the score for CSR strengths and concerns, respectively. Standard errors in parentheses are robust and clustered at the headquarters state level. ***, **, and * represent significance at 1%, 5%, and 10% levels, respectively.
(1) (2) Strength Concern Profit Weight 0.181*** 0.007 [0.035] [0.022] Log(AT) 0.007 0.028*** [0.010] [0.008] MTB -0.002 0.005** [0.004] [0.002] Book Leverage 0.079** 0.011 [0.038] [0.031] Profitability 0.066** -0.045 [0.032] [0.031] Tangibility 0.064 0.016 [0.062] [0.051] Firm FE Y Y Year FE Y Y Adjusted R2 0.606 0.573 N 29,226 29,226
Table 4: Common Ownership and CSR Categories
This table reports the effect of common ownership,Profit Weight, on the score of each CSR category. Standard errors in parentheses are robust and clustered at the headquarters state level. ***, **, and * represent significance at 1%, 5%, and 10% levels, respectively.
(1) (2) (3) (4) (5)
Environment Community HumanRights Diversity Employee Relations Profit Weight 0.018** 0.053*** 0.025** 0.066*** 0.011 [0.008] [0.020] [0.010] [0.016] [0.012] Log(AT) -0.020*** -0.000 -0.006 0.006 -0.002 [0.004] [0.006] [0.003] [0.006] [0.004] MTB -0.002** -0.003* -0.001 0.002 -0.003* [0.001] [0.002] [0.001] [0.002] [0.001] Book Leverage 0.030*** 0.030 0.004 0.035 -0.032* [0.011] [0.020] [0.011] [0.024] [0.017] Profitability 0.035*** -0.008 0.007 -0.013 0.090*** [0.011] [0.016] [0.009] [0.026] [0.018] Tangibility -0.032 -0.004 0.003 0.031 0.050 [0.025] [0.035] [0.022] [0.034] [0.031] Firm FE Y Y Y Y Y Year FE Y Y Y Y Y Adjusted R2 0.466 0.238 0.180 0.624 0.439 N 29,226 29,226 29,226 29,226 29,226
Table 5: Robustness Tests
This table reports the results of robustness tests. In columns (1) and (2), we use the 4-digit CRSP SIC code and HP-TNIC code to define an industry, respectively. In columns (3) and (4), we assume that a firm’s manager only maximizes the profits accrued to shareholders that hold at least 5% of the firm’s outstanding shares and the top-5 shareholders, respectively. In column (5), we use the newly developed common ownership measure in Gilje et al. (2019). In column (6), we control for additional firm-level characteristics. In column (7), we control for the industry×year fixed effects. Standard errors in parentheses are robust and clustered at the headquarters state level. ***, **, and * represent significance at 1%, 5%, and 10% levels, respectively.
(1) (2) (3) (4) (5) (6) (7) Profit Weight-SIC4 0.075* [0.043] Profit Weight-HP 0.115*** [0.040] Profit Weight-5% 0.179*** [0.033] Profit Weight-Top 5 0.174*** [0.042] GGL-Linear 14.361*** [3.279] Profit Weight 0.152*** 0.148*** [0.044] [0.043] Log(AT) -0.049*** -0.012 -0.008 -0.021 -0.022* -0.029** -0.030** [0.016] [0.012] [0.013] [0.013] [0.013] [0.015] [0.013] MTB -0.004 -0.011** -0.004 -0.007 -0.008* -0.010** -0.006 [0.006] [0.004] [0.004] [0.004] [0.004] [0.005] [0.004] Book Leverage 0.059 0.048 0.070 0.068 0.074 0.058 0.035 [0.061] [0.044] [0.047] [0.046] [0.046] [0.051] [0.048] Profitability 0.120** 0.075* 0.098** 0.111** 0.113** -0.002 0.066 [0.057] [0.044] [0.050] [0.045] [0.045] [0.068] [0.047] Tangibility 0.075 0.105 0.047 0.048 0.052 0.025 0.000 [0.103] [0.080] [0.081] [0.082] [0.082] [0.092] [0.082] Cash Holding 0.028 [0.047] Cash Flows 0.092** [0.043] Capital Investment 0.034*** [0.009] RD/Sale 0.014 [0.013] RD Missing 0.027 [0.036] Institutional Ownership -0.032 [0.042] Firm FE Y Y Y Y Y Y Y Year FE Y Y Y Y Y Y N Industry×Year FE N N N N N N Y
Table 6: Cross-sectional Tests
This table reports the effect of common ownership, Profit Weight, on CSR score conditional on product market structure. Low HHI is a dummy variable equal to one if the HHI at the 3-digit CRSP SIC-year level is in the bottom tercile in a year and zero otherwise. High Number of Firms
is a dummy variable equal to one if the number of firms at the 3-digit CRSP SIC-year level is in the top tercile in a year and zero otherwise. Standard errors in parentheses are robust and clustered at the headquarters state level. ***, **, and * represent significance at 1%, 5%, and 10% levels, respectively.
(1) (2)
Profit Weight*Low HHI 0.157*
[0.082]
Profit Weight*High Number of Rivals 0.137*
[0.082]
Profit Weight 0.074 0.085
[0.067] [0.068]
Low HHI -0.038*
[0.021]
High Number of Rivals -0.033
[0.023] Log(AT) -0.021 -0.022 [0.013] [0.013] MTB -0.007 -0.007* [0.004] [0.004] Book Leverage 0.070 0.069 [0.046] [0.046] Profitability 0.111** 0.110** [0.046] [0.046] Tangibility 0.044 0.045 [0.082] [0.082]
Firm & Year FE Y Y
Adjusted R2 0.512 0.511
Table 7: Difference-in-Differences Estimations
This table reports the results from the DiD specification in equation (9). Standard errors in parentheses are robust and clustered at the firm level. ***, **, and * represent significance at 1%, 5%, and 10% levels, respectively.
(1) (2) (3) (4) Treated×Post 0.149*** 0.147*** 0.146*** 0.134*** [0.029] [0.029] [0.029] [0.029] Treated 0.007 -0.061** -0.059** [0.023] [0.025] [0.025] Post -0.097*** -0.094*** [0.025] [0.025] Log(AT) 0.100*** 0.098*** [0.009] [0.009] MTB 0.080*** 0.078*** [0.014] [0.014] Book Leverage -0.203*** -0.201*** [0.068] [0.068] Profitability 0.086 0.079 [0.053] [0.053] Tangibility -0.243*** -0.245*** [0.044] [0.044] Firm FE N N N Y Year FE N N Y Y Adjusted R2 0.007 0.122 0.178 0.601 N 8,069 7,645 7,645 8,069
References
Antón, Miguel and Christopher Polk, “Connected Stocks,”The Journal of Finance, 2014,69
(3), 1099–1127.
, Florian Ederer, Mireia Gine, and Martin C. Schmalz, “Common Ownership, Compe-tition, and Top Management Incentives,” Technical Report, European Corporate Governance Institute (ECGI) - Finance Working Paper No. 511/2017 2018.
, , , and , “Innovation: The Bright Side of Common Ownership?,” Technical Report, IESE Working Paper 2018.
Azar, José, Martin C. Schmalz, and Isabel Tecu, “Anticompetitive Effects of Common Ownership,”The Journal of Finance, 2018, 73(4), 1513–1565.
, Sahil Raina, and Martin C. Schmalz, “Ultimate Ownership and Bank Competition,” Technical Report, SSRN 2019.
Backus, Matthew, Christopher Conlon, and Michael Sinkinson, “Common Ownership in America: 1980-2017,” Technical Report, National Bureau of Economic Research 2019.
Baron, David P., “Private Politics, Corporate Social Responsibility, and Integrated Strategy,”
Journal of Economics & Management Strategy, 2001, 10, 7–45.
Cheng, Ing-Haw, Harrison G. Hong, and Kelly Shue, “Do Managers Do Good with Other Peoples’ Money?,” Technical Report, SSRN 2016.
Dennis, Patrick, Kristopher Gerardi, and Carola Schenone, “Common Ownership Does Not Have Anti-Competitive Effects in the Airline Industry,” Technical Report, SSRN 2018. Dyck, Alexander, Karl V. Lins, Lukas Roth, and Hannes F. Wagner, “Do institutional
investors drive corporate social responsibility? International evidence,” Journal of Financial Economics, 2019, 131(3), 693–714.
Eldar, Ofer, Jillian Grennan, and Katherine Waldock, “Common Ownership and Startup Growth,” Technical Report, SSRN 2019.
Fershtman, Chaim and Kenneth L. Judd, “Equilibrium Incentives in Oligopoly,” The Amer-ican Economic Review, 1987,77 (5), 927–940.
Evidence from Trade Liberalization,” Strategic Management Journal, 2015, 36(10), 1469–1485. Gilje, Erik P., Todd A. Gormley, and Doron Levit, “Who’s Paying Attention? Measuring
Common Ownership and Its Impact on Managerial Incentives,” Technical Report 2019.
Gramlich, Jacob and Serafin Grundl, “Estimating the Competitive Effects of Common Owner-ship,” Technical Report, Finance and Economics Discussion Series 2017-029. Washington: Board of Governors of the Federal Reserve System 2017.
He, Jie and Jiekun Huang, “Product Market Competition in a World of Cross-Ownership: Evidence from Institutional Blockholdings,”The Review of Financial Studies, 2017,30(8), 2674– 2718.
Hoberg, Gerard and Gordon Phillips, “Product Market Synergies and Competition in Mergers and Acquisitions: A Text-Based Analysis,” Review of Financial Studies, 2010, 23 (10), 3773– 3811.
and , “Text-Based Network Industries and Endogenous Product Differentiation,” Journal of Political Economy, 2016, 124(5), 1423–1465.
Hong, Harrison, Jeffrey D. Kubik, and Jose A. Scheinkman, “Financial Constraints on Corporate Goodness,” Technical Report, National Bureau of Economic Research 2012.
Kennedy, Pauline, Daniel P. O’Brien, Minjae Song, and Keith Waehrer, “The Competi-tive Effects of Common Ownership: Economic Foundations and Empirical Evidence,” Technical Report, SSRN 2017.
Koch, Andrew, Marios A. Panayides, and Shawn Thomas, “Common Ownership and Competition in Product Markets,” Technical Report, SSRN 2019.
Lins, Karl V., Henri Servaes, and Ane Tamayo, “Social Capital, Trust, and Firm Perfor-mance: The Value of Corporate Social Responsibility during the Financial Crisis,”The Journal of Finance, 2017, 72(4), 1785–1824.
López, Ángel L. and Xavier Vives, “Overlapping Ownership, R&D Spillovers, and Antitrust Policy,”Journal of Political Economy, 2019,forthcoming.
O’Brien, Daniel P. and Steven C. Salop, “Private Politics, Corporate Social Responsibility, and Integrated Strategy Competitive effects of partial ownership: Financial interest and
corpo-rate control,”Antitrust Law Journal, 2000,67, 559–614.
Planer-Friedrich, Lisa and Marco Sahm, “Strategic corporate social responsibility, imperfect competition, and market concentration,”Journal of Economics, 2019, pp. 1–23.
Posner, Eric A., Fiona M.Scott Morton, and E. Glen Weyl, “A Proposal to Limit the Anticompetitive Power of Institutional Investors,”Antitrust Law Journal, 2017, 81(3).
Schmalz, Martin, “Common-Ownership Concentration and Corporate Conduct,”Annual Review of Financial Economics, 2018,10, 413–448.