THE MASSACHUSETTS MARKET
FOR HOME INSURANCE
2010
A report to the Joint Committee on Financial Services, the Senate Committee on Ways and Means, and
House Committee on Ways and Means of the Massachusetts General Court,
the Attorney General,
and the Secretary of the Commonwealth
JOSEPH G. MURPHY COMMISSIONER OF INSURANCE
Page ii Acknowledgements
This report was prepared by the State Rating Bureau staff of the Massachusetts Division of Insurance (“Division”). Kevin P. Beagan, State Rating Bureau Director, Gerald B. Condon, State Rating Bureau Researcher, and Caleb E. Huntington, State Rating Bureau Mathematician, prepared the report and provided the analysis. The report is based primarily on responses from companies and statistical reporting organizations reflecting the experience of companies in the home insurance market. Unless otherwise noted in the report, references to home insurance, includes traditional homeowners insurance, as well as condominium and rental insurance.
The Division makes all appropriate efforts to check the completeness and consistency of data reported by insurance companies and their statistical agents, but does rely on the insurance companies for the accuracy of all reported information. Annual Repor ts
The DOI produces a home insurance report pursuant to M.G.L. c. 175, §§ 4A & 4B and has done so since 1996. Insurers and their statistical agents were required to provide aggregate 2008, 2009 and 2010 data for Massachusetts zip codes and Insurance Services Office, Inc. (ISO) territories.
For the 2010 Report, many of the statistical tables that were incorporated in previous annual reports have been included in a separate Statistical Supplement to this report.
Page iii Page Title
ii Acknowledgments
iii Table of Contents iv Table of Figures 1 Executive Summary
2 Composition of the Massachusetts Market
5 Relative Shares of the Private Insurance Market
9 Impact of Private Passenger Automobile Insurance Reforms on Home Insurance
12 Limitations on Coverage 12 Wind Deductibles 13 Flood Exclusions
15 Earthquake Exclusions and Endorsements 17 Financial Results (M.G.L. c. 175, § 4A)
17 Premiums
18 Costs
19 Analysis of Claim Experience
21 Loss Ratios
23 FAIR Plan Financial Results
26 Cancellations and Nonrenewals in 2010 (M.G.L. c. 175, § 4B)
Page iv Page Figure
2 Figure 1 Total Policies by Type of Coverage 3 Figure 2 FAIR Plan Policies
4 Figure 3 Share of 2010 Market (including FAIR Plan) 4 Figure 4 Market Share Insurance Companies and FAIR Plan 5 Figure 5 Share of 2010 Market (not including FAIR Plan) 6 Figure 6 208-2010 Total Home Insurance Policies 7 Figure 7 2010 Total Home Insurance Policies by County
8 Figure 8 2009 and 2010 Total Home Insurance Policies by County 10 Figure 9 Home Insurance Credits for Those with Auto Insurance Policy
10 Figure 10 Number of Home Policies Receiving Premium Credit for Auto Insurance 11 Figure 11 Average Level of Premium Credit for Those with Auto Insurance 13 Figure 12 FEMA National Flood Insurance Program Report – Massachusetts 14 Figure 13 2009 and 2010 Estimated Percentage of Homes with Flood Insurance 15 Figure 14 2009 and 2010 Earthquake coverage Counts
16 Figure 15 2009 and 2010 Average Earthquake Premium 17 Figure 16 Total Premium by Type of Coverage
17 Figure 17 Average Premium by Type of Coverage 18 Figure 18 Total Number of Claims by Type of Coverage 19 Figure 19 Average Claim Size by Type of Coverage
20 Figure 20 2010 Number of Claims by Cause of Loss 20 Figure 21 Percentage of Losses in Dollars by Cause of Loss 21 Figure 22 Total Home Insurance Loss Ratios
22 Figure 23 Total Loss Ratios by Form
22 Figure 24 Calculation of Adjusted Combined Ratios 23 Figure 25 FAIR Plan Underwriting Gain (Loss)
24 Figure 26 FAIR Plan Underwriting Gain (Loss) per Policy 25 Figure 27 FAIR Plan Rate Changes
26 Figure 28-A Top 25 Companies in Coastal and Urban Areas - Cancellations/Nonrenewals 26 Figure 28-B FAIR Plan in Coastal and Urban Areas - Cancellations/Nonrenewals 27 Figure 29 Top 25 Companies Percentage Nonrenewed in Coastal and Urban Areas 28 Figure 30 Cancellations by Reason in Coastal and Urban Areas
29 Figure 31 Nonrenewals by Reason in Coastal and Urban Areas 30 Figure 32 Claims Filed for Renewed/Nonrenewed Policies 32 Figure 33A Consumer Information Calls by Line of Insurance 32 Figure 33B Consumer Complaints by Line of Insurance 33 Figure 34 Home Insurance Complaints per 10,000 Policies 33 Figure 35 Home Insurance Complaints by Type
The Massachusetts Market for Home Insurance 2010 1
Executive Summary
Among the material presented in this report:
• Home insurance policies decreased by 5,708 or 0.3% between 2009 and 2010.
1,854,771 1,882,173 1,876,464 1,750,000 1,800,000 1,850,000 1,900,000 1,950,000 2,000,000 2008 2009 2010
2008 -2010 Total Home Insurance Policies*
• Total enrollment in the FAIR Plan1
• In coastal areas the FAIR Plan accounted for 46.6% of policies in the Cape and Islands. There have been signs of greater availability of coverage as Narragansett Bay Insurance Company (Blackstone Financial Group) has expanded and new companies have indicated their desire to increase marketing of home insurance to those who purchase their automobile policies.
decreased by 5,939 policies in 2010 with the FAIR Plan writing 13.9% of 2010 home insurance premium.
• Insurance company loss ratios – losses in relation to earned premiums – increased from 42.3% in 2009 to 45.7% in 2010. When company expenses are added to losses, the resulting adjusted combined ratio – losses and expenses in relation to earned premiums – has increased from 76.6% in 2007 to 84.5% in 2010.
• There were four events in 2010 that were classified as a loss catastrophe. The four catastrophes consisted of one winter storm event and three wind and thunderstorm events. • There was severe wind and flood damage in western Massachusetts counties when tornadoes
touched down June 1, 2011 and wind and flood damage throughout Massachusetts when named-storm Irene struck the Northeast on August 28, 2011. The projected losses were expected to be over $100 million. The impacts of these storms will be studied in next year’s home insurance report.
1
The Fair Plan is the residual market for homeowners insurance operated by the Massachusetts Property Insurance and Underwriting Association (“MPIUA”).
The Massachusetts Market for Home Insurance 2010 2
Composition of the Massachusetts Market
Home insurance covers non-commercial property for the risks of damage to structural and personal property and personal liability claims. In 2010, insurance companies collected over $1.7 billion in written premium for home insurance policies in Massachusetts, making it the largest line of property and casualty coverage other than private passenger motor vehicle insurance.
Although it may be fiscally prudent to protect one’s assets from loss or damage, there are no laws that require property owners to purchase any home insurance.2 Based on “written house years” - a measure equivalent to average number of homes insured - the total number of people covered under the three major types of home insurance: condominium, traditional homeowners and rental insurance changed is illustrated in Figure 1.3
1 7 7 ,0 6 9 1 ,5 3 0 ,7 4 1 1 4 6 ,9 6 1 1 8 6 ,1 0 4 1 ,5 3 7 ,1 3 8 1 5 8 ,9 3 0 1 9 3 ,2 2 9 1 ,5 0 7 ,4 4 7 1 7 5 ,7 8 9 0 200,000 400,000 600,000 800,000 1,000,000 1,200,000 1,400,000 1,600,000 1,800,000
Condominium Homeowner Tenant
Total Policies by Type of Coverage*
*Policies reflect reported house-years. A house-year is defined as one house insured for one year, and is calculated based on the term of the policy.
2008
2009
2010
2008 2009
2010
2008
2009 2010
Figure 1
Companies Offering Coverage
Just as an individual may choose whether or not to secure insurance for his/her home, an insurance carrier has the legal right to decide whether to offer, cancel, terminate or renew
2
Even though home insurance is not required by law, most lenders will require that an owner have sufficient home insurance as a condition of a mortgage on the property.
The Massachusetts Market for Home Insurance 2010 3 insurance coverage, provided that the insurance company operates according to the statutory nondiscrimination and disclosure requirements.4 There are 635 licensed insurance companies offering home insurance in the Commonwealth.6
If none of the licensed insurance companies is willing to issue coverage for a specific home, the owner may apply to the Massachusetts Property Insurance and Underwriting Association (“MPIUA”, also known as the “FAIR Plan”), which, by statute,
7
is required to offer coverage to homes with a replacement cost of up to $1.0 million. If an owner cannot obtain a policy from an insurance company and the home’s value is beyond what the FAIR Plan will cover, an owner can seek coverage in the surplus lines market.8
71, 288 74, 620 84, 157 99, 283 135, 000 167, 970 188, 736 204, 101 201, 348 193, 339 187, 400 -50,000 100,000 150,000 200,000 250,000
P
o
li
ci
es I
ssu
ed
Fiscal Year*
FAIR Plan Policies
*October 1 of the previous year to September 30 of the following year
Figure 2
The FAIR Plan decreased by 5,939 policies issued between fiscal year9
4
M.G.L. c. 175, §§ 4C and 99.
5
The Companies are listed only if they have written ten or more policies HO-3 form of policy or similar between July 1, 2010 and December 31, 2010.
6 A list of companies offering homeowners insurance by region in Massachusetts is on the Division’s website at:
http://www.mass.gov/?pageID=ocasubtopic&L=5&L0=Home&L1=Consumer&L2=Insurance&L3=Home+Insurance&L4=Ho me+Insurance+Service+Areas&sid=Eoca.
7
According to M.G.L. c. 175C, §4(4a), all home insurance companies licensed to and engaged in writing property insurance in the commonwealth must be members of a joint underwriting association which shall provide basic property insurance to eligible applicants who are otherwise unable to obtain such coverage in the voluntary market.
8
Surplus lines companies are insurers which are not "licensed" or “admitted” in Massachusetts although they are "licensed" in another state (or country) and can only issue coverage through specially licensed surplus lines brokers. This document does not include statistical information on the surplus lines market.
9
The FAIR Plan’s fiscal year is between October 1 and September 30 of the following year.
The Massachusetts Market for Home Insurance 2010 4 As noted in Figure 3, the FAIR Plan’s market share is 13.9% based on premium volume10
Figure 3
- almost one and a half times that of the largest commercial carrier.
As noted in Figure 4, the FAIR Plan accounted for 13.9% of written premium in 2010. The FAIR Plan’s share of the market11 peaked at 16.1% in 2007.
Figure 4
10 Market share based on 2010 Massachusetts home insurance written premium. 11
The Massachusetts Market for Home Insurance 2010 5 Relative Shares of the Private Insurance Market
When excluding the FAIR Plan, Figure 5 illustrates that the top 10 insurance companies account for 64.7% of coverage written by the private insurance companies in the market.
MAPFRE INS GRP 11.6%
TRAVELERS GRP 9.3%
CHUBB & SON INC GRP 7.0% LIBERTY MUT GRP 6.9% ARBELLA INS GRP 6.7% ANDOVER GRP 6.4% SAFETY GRP 5.6% QUINCY MUT GRP 4.5% VERMONT MUT GRP 3.5% AMICA MUT GRP 3.3% OTH VOLUNTARY 35.3%
Share of 2010 Market (not Including FAIR Plan)*
*Based on premiums and not house-years.
Figure 5
The Mapfre Insurance Group (formerly known as the Commerce Group Inc.) had the largest share of the voluntary – non-FAIR Plan - market with 11.6% of the insurance policies written. Each of the next nine largest insurance groups had between 3.3% and 9.3% of the market. If the analysis is extended to the 25 insurance companies with the largest Massachusetts home insurance market share,12
12
The top 25 Massachusetts home insurers based upon overall direct written premiums for calendar year 2010 are:
they are responsible for 92.8% of the non-MPIUA insurance market.
Allianz Insurance Group Metropolitan Group
American International Insurance Group New London County Group
Amica Mutual Group Norfolk & Dedham Group
Andover Group Plymouth Rock Insurance Group
Arbella Insurance Group Preferred Mutual Insurance Company
Barnstable Group Providence Group
Blackstone Financial Group Quincy Mutual Group
Chubb & Son Group Inc. Group Safety Group
(The) Hanover Insurance Group Tower Group
Harleysville Group Travelers Group
Liberty Mutual Group United Services Automobile Association Group
Main Street American Group Vermont Mutual Group
Mapfre Insurance Group
The Massachusetts Market for Home Insurance 2010 6 The remaining 42 company groups13
1,854,771 1,882,173 1,876,464 1,750,000 1,800,000 1,850,000 1,900,000 1,950,000 2,000,000 2008 2009 2010
2008 -2010 Total Home Insurance Policies*
each account for less than 1.0 percent of the non-MPIUA market. Unlike other states, the vast majority of insurance companies that offer coverage in Massachusetts are local or regional companies. Among the top 10 home insurance companies in the market, only three – the Travelers Group, the Liberty Mutual Group and Chubb & Son Group, Inc. – offer home insurance nationally. The remaining companies are regional companies offering coverage primarily in the Northeast.
Changes in Coverage
As noted in Figure 6, the number of total home policies written by insurance companies or the FAIR Plan decreased between 2009 and 2010 by 5,708 or by 0.3%.
Figure 6
When grouping counties according to Massachusetts policies,14 as is illustrated in Figure 7, Middlesex County had the largest population15
13
Based on 2010 National Association of Insurance Commissioners home insurance multiple peril direct written premium by company group. Company groups often have more than one licensed insurer writing home insurance.
14
For the purpose of reporting information by county, certain Information Services Office (ISO) statistical reporting territories were combined in the following ways:
Berkshire and Franklin County include territory 50.
Hampden and Hampshire Counties include ISO territories 47, 48 and 49; and Worcester County includes ISO territories 45 and 46;
Essex County includes ISO territories 38, 39 and 40; Middlesex County includes ISO territories 41, 42, 43 and 44;
Suffolk County (including the City of Boston) includes ISO territories 2, 3, 4, 5 and 11; Norfolk County includes ISO territories 12, 30, and 31;
Bristol County includes ISO territories 32, 33 and 34; Plymouth County includes ISO territories 35 and 36;
Barnstable, Dukes and Nantucket Counties include ISO territory 37;
Detailed information for each territory is included in the Statistical Supplement to this report.
15
Source: Annual Estimates of the Population for Counties of Massachusetts, Population Division, U.S. Census Bureau. Release Date: March 2010.
The Massachusetts Market for Home Insurance 2010 7 had the highest number of policies in-force. After Middlesex County, the next three largest counties for home insurance are: Worcester (231,057), Essex (213,030) and Norfolk (203,472).
Insurers 81.3% Insurers 96.0% Insurers 88.2% Insurers 86.7% Insurers 53.4% Insurers 92.9% Insurers 97.0% Insurers 96.4% Insurers 95.8% Insurers 95.6% Fair Plan 18.7% Fair Plan 4.0%
Fair Plan 11.8% Fair Plan 13.3% Fair Plan 46.6% Fair Plan 7.1% Fair Plan 3.0% Fair Plan 3.6% Fair Plan 4.2% Fair Plan 4.4% 0 50,000 100,000 150,000 200,000 250,000 300,000 350,000 400,000 450,000 Berkshire and Franklin Hampden and Hampshire
Worcester Middlesex Essex Suffolk Norfolk Bristol Plymouth Barnstable, Dukes and Nantucket
2010 Total Home Insurance Policies by County*
*Policies reflect reported house-years. A house-year is defined as one house insured for one year, and is calculated based on the term of the policy.
124,972 203,472 144,712 149,520 141,063 213,030 424,191 231,057 172,441 72,006 1,876,464 Total Market -Figure 7
The proportion of FAIR Plan policies written by area varies greatly. While the FAIR Plan writes 46.6% of the home insurance in Barnstable, Dukes and Nantucket Counties (an area also known as the Cape and Islands) and 18.7% of the home insurance in Suffolk County, it writes less than 15% of the policies in each of the other areas.
The Massachusetts Market for Home Insurance 2010 8 When comparing home insurance between 2009 and 2010, as presented in Figure 8, the number of home insurance policies remained fairly similar in most territories.
95.5% 95.6% 95.7% 95.8% 96.4% 96.4% 96.9% 97.0% 92.9% 92.9% 80.6% 81.3% 96.1% 96.0% 88.4% 88.2% 87.1% 86.7% 54.7% 53.4% 4.5% 4.4% 4.3% 4.2% 3.6% 3.6% 3.1% 3.0% 7.1% 7.1% 19.4% 18.7% 3.9% 4.0% 11.6% 11.8% 12.9% 13.3% 45.3% 46.6% 0 50,000 100,000 150,000 200,000 250,000 300,000 350,000 400,000
450,000
2009 and 2010 Total Home Insurance Policies by County*
Fair Plan Insurers Insurers
*Policies reflect reported house-years. A house-year is defined as one house insured for one year, and is calculated based
on the term of the policy.
2009 Total Market -2010 Total Market -1,876,464 2009 2010 2009 2010 2009 2010 2009 2010 2009 2010 2009 2010 2009 2010 2009 2010 2009 2010 2009 2010 1,882,173 Figure 8
The Massachusetts Market for Home Insurance 2010 9 Impact of Pr ivate Passenger Automobile Insur ance Refor ms on Home Insur ance
Many property and casualty insurance companies actively participate in insurance markets when they can offer a wide array of their products to customers. In personal lines insurance markets, many companies will only actively market home insurance when they are also marketing private passenger automobile coverage to applicants. During hearings held in the mid-2000s, certain large national companies indicated that they were not interested to expand their home insurance coverage in Massachusetts because they believed they could not operate within the rules in place for private passenger coverage.
Prior to April 1, 2008, Massachusetts private passenger automobile insurance companies operated in a highly regulated market subject to “fix-and-establish” rules. Following the conclusion of annual regulatory hearings, the Commissioner of Insurance formally approved all policy forms and fixed the rates to be used by all companies in the market at the end of annual rate setting hearings.
Following a series of steps taken by then Commissioner Nonnie S. Burnes in 2007, the rules affecting private passenger coverage were rewritten to permit “managed competition.” For the first time in over 30 years, insurance companies were permitted to offer their own coverage options and rates according to transition rules. Beginning on April 1, 2008 companies began to actively compete for business in the new market.
As of the printing of this report, there are 13 new insurance companies operating in Massachusetts’ private passenger motor vehicle insurance market, some of which offer home insurance or are affiliated with home insurance companies. It is expected that these and other companies will look to expand their writing of home insurance in order to increase the marketability of their private passenger coverage.
In addition to the addition of new companies, many existing insurance companies are offering expanded multi-policy premium discounts when insureds buy both their home insurance and automobile insurance coverage from the same company. In order to understand the affect that the changes to private passenger coverage may have had to the home insurance market, the top 25 home insurance companies were asked to report the level of home insurance premium credits provided in 200916 and 2010 for those policyholders who also had motor vehicle coverage with the same or an affiliated insurer.17
16
A number of companies have corrected their 2009 data affecting 2009 totals reported.
17 This report does not include the level of expanded premium discounts that are provided on private passenger automobile
policies for those persons who also have home insurance with the same company. The Division is aware that many private passenger automobile companies did file such premium discounts with their private passenger automobile rate filing.
The Massachusetts Market for Home Insurance 2010 10 As illustrated in Figure 9, premium credits on home insurance coverage for those with a related auto insurance policy increased from $36.9 million in 2009 to $41.9 million in 2010.
Figure 9
When looking at the number of policies affected, over 11,000 more home insurance policies in urban areas obtained premium credits for related automobile insurance coverage in 2010 than in 2009. In coastal areas, over 7,000 more home insurance policies obtained premium credits in 2010 than in 2009 because they had related private passenger coverage.
* For policies written by the top 25 companies in designated coastal and urban areas
Number of Home Policies Receiving Premium Credit for Auto Insurance*
124,019 54,439 2009 Urban Policies Coastal Policies 135,437 61,953 2010 Urban Policies Coastal Policies 178,458Total 197,390Total Figure 10
The Massachusetts Market for Home Insurance 2010 11 As illustrated in Figure 11, the average percentage level of premium credit per policy increased between 2009 and 2010 in urban areas from 13.7% to 14.4% of the average policy premium, while it marginally decreased in coastal areas from 16.6% to 16.4%.
The Massachusetts Market for Home Insurance 2010 12 Limitations on Cover age
Wind Deductibles
In order to reduce their risk, many home insurance companies added mandatory wind deductibles18 to policies which apply to any wind-related damages that may occur in certain coastal territories, such as - Barnstable, Dukes and Nantucket Counties -, or within a certain distance from the shore. These deductibles are imposed either as flat dollar amounts or as a percentage of the covered dwelling amount.19
According to information submitted to the Division from the FAIR Plan and the top 25 companies in the market, all but one company reported that they have mandatory wind deductibles that are part of the coverage they offer in the market with deductibles as high as a flat $5,000 or 5% of the coverage for the main structure.
Although the Division has required that consumers be given clear disclosures of the deductibles before consumers purchase coverage, it is unclear whether consumers understand the potential impact of the limitations.
20
18
A wind deductible is a deductible that applies only to losses caused by wind.
19
The FAIR Plan, for example, currently requires certain insureds to have a minimum wind percentage deductible of 1% to 5% (of the coverage amount for the dwelling and attached structures) or a minimum fixed dollar deductible of up to $5,000, depending on the property’s county, distance from the coast and coverage
20
Additional detailed information is included in the Statistical Supplement to this report.
The largest wind deductibles are being imposed in the coastal parts of Bristol, Plymouth, Barnstable, Dukes and Nantucket Counties. Of all the policyholders living in a coastal or urban area who are covered by the FAIR Plan or the top 25 home insurance companies, 44.4% had a mandatory wind deductible on their coverage in 2010. For those who lived in coastal areas, 73.5% had a mandatory wind deductible. For those who lived in urban areas, 24.0% of the policyholders had a mandatory wind deductible.
Beginning in 2006, the Division of Insurance encouraged insurance companies to allow covered persons to reduce or eliminate their wind deductible by taking steps to reduce the potential costs to their property in the event of a wind event. Drawing upon the experience of other states, most notably Florida, the Division encouraged companies to credit policyholders who installed hurricane shutters or shatterproof glass, installed hurricane-proof garage, patio, and other doors and/or installed roof/foundation anchor bolts. The Division has worked with many carriers to establish clear rules for mitigation programs and to establish ways to document that mitigation steps have been taken.
The Massachusetts Market for Home Insurance 2010 13 Flood Exclusions
In the United States, insurance policies do not cover damages associated with floods.21
FEMA has estimated that more than 11 million U.S. homes are in flood zones and that about one-fourth of the homeowners located in Special Flood Hazard Areas (SFHA)
Recognizing this lack of protection, Congress enacted legislation in 1968 to create the National Flood Insurance Program (NFIP), which is administered by the Federal Emergency Management Agency (FEMA). Under the program, the government plays the role of underwriter - assuming financial risk for damages - and relies on private insurance agents to sell policies.
The NFIP makes flood coverage available for all property holders as long as the property is located in an approved NFIP community. The property does not need to be in a flood plain to qualify for coverage. Flood insurance is mandatory only for those homes whose mortgage is through a federally-backed lender for property in high-risk flood areas.
22
are covered by NFIP-issued or NFIP-backed flood insurance. The proportion of homeowners with flood coverage is low because many people underestimate the risk of flooding. As presented in Figure 12, FEMA reports that 54,392 homes in Massachusetts had flood insurance in 2010; this is an increase of 4.6% over the 52,001 reported for 2009.
Federal Emergency Management Agency (FEMA) National Flood Insurance Program Report
MASSACHUSETTS*
2010 2009
V-Zone A-Zone Other Total Total Total Total County Policies Policies Policies Policies Policies Premium Coverage Berkshire & Franklin 0 861 360 1,221 1,209 $1,224,313 $226,884,300
Hampden & Hampshire 0 1,021 671 1,692 1,590 $1,803,166 $351,558,100
Worcester 0 994 672 1,666 1,501 $2,058,408 $395,183,600 Middlesex 0 4,368 2,612 6,980 5,752 $5,977,082 $1,514,800,400 Essex 320 4,309 2,551 7,180 6,955 $7,181,803 $1,564,900,800 Suffolk 22 3,223 874 4,119 4,148 $3,925,988 $874,968,300 Norfolk 55 4,222 1,457 5,734 5,286 $4,728,425 $1,179,178,400 Bristol 390 2,476 1,189 4,055 4,047 $4,831,823 $901,666,900 Plymouth 816 6,738 2,089 9,643 9,504 $12,579,321 $2,176,386,000
Barnstable, Dukes & Nantucket 872 6,349 4,881 12,102 12,009 $14,625,361 $3,020,207,800
State Total : 2,475 34,561 17,356 54,392 52,001 $58,935,690 $12,205,734,600
*Data is based on information received from the Federal Emergency Management Agency as 07/01/10 (excludes a small percentage of unknown data) for 2009 policies and as of 06/30/2011 for 2010 policies. Flood insurance is required for insurable structures within high-risk areas to protect Federal financial investments and assistance used for acquisition and/or construction purposes within communities participating in the National Flood Insurance Program.
V-Zone Policies - policies, in primarilycoastal flood hazard areas (high risk), that have a one percent chance in any given year to be flooded. A-Zone Policies - policies, in primarily flood hazard areas (high risk), that have a one percent chance in any given year to be flooded. Other Policies - policies outside V and A Zones that people who have received disaster assistance and are now required to purchase a policy and those people who have purchased an optional flood insurance policies (preferred risk policy).
Figure 12
21
Automobile insurance policies usually do cover flood damage to a motor vehicle.
22 There are two types of Special Flood Hazard Areas: (1) a V-zone or coastal high hazard area including “the inland limit of a
primary frontal dune along an open coast and any other area subject to high velocity wave action from storms or seismic sources" and (2) an A-zone area that is expected to be flooded once every 100 years.
The Massachusetts Market for Home Insurance 2010 14 The NFIP has kept statistics on national purchases of flood insurance and reported that in 2004 only 28.0% of homes in SFHAs and 0.6% of homes outside of SFHAs purchased flood insurance.23 1 .6 5 % 0 .9 2 % 0 .6 4 % 1 .3 7 % 3 .2 7 % 3 .4 3 % 2 .5 8 % 2 .7 3 % 6 .1 2 % 8 .6 0 % 1 .7 0 % 0 .9 8 % 0 .7 2 % 1.64 % 3 .3 7 % 3 .2 9 % 2 .8 2 % 2 .7 9 % 6 .4 0 % 7 .2 1 % 0.00% 1.00% 2.00% 3.00% 4.00% 5.00% 6.00% 7.00% 8.00% 9.00% 10.00% 2009 2010
2009 and 2010 Percentage* of Homes with Flood Insurance
*The estimated percentage is determined by dividing the total number of
flood policies in each county by the number of policies (defined as written house-years)
According to that report, Massachusetts was the nation's 13th most populous state in 2004, but ranked 18th in the number of policies in place through the National Flood Insurance Program. Barnstable County - with 8.3% of its homes with NFIP coverage – was the only county where more than 8% of the homes did hold flood insurance in 2004.
Although the Division issued Bulletin 2006-05 to remind insurers and insurance producers to offer flood insurance to all state residents, as illustrated in Figure 13, the Division estimates the number of Massachusetts homes with flood insurance continues to be relatively low for 2010.
Figure 13
23
The National Flood Insurance Program’s Market Penetration Rate: Estimates and Policy Implications, RAND Corporation, Lloyd Dixon, Noreen Clancy, Seth A. Seabury, Adrian Overton, February 2006.
The Massachusetts Market for Home Insurance 2010 15 Ear thquake Exclusions and Endor sements
In Massachusetts, many companies specifically exclude damage associated with earthquakes from coverage under home insurance, but may offer an earthquake endorsement to the main policy for an additional premium. Following the 8.9 magnitude earthquake that struck Japan on March 11, 2011, the Division wanted to understand trends in the purchase or such coverage and the overall cost of earthquake endorsements.
In order to understand the availability of and cost of coverage for earthquakes, the Division conducted a special examination to collect coverage information from the top 25 companies and the FAIR Plan. Based on this study, carriers reported that in 2009, whether in the policy or added by endorsement, 93,513 Massachusetts homeowners held coverage for earthquake damage; the total increased by 369 to 93,882 homeowners with earthquake coverage in 2010.
93,513 93,882 0 10,000 20,000 30,000 40,000 50,000 60,000 70,000 80,000 90,000 100,000 2009 2010
Home Earthquake Coverage Counts
Figure 14
In general, companies reported that they do not provide marketing material to target the purchase of earthquake coverage but leave it up to the producer to present the risk and market endorsements if earthquake coverage is not part of the home insurance policy. Eight companies indicated that they do provide disclosures that earthquake coverage is not included in the policy but is available for an additional premium.
In order to determine whether the Japanese earthquake may have led to increased interest in new coverage for earthquake coverage, the examination looked at new coverage issued during the two-month period of March and April in 2010 and 2011. Based on the information reported, it does not appear that the Japanese earthquake was responsible for an increase in the number of new policies written. During March and April of 2011 the top 25 carriers and the FAIR Plan actually wrote or renewed 38 fewer policies with earthquake coverage or endorsements than in the same period a year earlier.
The Massachusetts Market for Home Insurance 2010 16 The examination also studied the premium for earthquake coverage when added as an endorsement to the policy with an additional premium. The average premium for the earthquake coverage was $104.99 per policy in 2009 and $102.63 in 2010.
$104.99 $102.63 $-$20.00 $40.00 $60.00 $80.00 $100.00 $120.00 2009 2010
Average Earthquake Premium
Figure 15
The Division is not aware that any companies have filed to increase the premium for this coverage.
The Massachusetts Market for Home Insurance 2010 17
Financial Results
Premiums
In 2010, insureds paid more than $1.7 billion in premium – less than 1% more than was reported for 2009. Of the total premium, 93.3% was for traditional homeowners insurance. Between 2009 and 2010, traditional homeowners insurance premiums increased by $14.2 million.
75 ,2 70 ,2 49 1, 63 0, 78 3, 92 8 33 ,1 65 ,1 18 80 ,9 60 ,3 70 1, 63 5, 93 9, 91 9 35 ,2 87 ,0 68 80 ,0 81 ,7 91 1, 65 0, 12 7, 22 0 38 ,0 40 ,2 52 0 200,000,000 400,000,000 600,000,000 800,000,000 1,000,000,000 1,200,000,000 1,400,000,000 1,600,000,000 1,800,000,000
Condominium Homeowner Tenant
Total Premium by Type of Coverage
2008 2009 2010 2008 2009 2010 2008 2009 2010
Figure 16
Average premiums increased in 2010 for traditional homeowners coverage, while condominium and tenant premiums decreased slightly.
$426 $1,065 $229 $429 $1,070 $224 $426 $1,082 $219 $0 $200 $400 $600 $800 $1,000 $1,200
Condominium Homeowner Tenant
Average Premium by Type of Coverage
262008 2009 2010 2008 2009 2010 2008 2009 2010
Figure 1724
24 This year’s Home Insurance report uses a different premium basis for calculating the average premium in order to
The Massachusetts Market for Home Insurance 2010 18 Costs
Insurance rates are based on individual company projections of future claims and expenses; these projections are based on prior years’ experience. This section looks at past claims and expense trends.
Filed Claims
In 2010, insureds filed a total of 86,159 claims to their Massachusetts home insurance companies – 26.4% more than the 68,177 filed in 2009 - with 89.5% of the claims filed on traditional homeowners insurance policies. As illustrated in Figure 18, all the coverage types had an increase between 2009 and 2010 in the number of claims filed.
5,560 84,461 1,760 5,646 60,859 1,672 6,913 77,106 2,140 0 10,000 20,000 30,000 40,000 50,000 60,000 70,000 80,000 90,000
Condominium Homeowner Tenant
Total Number of Claims by Type of Coverage
2008
2009
2010
2008
2009
2010
2008 2009
2010
Figure 18
Claim trends tend to fluctuate with damage-causing weather patterns. While Massachusetts’ 2009 storms were relatively mild, a much higher number of claims were associated with the winter storm on December 11-13, 2008 and a number of winter storms in 2010.
While the total number of filed claims increased last year, as illustrated in Figure 18, the average incurred claim for traditional home insurance decreased between 2009 and 2010 by $1,701 or by 14.7%. The size of the average incurred claim for condominium insurance increased by 15.1%. The size of the average incurred claim for tenants between 2009 and 2010 decreased by 4.8%.
The Massachusetts Market for Home Insurance 2010 19 $4,648 $8,377 $4,070 $4,116 $11,547 $4,237 $4,737 $9,846 $4,033 $0 $2,000 $4,000 $6,000 $8,000 $10,000 $12,000 $14,000
Condominium Homeowner Tenant
Average Claim Size by Type of Coverage
2008 2009 2010 2008 2009 2010 2008 2009 2010
Figure 19
Analysis of Claims Experience
When recording reported claims, companies categorize submitted claims according to the cause of loss in order to project future claims, as well as to consider loss control programs that may reduce future losses. Although certain events are natural (such as earthquakes) and others are manmade (such as theft) - companies track both types of losses to develop loss controls that are tailored to various events. In general, company groups submitted claims according to the following categories:
Fire, lightning and removal; Wind and hail;
Water damage and freezing; Theft;
Liability and medical; and All other.25
25 The “all other” category is used when: (a) the claim does not fit one of the other causes of loss, (b) when there is some question
as to which cause of loss among several possible causes of loss caused the claim or (c) when the cause of loss is not known initially.
As illustrated in Figure 20, the highest number of claims – 34,125 – in 2010 was submitted for non-flood related water damage and freezing losses; this is a little more than 39.6% of total claims. Policyholders also submitted 6,790 claims for fire, lightning and removal damages and 23,045 claims for wind and hail damages, accounting respectively for 7.9% and 26.7% of total claims filed. There were a total of 11,312 claims filed under the “all other” category, which represents 13.1% of total claims filed.
The Massachusetts Market for Home Insurance 2010 20 0 5,000 10,000 15,000 20,000 25,000 30,000 35,000 40,000
Fire* Wind* Water* Thef t Liability* All Other
N u m b e r o f C la im s
2010 Number of Claims by Cause of Loss
*Fire includes all fire, lightning, and removal losses, Wind includes all wind and hail losses,
Water includes all water damage and freezing losses, Liability includes all liability and medpay losses
Figure 20
When considering the dollar cost of claims, as illustrated in Figure 21, the losses are distributed because certain types of claims (i.e., fires) have a higher average cost than other types of claims. While the distribution of losses remained constant for most of the losses, wind and hail-related losses increased from 14.0% of all claims in 2009 to 14.9% in 2010, and fire, lightning, and
removal losses also increased from 32.9% of all claims in 2009 to 35.8% in 2010.
40. 9% 7. 8% 29. 0% 3. 0% 5. 5% 13. 8% 32. 9% 14. 0% 31. 7% 2. 9% 5. 8% 12. 7% 35. 8% 14. 9% 30. 8% 3. 0% 6. 0% 9. 5% 0% 5% 10% 15% 20% 25% 30% 35% 40% 45%
Fire* Wind* Water* T heft Liability* All Other
P
er
cen
tag
e o
f T
ot
al
L
osses
Percentage of Losses in Dollars by Cause of Loss
2008 2009 2010
*Fire includes all fire, lightning, and removal losses, Wind includes all wind and hail losses,
Water includes all water damage and freezing losses, Liability includes all liability and medpay losses
The Massachusetts Market for Home Insurance 2010 21 Additional Detail on Each Cause of Loss
Fir e, lightning and r emoval dollar losses as a percentage of statewide losses increased from 32.9% in 2009 to 35.8% in 2010. The statewide average fire, lightning and removal claim cost was $42,357 in 2010 as compared to $40,541 in 2009.
Wind & hail losses accounted for 14.9% of total losses in 2010, up from 14.0% in 2009. The statewide average claim cost for wind and hail decreased from $9,745 in 2009 to $5,207 in 2010. Water damage and fr eezing losses accounted for 29.0% of total losses in 2008, as compared to 31.7% in 2009 and to 30.8% in 2010.
Theft losses accounted for 2.9% of total losses in 2009 and 3.0% of total losses in 2010. The total number of theft claims increased from 7,659 in 2009 to 8,410 in 2010 and the average statewide theft claim cost decreased from $2,810 in 2009 to $2,829 in 2010.
Liability and medical payments losses accounted for 5.8% of total losses in 2009 and 6.0% of total losses in 2010. The average statewide liability and medical claim cost increased from $17,657 in 2009 to $19,079 in 2010.
All other claims losses accounted for 9.5% of total losses in 2010 compared to 12.7% in 2009. Total filed claims decreased from 13,760 in 2009 to 11,312 in 2010. The average claim cost was $6,791 in 2009 and $6,765 in 2010.
Loss Ratios: Loss Experience Compared to Earned Premiums
Loss ratio (incurred losses divided by earned premium) is a generally accepted measure of the underwriting success or failure of property insurance. The higher the cost to the company of reinsurance and other expenses, the lower the company’s loss ratio must be for it to continue to operate. The higher the loss ratio, the more likely companies have overall losses after paying for administrative expenses. Based upon the submitted loss data, the 2010 overall loss ratio for all FAIR Plan and insurance company policies was 45.7%. Figure 22 presents a history of the loss ratios for the entire market since 2001:
56.6% 51.1% 59.4% 55.2% 50.1% 38.7% 38.9% 43.0% 42.3% 45.7% 0.0% 10.0% 20.0% 30.0% 40.0% 50.0% 60.0% 70.0%
Total Home Insurance Loss Ratios
The Massachusetts Market for Home Insurance 2010 22 Non-weather events do not usually cause major shifts in loss trends;26 weather-related events can cause such shifts but it depends on the severity of the events. For example, even though there were two “catastrophe”27
40.7% 46.5% 23.6% 0.0% 5.0% 10.0% 15.0% 20.0% 25.0% 30.0% 35.0% 40.0% 45.0% 50.0%
Condom inium Owner (Traditional
Hom eowners)
Tenant (Rental)
T otal Home Insurance Loss Ratios by Form
events in 2007, one in 2008, none in 2009 and four in 2010, the resulting losses varied with the severity of the event. As presented in Figure 23, the traditional homeowners loss ratio is consistent with the statewide average. The condominium loss ratio is 40.7%, while the tenant coverage is at 23.6%.
Figure 23
Combined Ratios: Loss and Expense Experience Compared to Premiums Collected
Combined ratios (the combination of company expenses and incurred claims divided by earned premium) is a measure of the overall experience of property insurance companies in a market. The lower the combined ratio, the higher the company’s potential profit. Although companies submit incurred loss ratio experience as part of the annual home insurance data call, in order to derive a picture of the market, the following table derives general and other expenses based on aggregate reported financial information for the past four years for insurers.
(C) = (E)= (J) = (K)= (M)=
(A) (B) (B)/(A) (D) (D)/(A) (F) (G) (H) (I) (F)+(G)+(H)+(I) (E+J)/A (L) (K)+(L)
Year Earned Premium ($000's) Incurred Losses ($000's)* Loss Ratio* Incurred Losses + All Loss Adj Expenses ($000's) Adjusted Loss Ratio (incl All Loss
Adjust Expenses) Producer Commissions Taxes and Licensing Fees Other Acquisition Expense General
Expenses Expense Ratio
Combined Ratio (Adj Loss Ratio + Expense Ratio) Mutual Company Dividends to Policyholders Adjusted Combined Ratio (incl Mutual Divs) 2010 1,496,800 683,987 45.7% 764,215 51.1% 17.7% 2.7% 8.0% 4.4% 32.8% 83.8% 0.7% 84.5% 2009 1,470,373 630,921 42.9% 721,140 49.0% 17.8% 2.7% 7.8% 4.6% 32.9% 81.9% 0.7% 82.6% 2008 1,449,187 630,002 43.5% 703,746 48.6% 18.5% 2.7% 7.7% 4.6% 33.5% 82.1% 0.6% 82.7% 2007 1,374,607 520,492 37.9% 587,578 42.7% 18.9% 2.6% 7.5% 4.3% 33.3% 76.0% 0.6% 76.6% 2006 1,285,696 480,453 37.4% 550,171 42.8% 19.6% 2.8% 7.5% 5.2% 35.1% 77.9% 0.7% 78.5%
* For the purpose of these columns, incurred losses includes both incurred losses and allocated loss adjustment expenses (defense and cost containment expenses). Reinsurance expenses are not included in this calculation and are more fully discussed below.
Calculation of Adjusted Combined Ratios
Figure 24
26 Fire losses are an exception since fires involving multiple dwellings can significantly impact losses for a year. 27
Massachusetts catastrophe code numbers are assigned to natural events by Property Claims Services, Inc. (PCS), a subsidiary of ISO, Inc. when insurable losses resulting from a natural event exceed $25 million and produce at least 2,000 claims.
The Massachusetts Market for Home Insurance 2010 23 Figure 24 presents how other home insurance company expenses can be compared to premiums. The adjusted combined ratio, 28
During its 2010 fiscal year, the FAIR Plan had an underwriting profit of $24,068,000
illustrates how other necessary expenses when combined with losses can be compared to homeowners insurance premiums. The adjusted combined ratio of 84.5% for 2010 is slightly higher than the ratio of 82.6% for 2009 and is higher than the same ratios for 2008 and 2007.
The above analysis does not reflect what companies pay for catastrophe and hurricane reinsurance because this information is not readily available within the aggregate financial statements for Massachusetts homeowners business. Based upon information submitted as part of individual company rate filings, reinsurance expenses have increased over the past four years and could account for as much as 25% of a company’s premiums depending on that company’s portfolio of coastal exposures.
FAIR Plan Financial Results
29
(see accompanying Statistical Supplement) which is a seventh consecutive year of underwriting profit30 ($ 1, 834 ,0 00) ($ 8, 423 ,0 00) ($ 7, 079 ,0 00) ($ 13, 68 6, 000 ) $3, 04 2, 000 $25 ,3 21, 00 0 $33 ,0 02, 00 0 $25 ,4 22, 00 0 $44,9 52, 00 0 $26 ,3 31, 00 0 $24 ,0 68, 00 0 ($20,000,000) ($10,000,000) $0 $10,000,000 $20,000,000 $30,000,000 $40,000,000 $50,000,000 G ai n ( Lo ss) Fiscal Year*
FAIR Plan Underwriting Gain (Loss)
*October 1 of the previous year to September 30 of the following year
following four years of underwriting losses.
Figure 25
28
Insurance companies pay claims handling expenses (also known as “loss adjustment expenses”) which if added to incurred losses to calculate an adjusted loss ratio to provide a clearer picture of the proportion of premium dollars that are devoted to claims and claims handling expenses. In addition to claims companies need to pay other expenses, including producer commissions, taxes and licensing fees, other acquisition costs, and general administrative expenses in order to run their businesses. These expenses when combined with the adjusted loss ratio generate a combined ratio reflecting the overall costs of business during a calendar year. Finally, some mutual insurance companies make payouts to policyholders in the form of dividends that should be factored into the analysis as these are real expenses paid out by companies to their policyholders.
29 The FAIR Plan fiscal year runs from October 1st of one calendar year to September 30th of the following calendar year. 30
Since the FAIR Plan is not an insurance company per se, it refers to its underwriting profit as its contribution to surplus. For the purpose of this analysis, the report will continue to refer to this as an underwriting profit.
The Massachusetts Market for Home Insurance 2010 24 As illustrated in Figure 26, the FAIR Plan experienced a Fiscal Year 2010 underwriting profit – often called the FAIR Plan’s contribution to surplus - of $128 per policy, as compared to an underwriting profit per policy of $136 in Fiscal Year 2009.
-$ 25 .7 3 -$ 11 2. 88 -$ 84 .1 2 -$ 13 7. 85 $22 .5 3 $15 0. 75 $17 4. 86 $12 4. 56 $22 3. 26 $13 6. 19 $12 8. 43 ($200) ($150) ($100) ($50) $0 $50 $100 $150 $200 $250 G ai n (L o ss) p er P o li cy Fiscal Year*
FAIR Plan Underwriting Gain (Loss) per Policy
*October 1 of the previous year to September 30 of the following year
Figure 26
Changes in FAIR Plan Rates
As illustrated on Figure 27, the FAIR Plan modified its average rates between 1996 and 2004 on an annual basis by changes ranging from a low of -0.51% to a high of 5.30%. Each of these filings was reviewed according to the standards in M.G.L. c. 175C and hearings were noticed as required by that statute. The proceedings on those filings were ultimately resolved by rate stipulations agreed to by the parties. In 2005, the FAIR Plan submitted a request for a 12.5% statewide rate increase, including a request for a 25.0% rate increase in Barnstable, Dukes and Nantucket Counties.31
31
Identified as ISO statistical territory 37, and is commonly known as the Cape Cod and Islands area.
Following an administrative hearing, the FAIR Plan was granted a 12.42% statewide increase, including a 25.0% rate increase in Barnstable, Dukes and Nantucket Counties to take effect in 2006.
The Massachusetts Market for Home Insurance 2010 25 5.3% 2.2% 0.9% 0.1% -0.5% -0.2% 1.9% 2.8% 3.2% 0.0% 12.4% 0.0% 0.0% 0.0% -0.1% -2.0% 0.0% 2.0% 4.0% 6.0% 8.0% 10.0% 12.0% 14.0% 1996 1997 1998 1999 2000 2001 2002 2003 2004 2005 2006 2007 2008 2009 2010
FAIR Plan Rate Changes*
*Th ere was n o rate change in 2005 p en ding th e conclusion o f a reg ulatory h earing concluded in 2006. Th ere was n o rate change in 2007, 2008 an d 2009 d ue to a p en ding regulatory h earing co ncluded in 2008
an d 2010.
Figure 27
In March 2007, the FAIR Plan submitted a request for a statewide rate increase of 13.2%, including a 25.0% rate increase in Barnstable, Dukes and Nantucket Counties, to be effective July 1, 2007. The hearing on this rate proceeding concluded in 2008 and the requested rate increase was denied because the Commissioner found that the MPIUA had failed to meet its burden of supporting in its filings each aspect of its rate requests and proving, by a preponderance of the evidence, that its rates satisfy the statutory requirements In 2009 the FAIR Plan filed for a proposed rate change of 1.9%. A stipulated agreement was reached in January 2010 for a -0.1% decrease.
Review of FAIR Plan Compar ed to Pr ivate Mar ket
The FAIR Plan’s rates have often been more affordable than essentially the same coverage in the voluntary market. As a result, many persons who have lost coverage as their company pulled out of coastal markets have found that their coverage has been more affordable under the FAIR Plan than from their former insurer.
It also appears that consumers who are assigned to the FAIR Plan may not be shopping around aggressively for other coverage. In 2010, only 230 people of the 187,400 policyholders written through the FAIR Plan took advantage of the FAIR Plan’s Market Assistance Plan (see Statistical Supplement for detail on this program), where the FAIR Plan offers the applicant’s coverage to any other insurer writing in the market.
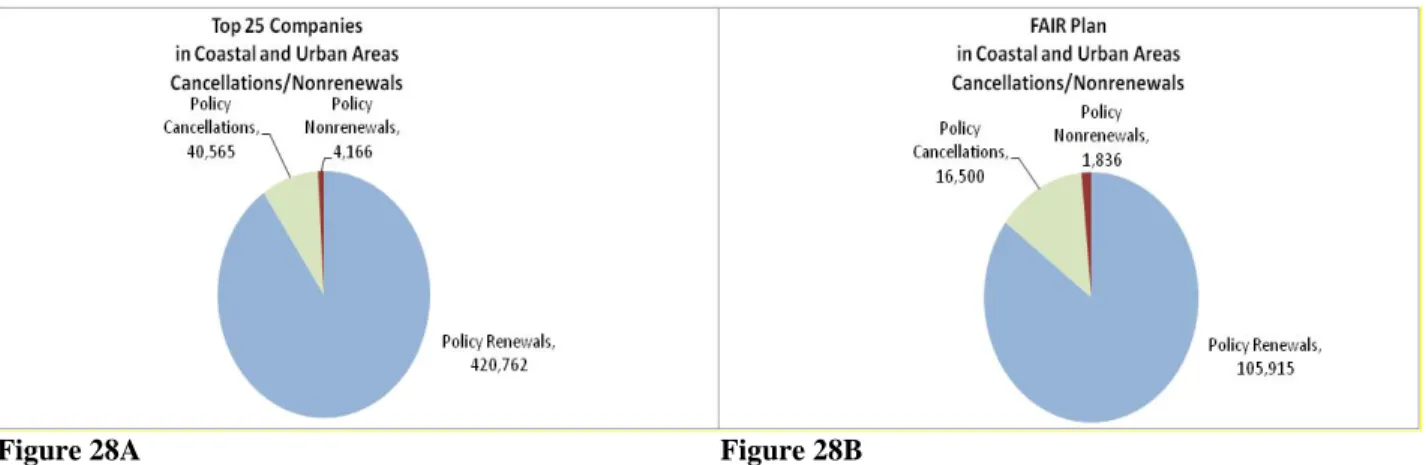
The Massachusetts Market for Home Insurance 2010 26 Cancellations and Nonrenewals in 2010
The Division collects information from the top twenty-five insurers32 according to their share of the Massachusetts statewide written premium in the homeowners market and the FAIR Plan. All are required under Massachusetts General Laws, Chapter 175, §4B to report to the Division a listing of policies in-force, total cancellations, and total nonrenewals for each zip code designated by the Commissioner on a calendar year basis for policies written for the reporting period.33 Aggregate Cancellation/Nonrenewal Data
34
Figure 28A Figure 28B
The top 25 companies and the FAIR Plan report that there were a total of 6,002 policies nonrenewed in the designated zip codes in 2010 with 4,136 policies nonrenewed by the top 25 companies and 1,836 nonrenewed by the FAIR Plan. Of the total number of nonrenewals, 3,865 policies were nonrenewed in urban areas and 2,107 policies were nonrenewed in coastal areas. The top 25 companies and the FAIR Plan reported that they had a total of 465,493 policies in-force in urban and coastal areas as of December 31, 2010 and as illustrated in Figures 28-A and 28-B, the top 25 companies covered 341,242 homes and the FAIR Plan covered 124,251 homes. Of the total policies in-force, there were 273,650 policies in urban areas and 191,843 policies in coastal areas.
During 2010, there were a total of 57,065 policies cancelled in urban or coastal areas, with 40,565 cancelled by the top 25 companies and 16,500 cancelled by the FAIR Plan. Of the total number of cancellations, 38,020 policies were cancelled in urban areas and 19,045 policies were cancelled in coastal areas.
32
The list of the top 25 insurers, primarily insurer groups that were writing homeowners insurance in Massachusetts in 2010 based on written premium data from the National Association of Insurance Commissioner’s database for homeowners multiple peril is listed within footnote 4. Some of these insurer groups are better known by the names of their individual insurance companies.
33 The designated zip codes are identified in Exhibit 8A of the Statistical Supplement to this report. 34
Detailed information identifying the number of cancellations and nonrenewals by zip code for each of the noted companies is included within the Statistical Supplement to this report.
The Massachusetts Market for Home Insurance 2010 27 When examining the information submitted on a company-by-company basis, as illustrated in Figure 29, three companies – Chubb & Son, Inc., Main Street America Group and the New London County Group had the highest numbers of nonrenewals in 2010 in coastal and urban areas. 0.0% 2.0% 4.0% 6.0% 8.0% 10.0% 12.0%
Top 25 Companies Percentage Nonrenewed in Coastal and Urban Areas*
Urban Coastal
*The number of nonrenewals percentage is relative to the number of in force policies each insurer has in designated zip codes . "Nonrenewals consist of both "Total Nonrenewals" and "Insurer initiated Nonrenewals Co's Geographic Withdrawal".
Figure 29
Supplementary Information About Cancellations/Nonrenewals
In examining cancellations in urban and coastal areas, the Division asked companies to report whether cancellations were policyholder-initiated or insurer-initiated, and if insurer-initiated, whether they were made in the first 59 days (when an insurer may do so without reason) or were due to nonpayment or for other permitted reasons after the first 59 days of a policy. The Division requested information regarding the number of nonrenewals specifically associated with geographic concerns as opposed to those undertaken for any other reasons.
The Massachusetts Market for Home Insurance 2010 28 The top 25 companies and the FAIR Plan reported:
• 57,065 cancellations during 2010;
o37,422 were initiated by the policyholder and
o19,643
o were initiated by the insurer with
1,435 initiated by the insurer in the first 59 days
12,154 cancelled due to nonpayment; and
6,054 cancelled for other reasons permitted by law.
In surer-Initiated Can cellations Other
th an fo r No n payment Durin g th e First 59
Days, In surer-Initiated Can cellations Due
to No n Payment,
In surer-Initiated Can cellations All
Oth er, Po licy h older Can cellations, To tal In surer-In itiated Can cellations,
Total Cancellation by Reason in Coastal and Urban Areas
1,435 6,054 12,154 19,643 37,422 Figure 30
From an examination of those policies that were in urban areas: • 38,020 cancellations during 2010
o 24,631 were initiated by the policyholder and
o 13,389 were initiated by the insurer with
857 initiated in the first 59 days;
8,541 cancelled due to nonpayment; and
3,991 cancelled for other reasons permitted by law.
From an examination of those policies that were in coastal areas: • 19,045 cancellations during 2010
o 12,791 were initiated by the policyholder and
o 6,254 were initiated by the insurer with
578 initiated in the first 59 days;
3,613 cancelled due to nonpayment; and
2,063 cancelled for other reasons permitted by law.
The Massachusetts Market for Home Insurance 2010 29 Home insurance products are term products, almost always written with a one-year policy period. At the end of the one year period, insurance companies and insureds must decide whether to continue the coverage for another policy period or to nonrenew the policy. There are no Massachusetts statutes that limit the reasons for the nonrenewal of coverage, but an insurer must provide the policyholder or policyholder’s insurance producer with at least 45 days advance notice.
The Division requested that companies not report data where a renewal offer was made and the policyholder did not accept the offer, instances where the policyholder requested that the policy not be renewed, and any nonrenewals connected to an insurance agency that did not produce business for the company during the years 2008, 2009, and 2010. The Division requested that companies distinguish between nonrenewals that were made based on: (a) the risk of natural perils (i.e., windstorm, hurricane) that are usually covered under the standard homeowners policy or (b) all other reasons.
The top 25 companies report that there were a total of 4,166 insurer initiated policies nonrenewed in the designated zip codes35
Insurer-Initiated Nonrenewals Due to Geographic Withdrawals, Insurer-Initiated Nonrenewals Other than for Geographic Withdrawals,
Nonrenewals by Reason in Coastal and Urban Areas
Total,4,166 4,136
30
in 2010, with 30 of those nonrenewed as insurers withdrew from certain geographic areas and 4,136 nonrenewed for other reasons. (See Figure 31.) This compares with a total of 4,288 policies nonrenewed in the designated zip codes in 2009 (122 less than in 2009), with 30 nonrenewed as insurers withdrew from certain geographic areas ( 43 fewer than in 2009) and 4,136 nonrenewed for other reasons (79less than in 2009) (In addition to the top 25 company nonrenewals, the FAIR Plan did not renew 1,836 policies according to what is permitted within its Plan of Operations, including properties whose value exceeds the $1,000,000 cap for FAIR Plan covered properties.)
Figure 31
35
The Massachusetts Market for Home Insurance 2010 30 Of the reported 30 that were nonrenewed because the insurer decided to withdraw from a geographic area, 10 were in those zip codes identified as coastal areas.
Of the reported remaining 4,136 nonrenewals for reasons other than a decision to withdraw from a geographic area, 2,735 were nonrenewals in those zip codes identified as coastal areas and 1,431 were nonrenewals in those zip codes identified as urban areas.
Claims History of Persons Renewed and Nonrenewed in 2010
In the 2010 survey, the Division asked the top 25 home insurance companies to separately report the claims history of policies that were nonrenewed and those that were renewed during 2010.36
(1) (2) (3) (4)=1000*(3)/(1) (5) (6)=((5)/(2))
Estimated Number Total Claims Dollars3
Number of Claims Filed in of Claims Filed in Estimated ClaimsFiled Due to Claims Filed in
Policies 2008, 2009 and 2010 2008, 2009 and half of 20102 per 1,000 Policies3 2008, 2009 and 2010 Average Claim Size
Urban + Coastal 5 341,242 35,479 28,448 83 $185,522,336 $5,229
Urban 223,313 27,109 21,826 98 $85,250,035 $3,145
Coastal 117,929 8,370 6,622 56 $44,118,018 $5,271
(7) (8) (9)=1000*(8)/(7) (10) (11)=((10)/(8))
Total Claims Dollars3
Number of Claims Filed in Estimated ClaimsFiled Due to Claims Filed in
Policies 2008, 2009 and 2010 per 1,000 Policies3 2008, 2009 and 2010 Average Claim Size
Urban + Coastal 5 4,136 1,007 243 $10,916,379 $10,840
Urban 2,715 735 271 $6,977,455 $9,493
Coastal 1,421 272 191 $3,938,924 $14,481
1Includes all Top 25 policies in force in urban and coastal areas as of 12/31/10 except policies that were issued in 2010. Does not include any FAIR Plan Policies.
Reflects updated values for 2008 and 2009. 2
Renewed Policies were exposed to risk of loss for all of 2010. Non-renewed policies were exposed to risk of loss on average for half of 2010; therefore, to facilitate comparison between renewed and nonrenewed policies, one half of the claims on renewed policies during 2010 have been removed from column (3).
3
Excludes claims not closed by 12/31/10. 4
Includes only nonrenewal policies in urban and coastal areas of the top 25 companies with the nonrenewal decision made for reasons other than geographic withdrawal. Does not include any FAIR Plan policies.
5
Does not include approximately 1.4 million policies written by voluntary writers outside designated urban and coastal zip codes.
Renewed Policies1
Nonrenewed Policies4
Claims Filed for Renewed/Nonrenewed Policies
The top 25 companies report that there were a total of 4,136 policies nonrenewed in the designated zip codes in 2010, with 2,715 policies nonrenewed in those zip codes identified as urban areas and 1,421 policies nonrenewed in those zip codes identified as coastal areas.
Figure 32
36
In collecting the claims history for those policies renewed in 2010, the Division requested in its survey that the company report the number of claims reported and dollars of claims paid during each of 2008, 2009 and 2010. Similarly, in collecting the claims history for those policies nonrenewed in 2010, the Division requested that the company report the number of claims reported and dollar of claims paid during each of 2008, 2009 and 2010.
The Massachusetts Market for Home Insurance 2010 31 Of the reported 341,242 policies renewed by the top 25 home insurance companies, there were an estimated 35,479 claims filed during the reporting period; this is an average of 83 claims filed per 1,000 policies renewed in 2010. The companies reported having paid $185,522,336 in claims during the reporting period for those renewed in 2010 with an average claim size of $5,229. When comparing urban and coastal renewed policies, there were 56 claims filed per 1,000 coastal policies, as compared to 98 claims filed per 1,000 urban policies. The average claim size for renewed people was $5,271 per claim for coastal policies, as compared to $3,145 per claim for urban policies.
Of the reported 4,136 policies nonrenewed by the top 25 insurance companies, there were a total of 1,007 claims filed during the reporting period; this is an average of 243 claims filed per 1,000 nonrenewed policies in 2010. The companies reported having paid $10,916,379 in claims during the reporting period for those nonrenewed in 2010 with an average claim size of $10,840.
When comparing urban and coastal nonrenewed policies, there were 191 claims filed per 1,000 coastal policies, as compared to 271 claims filed per 1,000 urban policies. The average claim size for renewed people was $14,481 per claim for coastal policies, as compared to $9,493 per claim for urban policies.
Summary
While the results are not identical, it is apparent from the survey data collected over the 2009 and 2010 reports that insureds who have been nonrenewed have on average filed more claims and more expensive claims during the experience period. Nevertheless, a significant number of insureds whose policies were renewed also filed claims. As noted in the 2009 report, 318,200 of those whose coverage was renewed in 2009 did file claims sometime in the prior three years and companies made payments of $160,633,440 on these claims. As noted in this 2010 report, 341,242 of those whose coverage was renewed in 2010 did file claims sometime in the prior three years and companies made payments of $185,522,336 on these claims.
The Massachusetts Market for Home Insurance 2010 32
Home Insur ance Complaints Filed with Dur ing 2010
The Consumer Services Section (CSS) responds to inquiries and assists consumers in resolving complaints against insurers, producers and other licensees. In addition to providing consumers with general insurance information in the form of brochures and guides, the CSS also advises consumers of their options and rights under their policies, state laws and insurance regulations. Any consumer of an insurance product marketed or sold in Massachusetts may file a consumer complaint with the CSS against an insurer or insurance producer. Licensees must reply to the Division within 14 days and examiners advocate for the rights of consumers where appropriate. The Division keeps track of all such complaints to understand trends in the insurance industry and investigate any patterns of behavior that may require investigations by the Division’s Special Investigation Unit or its Market Conduct Section.
During 2010, CSS staff received nearly 21,825 calls to the consumer hotline. Of those consumer calls approximately 7.0% were associated with questions or complaints regarding home insurance. This is a decrease from 7.5% in 2009. Among consumers calling for general information, inquiries on home insurance represented 6.3% of all hotline calls, compared to 11.7% of all hotline calls with specific complaints.
Auto 32% Health 29% Home 6% Life 6% Misc. 27%
Consumer Informational Calls by Line
Auto 44% Health 35% Home 12% Life 7% Misc. 2%
Consumer Complaint Calls by Line
Figure 33A Figure 33B
CSS staff also handled over 1,336 formal written complaints from consumers. 13.5% of these formal complaints were associated with home insurance. While 2010 saw an increase in the number of formal home insurance complaints (135 to 180), this is the first increase since 2006. As shown in the chart below, the rate of complaints per 10,000 policies also shows an overall decline over the past five years with only a modest increase in 2010.
The Massachusetts Market for Home Insurance 2010 33 0.81 0.77 0.70 0.72 0.96 0.00 0.20 0.40 0.60 0.80 1.00 1.20 2006 2007 2008 2009 2010
Complaints per 10,000 policies
Figure 34
Analysis of Home Insurance Complaints
The CSS further catalogues complaints according to three categories: Underwriting, Policy Pricing and Claims Handling. Based on complaints submitted over the five-year period
stretching between 2006 and 2010, consumer complaints regarding claims handling procedures constitute nearly half of all complaints. The ratio of complaints under these three major headings is consistent from year to year.
Claims 53.3% Marketing 2.9% Policy 18.4% Underwriting 25.4%
Home Insurance Complaints, 2006 - 2010