The Abundance Pattern ofαelements in the Triangulum-Andromeda Overdensity
J. V. Sales Silva,1 K. Cunha,1, 2 H. D. Perottoni,3, 4 H. J. Rocha-Pinto,3 S. Daflon,1F. Almeida-Fernandes,3, 4 Diogo Souto,1, 5 and S. R. Majewski6
1Observat´orio Nacional/MCTIC, R. Gen. Jos´e Cristino, 77, 20921-400, Rio de Janeiro, Brazil 2Steward Observatory, University of Arizona Tucson AZ 85719
3Universidade Federal do Rio de Janeiro, Observat´orio do Valongo, Lad. Pedro Antˆonio 43, 20080-090, Rio de Janeiro, Brazil 4Departamento de Astronomia, IAG, Universidade de S˜ao Paulo, Rua do Mat˜ao, 1226, 05509-900, S˜ao Paulo, Brazil 5Departamento de F´ısica, Universidade Federal de Sergipe, Av. Marechal Rondon, S/N, 49000-000 S˜ao Crist´ov˜ao, SE, Brazil
6Department of Astronomy, University of Virginia, Charlottesville, VA 22904-4325, USA
(Received June, 2020; Revised July, 2020; Accepted July, 2020)
Submitted to ApJ ABSTRACT
The close relationship between the nature of the Triangulum-Andromeda (TriAnd) overdensity and the Galactic disk has become increasingly evident in recent years. However, the chemical pattern of this overdensity (RGC = 20 - 30 kpc) is unique and differs from what we know of the local disk.
In this study, we analyze the chemical abundances of five α elements (Mg, O, Si, Ca, and Ti) in a sample of stars belonging to the TriAnd overdensity, including stars with [Fe/H]<−1.2, to investigate the evolution of the α elements with metallicity. High-resolution spectra from Gemini North with GRACES were analyzed. Overall, the TriAnd population presents anα-element pattern that differs from that of the local disk; the TriAnd stars fall in between the local disk and the dwarf galaxies in the [X/Fe] vs. [Fe/H] plane. The high [Mg/Fe] ratios obtained for the lower metallicity TriAnd stars may indicate a roughly parallel sequence to the Milky Way local disk at lower values of [Fe/H], revealing a ’knee’ shifted towards lower metallicities for the TriAnd population. Similar behavior is also exhibited in the [Ca/Fe] and [Si/Fe] ratios. However, for O and Ti the behavior of the [X/Fe] ratios shows a slight decay with decreasing metallicity. Our results reinforce the TriAnd overdensity as a unique stellar population of the Milky Way, with an abundance pattern that is different from all stellar populations studied to date. The complete understanding of the complex TriAnd population will require high-resolution spectroscopic observations of a larger sample of TriAnd stars.
Keywords: Galaxy: disk — stars: abundances
1. INTRODUCTION
The chemical abundance pattern ofα-elements (Mg, O, Si, Ca, and Ti) can reveal important characteristics of stellar populations in Milky Way. In the Galactic disk, theα-elements abundances relative to iron present a di-chotomy, with high [α/Fe] ratios corresponding to the chemical thick disk, and low [α/Fe] ratios corresponding to the thin disk (overall younger disk population). The relation between the [α/Fe] ratio and [Fe/H] in the disk also shows a ”knee”, where the [α/Fe] ratio decreases as the metallicity increase towards solar value, due to the onset of significant contributions from SNe Ia to
in-Corresponding author: J.V. Sales Silva joaovictor@on.br, joaovsaless@gmail.com
terstellar enrichment (e. g., Matteucci 2003). Recent results from large high-resolution surveys, such as SDSS III/APOGEE and SDSS IV/APOGEE-2 (Majewski et al. 2017), Gaia-ESO (Gilmore et al. 2012) and GALAH (De Silva et al. 2015), indicate that the correlation be-tween metallicity and [α/Fe] ratios varies throughout the Galaxy, away from the mid-plane and outwards from the Galactic center (e.g. Recio-Blanco et al. 2014, Hayden et al. 2015, Weinberg et al. 2019, Magrini et al. 2017). Chemodynamical simulations of the Milky Way disk also show that the relation between the [α/Fe] and [Fe/H] ra-tios are expected to change for different galactocentric distances and height above the plane (e.g. Minchev et al. 2014, Sharma et al. 2020). In addition, the ”knee” position is found to vary for different dwarf spheroidal galaxies, a reflection of the wide variety of star formation histories in such systems (Venn et al. 2004;Tolstoy et al.
2009). While the level of [α/Fe] ratio in more metal-poor stars than the ”knee” metallicity depends on the IMF and preferential loss ofαelements by selective galactic winds, for example.
Thus, given this diagnostic power, probing the behav-ior of [α/Fe] versus [Fe/H] in different stellar popula-tions in the Milky Way is key to understanding how the Galaxy assembles and evolves. One such population that helps us understand our Galaxy is the TriAngulum-Andromeda (TriAnd) overdensity (e. g. Deason et al. 2014, Sheffield et al. 2014, Price-Whelan et al. 2015, Xu et al. 2015, Li et al. 2017, Sheffield et al. 2018, Helmi 2020). Situated in the second Galactic quadrant about 7 kpc below the galactic plane (Hayes et al. 2018), the TriAnd overdensity covers 100◦ < l < 150◦ and −15◦ > b >−35◦ (Rocha-Pinto et al. 2004; Deason et al. 2014;Sheffield et al. 2014;Perottoni et al. 2018) and was discovered in parallel by Rocha-Pinto et al.(2004) andMajewski et al.(2004) using large photometric sur-vey data from 2MASS, and using the Washington M, T2, DDO51 system, respectively. The complex nature of the TriAnd overdensity started to be unraveled only in more recent years by high-resolution spectroscopic stud-ies (Bergemann et al. 2018,Hayes et al. 2018,Sales Silva et al. 2019), which have concluded that the origin of the TriAnd system is likely linked to the interaction of the galactic disk with the satellite galaxy. However, the re-sults are not in complete harmony.
In the first study to use high-resolution spectroscopy for stars belonging to TriAnd overdensity, Chou et al. (2011) obtained a low [Ti/Fe] ratio for three TriAnd stars, a chemical pattern reminiscent of that found in dwarf galaxies, which was interpreted as an indication of an extragalactic origin for this overdensity. More re-cently, however,Bergemann et al. (2018) detected sim-ilarities of the chemical pattern of the TriAnd stars to the local Galactic disk in the elements O, Na, Mg, Ti, Ba, and Eu for a sample of stars with narrow metallic-ity range from−0.66≤[Fe/H]≤ −0.44. Using APOGEE results from DR14 (Abolfathi et al. 2018), Hayes et al. (2018) observed that the chemical pattern (Mg, (C+N), K, Ca, Mn, and Ni) of the TriAnd stars would repre-sent an extension of the radial disk metallicity gradi-ent to TriAnds radius. In our first study of the TriAnd population, we investigated the kinematics and chemical abundances of the elements Na, Al, Ni, Cr, Fe, Ba, and Eu (Sales Silva et al. 2019) in a stellar sample covering a larger metallicity range (−1.34≤[Fe/H]≤ −0.78) than previous high-resolution spectroscopy studies. Sales Silva et al.(2019) concluded that the stellar population in TriAnd presents disk-like orbits and a unique chemi-cal pattern that does not entirely resemble the full abun-dance pattern observed for the stars in the local Galactic disk, nor dwarf galaxies.
Here, we add to that picture the abundance deter-mination of Mg, O, Si, Ca, and Ti for the same seven TriAnd stars studied in Sales Silva et al. (2019) in
or-der to try to advance the unor-derstanding of the com-plex nature of TriAnd overdensity stars by probing the [α/Fe] abundance pattern. Most relevant is the fact that our sample has two low metallicity bonafide members of TriAnd ([Fe/H]∼-1.3), enabling the study ofαelements in a metallicity range never before studied in the TriAnd stellar population. In addition, the targets in this study also include stars that were found not to be members of TriAnd, which serve as a control sample for comparison to TriAnd stars, as well as to help gauge Galactic disk chemical trends with radius.
This paper is organized as follows: The next section describes the methodology to obtain the chemical abun-dances of the studied α elements. In Section 3, we present the results and discuss the chemical pattern of the TriAnd population (i.e., the [X/Fe] and [αh/ex]
ra-tios) in the context of the Galaxy and its neighbors. Concluding remarks can be found in Section 4.
2. TARGETS & METHODOLOGY
The targets analyzed here are the same as in our previous study (Sales Silva et al. 2019). We selected candidate TriAnd stars from the 2MASS catalog using the combination of a color criterion that segregates gi-ant stars from dwarf stars in the J-H versus H-K dia-gram (we are looking for giant stars from TriAnd) and the TriAnd overdensities regions from Perottoni et al. (2018). Thirteen candidate stars were observed with the Gemini telescope using the GRACES spectrograph to obtain high-resolution spectra (R = 40,000) covering the optical region (λ∼4,000 to 10,000 ˚A). We also analyzed an additional star fromBergemann et al. (2018) using a spectrum obtained from the ESO-Archive1. Based on kinematics (orbits and proper motion),Sales Silva et al. (2019) confirmed that seven out of the fourteen observed stars are members of the TriAnd overdensity.
The atmospheric parameters (Tef f, logg, ξ, and
[Fe/H]) for all target stars were computed previously inSales Silva et al.(2019); these are presented in Table 1. We used the MARCS atmospheric models ( Gustafs-son et al. 2008) and LTE code MOOG (Sneden 1973) to obtain the atmospheric parameters and compute the chemical abundances of Fe; the same code was used here to compute abundances of the chemical elements Mg, O, Si, Ca, and Ti. A unique solution for the atmospheric parameters was obtained using the excitation and ion-ization equilibrium approximations and the equivalent width independence with abundance of Fe I and Fe II lines. We also determined the atmospheric parameters for the Sun and Arcturus to test our methodologies, finding similar values to the parameters obtained in the literature for both stars (Sales Silva et al. 2019). Ad-ditional details about the methodology can be found in Sales Silva et al.(2019).
2.1. α-element Abundance Determination The abundances of theαelements in this study were determined using equivalent width measurements (for Mg, Si, Ca, and Ti) and spectral synthesis (for O). In Table 2, we present the adopted Mg I, Si I, Ca I, and Ti I line lists, along with the atomic parameters for the transitions (laboratorygf-values and excitation poten-tials obtained fromHeiter et al. 2015andSales Silva et al. 2016) and their respective equivalent width measure-ments. For the oxygen abundance derivation, we used the O I forbidden absorption line atλ6300.3˚A , having χ=0.0 eV and adopted loggf=−9.717 (Allende Prieto et al. 2001). Our line list for computation of spectral synthesis in the [O I] region is the same line list used in Sales Silva et al.(2014) that includes the absorption line of Ni I in 6300.336˚A (loggf=−2.31,Allende Prieto et al. 2001), which provides a very small contribution to the O line.
Table1contains the LTEα-element abundance results obtained in this study for the fourteen target stars. In Table 3 we present the derived α-element abundances for the Sun and the reference red-giant Arcturus using the same line list and same 1D-LTE methodology; we also present selected solar and Arcturus abundance re-sults from the literature. It can be seen that the so-lar abundances obtained here for Fe, Mg, Si, Ca and Ti overall compare well with the results fromGrevesse & Sauval (1999), andAsplund et al. (2009). For oxy-gen, however, there is a larger abundance discrepancy between the studies. In particular there is a difference between the literature results depending, among other things, on whether the analysis used 1D versus 3D mod-eling (Caffau et al. 2011). We note that our solar oxygen scale has a lower abundance (A(O)Sun=8.56). For
Arc-turus, our abundance results compare well with those from Ram´ırez & Allende Prieto (2011) and Jofr´e et al. (2015).
As a comparison of abundance scales, we also ana-lyzed one star from the Bergemann et al. (2018) sam-ple (2MASS23174139+3113043; star 14) using the same spectrum from the ESO archive they analyzed (see de-tails inSales Silva et al. 2019). Bergemann et al.(2018) determined the NLTE abundance of Mg and Ti for the star 14. Here we find similar values for the abundance ratios of Fe, Mg and Ti in NLTE as derived in Berge-mann et al.(2018), with a difference (This study - Berge-mann et al. 2018) of ∆[Fe/H]=0.02, ∆[Mg/Fe]= −0.09 and ∆[Ti/Fe]=−0.11.
In order to assess possible departures from LTE for the derived abundances we estimate NLTE corrections for our star sample. Based on the calculations presented inBergemann et al.(2013) andBergemann et al.(2015), the NLTE corrections for the selected transitions of Mg I, Si I and O I in this study are deemed to be negligible given the line list and the range in the atmospheric pa-rameters of our star sample. For estimating NLTE
abun-dances for Ca and Ti we use the studies byMashonkina et al.(2007) andBergemann(2011), respectively. Berge-mann(2011) built a Ti model atom with 216 energy lev-els to calculate NLTE departures for a large number Ti I absorption lines, including the fourteen Ti I lines mea-sured here;Mashonkina et al.(2007) used a model atom with 63 energy levels to define the NLTE corrections for a number of Ca transitions and these include the four Ca I lines studied here. Assuming that the NLTE cor-rections derived in these studies are valid to apply to our LTE abundances (which is a reasonable assumption given that they were computed for the same family of model atmospheres), we can correct our individual line abundances, line by line, and then compute the average Ti and Ca NLTE abundances for each star (Table 1). On average, the difference between the NLTE and LTE abundances for our sample is 0.10±0.03 dex for Ca and 0.09±0.01 dex for Ti. Table 1 also contains the NLTE [X/Fe] ratios for Ca and Ti for the target stars.
2.2. Abundance Uncertainties
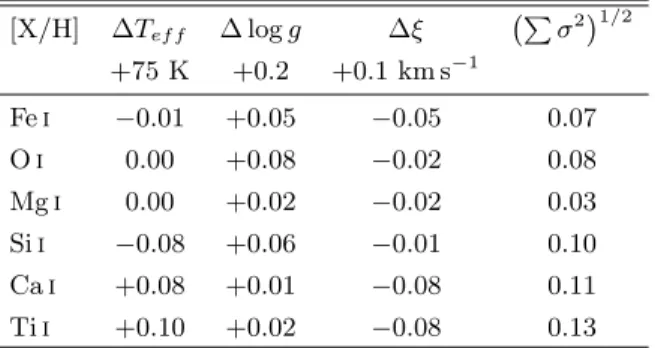
The atmospheric parameter uncertainties for the stars of our sample are 75 K, 0.2 dex and 0.1 km/s for Tef f, logg and ξ, respectively, as discussed previously
in Sales Silva et al. (2019). In Table 4, we present the abundance uncertainties regarding the target star 2MASS02510349+4342045, taken as typical in our sam-ple. To calculate the abundance sensitivities we con-sidered the abundance variations caused independently by each atmospheric parameter, varying these param-eters by their respective uncertainties; we determined the final uncertainties of chemical abundances adding in quadrature the uncertainties in abundance relative to each atmospheric parameter.
3. DISCUSSION
In Sales Silva et al. (2019), we carried out our first high-resolution spectroscopic study of stars belonging to TriAnd overdensity, deriving the abundances of Na, Al, Fe, Cr, Ni, and the heavy elements Ba and Eu. That study found that the TriAnd population had a unique chemical pattern that did not match that of the local disk, or of dwarf galaxies. Here, we continue our inves-tigation of the TriAnd region by deriving the abundance patterns of fiveα-elements — O, Mg, Si, Ca, and Ti — in the same stars studied previously inSales Silva et al.(2019).
3.1. α-Elements in the Triangulum-Andromeda overdensity
The TriAnd targets analyzed are all metal-poor, en-compassing a metallicity range between [Fe/H]=−0.78 and−1.34; in this study we find that most of the TriAnd targets analyzed show an overabundance of αelements relative to Fe (Table1).
In the different panels of Figure 1 we show the [O, Si, Ca, Ti/Fe] abundance ratios versus [Fe/H] obtained
Table 1. Target Stars, Stellar Parameters & Abundances
TriAnd stars
2MASS ID Teff logg ξ [Fei/H] [Mg/Fe] [Si/Fe] [Ca/Fe]LT E [Ca/Fe]N LT E [Ti/Fe]LT E [Ti/Fe]N LT E [O/Fe]
# K km/s 3 00594094+4614332 4100 0.4 1.77 −0.82±0.10 0.13±0.15 0.21±0.09 0.12±0.09 0.22±0.09 0.21±0.11 0.32±0.11 0.29 5 01151944+4713512 4075 0.7 1.99 −0.94±0.10 0.27±0.14 0.19 0.17±0.16 0.27±0.16 0.26±0.12 0.34±0.12 0.42 6 02485891+4312154 3900 0.5 1.82 −0.81±0.13 0.15±0.15 0.34±0.13 -0.06 0.04 0.05±0.10 0.13±0.10 0.25 7 23535441+3449575 4200 1.3 0.60 −0.78±0.10 -0.06±0.07 0.19±0.10 0.12±0.09 0.22±0.09 0.06±0.14 0.16±0.14 0.38 9 02350813+4455263 4050 0.5 0.59 −1.23±0.09 0.21±0.09 0.40±0.10 0.09±0.16 0.19±0.16 -0.08±0.12 0.01±0.12 0.11 11 02510349+4342045 4025 0.9 1.63 −0.78±0.10 0.15±0.06 0.26±0.08 0.01±0.13 0.11±0.13 0.01±0.13 0.11±0.13 0.29 12 02475442+4429269 4000 0.3 0.97 −1.34±0.12 0.34±0.07 0.39±0.07 0.09±0.16 0.19±0.16 -0.01±0.12 0.10±0.12 0.27 Non-TriAnd stars 1 00075751+3359414 4150 0.6 0.88 −1.71±0.09 0.25±0.14 0.20±0.10 0.36±0.08 0.45±0.08 0.05±0.11 0.12±0.11 0.63 2 00534976+4626089 3925 1.3 1.81 −0.46±0.10 0.05±0.03 0.38±0.11 -0.33±0.09 -0.29±0.09 -0.07±0.12 -0.01±0.12 0.25 4 01020943+4643251 4125 0.0 1.04 −1.50±0.11 0.30±0.19 0.45±0.13 0.23±0.06 0.33±0.06 0.14±0.12 0.25±0.12 0.57 8 23481637+3129372 3975 0.4 1.93 −1.42±0.08 0.22±0.20 0.59±0.08 0.22±0.14 0.29±0.14 0.28±0.10 0.37±0.10 0.67 10 23495808+3445569 3925 1.4 1.96 −0.63±0.10 -0.01±0.02 0.35±0.13 -0.13±0.18 -0.02±0.18 -0.09±0.09 -0.02±0.09 0.58 13 02463235+4314481 4100 0.6 1.98 −1.03±0.08 0.13±0.13 0.44±0.11 0.25±0.13 0.35±0.13 0.34±0.11 0.43±0.11 0.49 14 23174139+3113043 3925 0.3 1.62 −0.91±0.13 0.15 — 0.03±0.14 0.22±0.14 0.14±0.13 0.22±0.13 —
Table 2. Line Lists & Measured Equivalent Widths
Equivalent Widths (m˚A) Star
El. λ χ(eV) loggf Ref 1 2 3 4 5 6 7 8 9 10 11 12 13 14
Mgi 4730.04 4.34 −2.390 R03 23 96 — 28 — — — — — — — 85 64 — Mgi 6318.71 5.11 −1.940 Ca07 — 64 63 26 54 57 37 35 33 48 48 59 44 40 Mgi 6319.24 5.11 −2.160 Ca07 10 47 35 10 35 33 23 14 19 35 35 36 35 — Mgi 6319.49 5.11 −2.670 Ca07 4 — — — 23 23 — — 10 15 15 17 — — Sii 5793.08 4.93 −2.060 R03 — 54 45 25 36 52 32 38 36 45 45 44 47 — Sii 6125.03 5.61 −1.540 E93 — — — — — — — — — — — — 35 — Sii 6131.58 5.62 −1.680 E93 5 28 26 — — 21 14 — 13 — — 19 — — Sii 6145.02 5.61 −1.430 E93 6 — — 10 — — 23 — 20 23 23 28 32 — Sii 7760.64 6.20 −1.280 E93 — — — — — 11 13 — — — — — — — Sii 8728.01 6.18 −0.360 E93 19 44 50 30 42 37 39 38 33 45 45 38 48 — Cai 6161.30 2.52 −1.270 E93 58 — 131 66 136 133 83 — 74 143 143 126 130 121 Cai 6166.44 2.52 −1.140 R03 60 139 132 68 140 133 82 120 71 — — 124 140 111 Cai 6169.04 2.52 −0.800 R03 78 — — 85 — — 101 130 82 — — 145 — 145 Cai 6455.60 2.51 −1.290 R03 65 126 124 70 118 — 87 — 78 129 129 110 118 117 Tii 4758.12 2.25 0.510 L13 — — 120 — — — — — — — — — — — Tii 4759.27 2.26 0.590 L13 — — — — — 132 — — — — — 109 — — Tii 5043.58 0.84 −1.590 L13 — — — — — — — 127 — — — 126 148 — Tii 5062.10 2.16 −0.390 L13 23 — — — — — — 69 40 110 110 — 100 92 Tii 5113.44 1.44 −0.700 L13 49 — — 66 141 — 74 — 64 — — — — — Tii 5145.46 1.46 −0.540 L13 53 — 140 74 — — — 135 66 — — — 141 — Tii 5223.62 2.09 −0.490 N98 14 99 — — — — — — — — — — — 84 Tii 5295.78 1.07 −1.590 L13 36 142 134 56 113 — 60 126 — — — 103 118 — Tii 5490.15 1.46 −0.840 L13 45 — 139 62 — — 71 126 — 143 143 — — 132 Tii 5662.15 2.32 0.010 N98 — 127 111 53 114 — 64 96 — 115 115 104 119 101 Tii 5689.46 2.30 −0.360 N98 — 106 96 32 97 102 54 60 38 94 94 83 84 79 Tii 5922.11 1.05 −1.380 L13 59 — — — — — 88 140 — — — — — — Tii 5978.54 1.87 −0.440 B86 47 138 128 67 128 131 76 107 67 — — 115 128 120 Tii 6091.17 2.27 −0.320 L13 — 112 89 40 109 115 63 73 — 102 102 98 97 96 Tii 6126.22 1.07 −1.368 B83 — — — — — — — 141 — — — — — — Tii 6554.22 1.44 −1.150 L13 43 — 138 — 148 — 72 115 68 — — 126 131 147
References for loggf values: B83: Blackwell et al.(1983); B86: Blackwell et al.(1986); Ca07:Carretta et al.(2007); E93: Edvardsson et al.(1993); L13: Lawler et al.(2013); N98: Nitz et al.(1998); R03: Reddy et al.(2003)
Table 3. Arcturus and Solar abundances.
Sun Arcturus
El. This Grevesse & Asplund This Ramirez & Allende Jofr´e work Sauval (1999) et al. (2009) work Prieto (2011) et al. (2015)
Fe 7.50 7.50 7.50 6.91 6.98 6.92 O 8.56 8.83 8.69 8.56 8.66 — Mg 7.61 7.58 7.60 7.45 7.47 7.49 Si 7.60 7.55 7.51 7.27 7.30 7.24 Ca 6.40 6.36 6.34 6.02 5.94 5.92 Ti 4.94 5.02 4.95 4.68 4.66 4.59
Notes.A(0)Sun=8.76 inCaffau et al.(2011).
Table 4. Abundance Uncertainties
[X/H] ∆Tef f ∆ logg ∆ξ P σ21/2 +75 K +0.2 +0.1 km s−1 Fei −0.01 +0.05 −0.05 0.07 Oi 0.00 +0.08 −0.02 0.08 Mgi 0.00 +0.02 −0.02 0.03 Sii −0.08 +0.06 −0.01 0.10 Cai +0.08 +0.01 −0.08 0.11 Tii +0.10 +0.02 −0.08 0.13
Notes. The abundance sensitivities were computed for the star 2MASS02510349+4342045. Each column gives the vari-ation of the abundance caused by the varivari-ation inTef f, logg
andξ. The last column gives the net RMS uncertainty in the abundance after combination of the uncertainties in columns 2 through 4.
in this study for the TriAnd stars (filled red circles), along with the results obtained with the same method-ology for those targets in our sample that were not found to be members of TriAnd (shown as open red circles). Figure 1 also includes results for TriAnd from infrared APOGEE spectra (Hayes et al. 2018; orange triangles) and the two other high-resolution studies in the litera-ture (Chou et al. 2011, orange squares, andBergemann et al. 2018, orange circles). In addition, as comparisons to other stellar populations in the Milky Way, we also show results of optical studies from the literature for the halo (Ishigaki et al. 2012), field stars in the local disk (Bensby et al. 2014) and open clusters and Cepheids in the outer disk (RGC > 12 kpc; Yong et al. (2012),
Luck et al. 2011, Lemasle et al. 2013 and Genovali et al. 2015). Finally, we also show results for four dwarf galaxies: Sculptor (Geisler et al. 2005 and Shetrone et al. 2003), Carina (Koch et al. 2008and Shetrone et al. 2003), Fornax (Shetrone et al. 2003 and Letarte et al. 2010) and Sagittarius (Monaco et al. 2005andSbordone et al. 2007). The top panel of Figure2 shows the corre-sponding plot for magnesium with the same comparison samples.
The first highlight from our results in Figures 1 and 2(top panel) is that, in general terms, the TriAnd stars haveα-element abundances (except for Si) that are over-all displaced to lower values of [X/Fe] for a given [Fe/H] when compared to the results for the local Galactic trend. It is noticeable, however, that the derived [X/Fe] ratios for the TriAnd stars do not reach the lowest [X/Fe] ratios found in dwarf spheroidal galaxies (blue symbols); see, for example, the results for Fornax (shown as blue triangles), which overlap in metallicity range with the TriAnd stars. The [Si/Fe] ratios obtained for the TriAnd stars are slightly higher when compared to the otherα elements, being more similar to the low-metallicity end of the local disk pattern (at metallicities [Fe/H]∼ −1). These [Si/Fe] values also overlap those for a number of dSph stars — although the Si abundance results for the dwarf spheroidals in the figure extend to significantly lower values than those from either TriAnd or the local disk.
One important aspect in this comparison is that the derived abundances for TriAnd stars are offset from the results for those targets (shown as open red symbols) that did not have a high probability to being actual TriAnd members after an analysis of their orbits and proper motions; such stars can serve as a control sam-ple in comparison with the TriAnd stars. (See details of how sample stars were deemed as non-TriAnd members based on kinematical criteria inSales Silva et al. 2019). Figures1and2(top panel) show that the [X/Fe] ratios for theα-elements for the non-TriAnd stars are gener-ally higher and seem to overall follow the Milky Way halo pattern (shown as green open circles). Such dis-tinct abundance results for the non-TriAnd stars when compared to the TriAnd stars, all coming from a homo-geneous analysis, is reassuring that we may be detecting a different abundance pattern for the TriAnd population that is not simply due to systematic differences — with the caveat, of course, that this is all based on a small number of stars. In our previous study,Sales Silva et al. (2019) have also found that these same non-TriAnd tar-gets were chemically segregated from the stars members of the TriAnd overdensity.
Concerning other results for the abundances ofα ele-ments for TriAnd stars from the literature, Figures1and 2(top panel) show that, overall, the results fromHayes et al. 2018and Bergemann et al. 2018 (represented by orange triangles and circles, respectively) do not provide a dissonant picture: They generally fall below the local Milky Way pattern. However, a unique contribution of our sample is that it extends our mapping of TriAnd chemistry to a more metal-poor regime.
3.2. Trends in the [X/Fe] vs [Fe/H] Plane The main sources of enrichment of α-elements in the interstellar medium are high mass stars. Therefore, the [X/Fe] ratios and its trend for theα-elements of a stel-lar population can provide important information about
Figure 1. The abundance ratios of [O, Si, Ca and Ti/Fe] vs. [Fe/H] in different populations. The filled red circles represent our TriAnd member targets, while the open red circles are our non-TriAnd control sample. The orange triangles are the TriAnd stars from Hayes et al.(2018); the orange circles are the TriAnd stars fromBergemann et al. (2018); the orange squares are the TriAnd stars fromChou et al.(2011). Results for the Milky Way are also shown: the gray circles represent the local disk stars fromBensby et al.(2014); the purple circles are the thick disk stars fromReddy et al.(2006); the yellow circles are the open clusters from the outer disk fromYong et al. (2012); the yellow squares are the Cepheids from outer disk from Luck et al.(2011),Lemasle et al.(2013) andGenovali et al.(2015); the green circles are the halo stars fromIshigaki et al.(2012). The blue squares represent the stars from the Sculptor dwarf Galaxy fromGeisler et al.(2005) andShetrone et al.(2003); the blue hexagons are the stars from the Carina dwarf galaxy fromKoch et al.(2008) andShetrone et al.(2003); the blue triangles are the stars from the Fornax dwarf galaxy fromShetrone et al.(2003) andLetarte et al.(2010); the blue circles are the stars from the Sagittarius dwarf galaxy fromMonaco et al.(2005) andSbordone et al.(2007). The Ca and Ti abundances shown are the ones derived here in LTE, without NLTE corrections to better compare with the LTE chemical abundances of the literature. The error bars shown in the lower left corners of all panels represent the expected uncertainties in the derived abundance ratios.
the relative number of high to low mass stars (i.e., the IMF) and the rate of SN II to SNe Ia in the interstellar medium that formed these stars. Also, we can under-stand the chemical evolution of a population probing the [X/Fe] vs [Fe/H] pattern in low metallicity stars. In terms of iron abundances our TriAnd sample can be di-vided roughly into two groups, stars with [Fe/H] > − 1 (the more metal-rich ones that overlap in metallic-ity with the TriAnd sample discussed in Hayes et al. 2018) and the metal-poor TriAnd stars with metallicities [Fe/H]∼ −1.3. We discuss below the apparently distinct trends observed for the differrent alpha elements studied here, which are highly influenced by the low metallicity stars in the sample. However, we must regard any such derived trends as tentative, given the still small number of TriAnd stars studied both here and in the literature.
3.2.1. Oxygen and Titanium
The behavior of the O and Ti abundances with metal-licity seem similar (Figure 1), and their trends with metallicity appear to be at odds with those of the Milky Way pattern. Starting with the O and Ti abundances for those stars with higher metallicities in our TriAnd sam-ple, we can see that these roughly agree with the results fromBergemann et al.(2018, orange circles). However, the two lowest metallicity stars in our sample have lower [O, Ti/Fe] ratios, being less enhanced at low metallicity than at high metallicity. Such behavior does not follow the chemical pattern of the thick disk (or halo), rather, the [Ti, O/Fe] ratios for the low metallicity TriAnd stars overlap with results for dwarf galaxies (shown as blue symbols in Figure1).
Chou et al. (2011) found very low [Ti/Fe] ratios ([Ti/Fe]<−0.3) for three TriAnd stars in their sample
Figure 2. Abundance ratios of [Mg/Fe] vs. [Fe/H]. The symbols have the same meaning as in Figure1. In the bottom panel of the figure we show as black dots the APOGEE DR14 results for the Milky Way in the solar neighborhood (RGC = 9 - 10
kpc) along with its respective median tendency (shown as the green dashed-line); the orange and red dashed-lines correspond to the trends for the TriAnd stars fromHayes et al. (2018) and our study, respectively, for [Fe/H]<−1.0 dex, while the solid orange line corresponds to the linear fit for all TriAnd stars (Hayes et al. 2018,Bergemann et al. 2018and our study).
(see orange squares in Figure 1), attributing an extra-galactic origin to these stars and the TriAnd overdensity. None of the stars in our sample show as low [Ti/Fe] ra-tios (see Table 1); Bergemann et al.(2018) do not find such low [Ti/Fe] ratios either. We note that there are other stars in theChou et al.(2011) sample that exhibit higher [Ti/Fe] ratios, more in line with what we find for our sample.
3.2.2. Silicon and Calcium
The Si/Fe and Ca/Fe abundances obtained for the studied TriAnd stars are enhanced relative to solar (ex-cept for one star having a negative [Ca/Fe] = −0.06, Table 1). For silicon, we find a more ’canonical’ be-havior of [Si/Fe] with metallicity, or, more specifically we find that the metal-poor stars in our TriAnd sample have higher Si over Fe ratios when compared to the more metal-rich TriAnd stars. For Ca, the behavior is simi-lar but slightly flatter than for Si, however, not signif-icantly distinct. The Ca abundances for the APOGEE sample analyzed inHayes et al.(2018) (orange triangles) are in rough agreement with our results, but, as men-tioned previously, their sample does not extend much be-low metallicities bebe-low [Fe/H]=−1; there are no TriAnd results for Si in the literature. Therefore, considering all results the Si and Ca abundances for TriAnd seem
to indicate a tendency that the most metal-poor stars ([Fe/H] <−1) have more enhanced [Si, Ca /Fe] ratios when compared to the more metal-rich TriAnd stars; such behavior may be interpreted as indicative that, at metallicities below [Fe/H]∼ −1, TriAnd stars might be before where the so-called knee where the production of Fe from SNe Ia becomes significant, and where the [Si, Ca/Fe] abundance ratios are at a plateau, in a similar fashion to what is observed for the thick disk or halo pattern.
3.2.3. Magnesium
We find that all stars in our TriAnd sample, except for one, are enriched in Mg with respect to Fe, having a mean [Mg/Fe] of 0.17±0.13; the three lowest metallicity targets (Stars 5, 9 and 12) also have the highest [Mg/Fe] ratios (of 0.27, 0.21, and 0.34 dex, respectively; Table 1). The behavior for [Mg/Fe] versus [Fe/H] for TriAnd is similar to that of Ca and Si, whose ratios with respect to iron also increase with decreasing metallicity (see Figure 2).
Magnesium was the only α element studied both in Hayes et al.(2018) andBergemann et al.(2018). All of the TriAnd [Mg/Fe] ratios in the latter studies (shown in Figure 2 as orange circles and triangles) are slightly enhanced relative to solar. As previously noted, the
TriAnd sample in Bergemann et al. (2018) is concen-trated to in a small metallicity range (-0.66 ≤ [Fe/H] ≤-0.44) and they also find clustered magnesium abun-dances.
In Figure 2 (top panel) we show the [Mg/Fe] ratios as a function of [Fe/H] for TriAnd along with results for the same populations as discussed before, while in the bottom panel of Figure2 we show as black dots the APOGEE results for the Milky Way with 9 ≤RGC ≤
10 kpc (the same APOGEE sample of≈14,000 stars in their upper left panel of Figure 3 shown in the Hayes et al. 2018 study). We generally find the same pattern in the [Mg/Fe] versus [Fe/H] plane as observed for the otherα-elements: the TriAnd population is located be-tween the Milky Way disk and the dwarf galaxy popu-lations in the same metallicity range (see top panel in Figure2).
Figure2(bottom panel) shows that the two disk com-ponents (low and highα-sequences) in the [Mg/Fe] vs. [Fe/H] plane are clearly visible for the APOGEE sam-ple of Milky Way stars; the green dashed lines shown in the figure represent the median values of the low and high α-sequences for metallicity bins of 0.09 dex. (The thin disk sample is defined as [Mg/Fe]≤0.2 for [Fe/H] ≤ −0.25 and [Mg/Fe]≤0.15 for [Fe/H]≥ −0.25, while the thick disk stars as [Mg/Fe]>0.2 for [Fe/H]≤ −0.25 and [Mg/Fe]>0.15 for [Fe/H] ≤ −0.25. We also show as the full orange line the linear least-squares fit for all the TriAnd stars (from this study and the literature), which indicates a slight increase in [Mg/Fe] with the de-crease in metallicity ([Mg/Fe] =−0.082[Fe/H]−0.083). Such a pattern is reminiscent of an extension to lower metallicities of the radial [Mg/Fe] trend of more local thin disk stars (as proposed by Hayes et al. 2018) and this trend would pass through the TriAnd stars hav-ing disk orbits as indicated by their kinematics (Sales Silva et al. 2019). It is noted, however, that the lowest metallicity TriAnd star from theHayes et al.(2018) sam-ple (2M00591640+3856025, with [Fe/H]=−1.11) has a [Mg/Fe] ratio of 0.08 dex, indicating an approximately constant [Mg/Fe] behavior of the TriAnd population in APOGEE DR14 (dashed orange line in the bottom panel of Figure2).
Most interestingly, it can be seen that the results for the TriAnd stars analyzed in this study (shown as red circles), which are more metal-poor than those previ-ously studied, indicate roughly a parallel sequence to the Milky Way local disk at lower values of [Fe/H]: the stars with the lowest metallicity in our TriAnd sam-ple seem to indicate a more accentuated growth of the [Mg/Fe] ratio with the decrease of metallicity (dashed red line in the panel bottom Figure 2) indicating that the TriAnd population presents a shifted ’knee’ towards lower metallicities when compared to that characterized by the local Milky Way disk. This shifted ’knee’ can be a consequence of the overall decrease in metallicity with an increase in Galactocentric distance and height
above the plane, as predicted by models of chemical evo-lution of the Galaxy (e.g.,Minchev et al. 2014,Kubryk et al. 2015). It is observed that the [α/Fe] versus [Fe/H] pattern for Milky Way field stars in the APOGEE sur-vey varies with Galactocentric distance and across the Galaxy (e.g., Hayden et al. 2015, Queiroz et al. 2019). Such behavior could be typical of the very outer disk, which has hardly been proved up to now; a comparison of the TriAnd results obtained here with the disk behav-ior at the outskirts of the Galaxy will only be possible with future APOGEE data releases and the results of other Galactic surveys.
3.3. The [αh/ex] ratio
The production of α-elements in massive stars can happen either during the hydrostatic burning of C and Ne or during the SN II explosion (Woosley & Weaver 1995); although much more reduced than in SN II, dif-ferentαelements may have varying levels of production yields in SNe Ia (Iwamoto et al. 1999;Maeda et al. 2010). Possible differences between the abundance patterns of theαelements, for example, those formed by the hydro-static (like Mg and O) and the explosive process (like Si, Ca and Ti) and, in particular, the hydrostatic/explosive (h/ex) α element ratio may provide valuable insights on the chemical evolution of a population (Carlin et al. 2018;Blancato et al. 2019).
In Figure 3we show the [αh/ex] ratios versus [Mg/H]
ratio, where αhydrostatic=([Mg/Fe] + [O/Fe])/2 and
αexplosive=([Si/Fe] + [Ca/Fe] + [Ti/Fe])/3. The
sam-ples are the same as before and correspond to stars in the TriAnd overdensity, along with the Milky Way disk, halo, and dwarf galaxies. It is clear from Figure3 that the studied sample of TriAnd stars (red points) has a slightly positive αh/ex ratio with a relatively
small dispersion, having a mean [αh/ex]=0.08±0.05 (or,
0.02±0.06 if NLTE corrections were adopted for the de-rived LTE abundances of Ca and Ti, Table1); a similar [αh/ex] ratio is also found in Hayes et al. (2018) (∼0.1
±0.1 dex) andBergemann et al.(2018), except for one star in their sample that has a higher ratio. All in all, the TriAnd results are displaced in Mg from the local Milky Way disk (grey points) and thick disk (purple points). Carlin et al. (2018) discussed that the [αh/ex]
ratios for dwarf galaxies were displaced from the Milky Way trend. In particular, they modelled this result for the Sagittarius galaxy and concluded that such [αh/ex]
ratios were consistent with an IMF that lacked the most massive stars. The TriAnd results fall in the parameter space that is also occupied by stars in dwarf galaxies (blue symbols). However, the dispersion in the [αh/ex]
ratios for dwarf spheroidals is much larger probably due to the decay of this ratio in an approximately constant [Mg/H] ratio caused by the little enrichment in Mg after this decay starts (e.g.,Carlin et al. 2018).
Figure 3. Ratio between theα-elements formed by hydrostatic (Mg and O) and the explosive process (Si, Ca and Ti) versus [Mg/H]. Symbols have the same meaning as in Figure1.
In Sales Silva et al. (2019) we conducted our first analysis of stars in the TriAnd overdensity; the stud-ied sample covered a large range in metallicities, from −1.34≤[Fe/H]≤ −0.78. We analyzed the stellar kine-matics (orbits, proper motions and radial velocities) along with the chemical abundances of the elements Na, Al, Ni, Cr, Fe, Ba, and Eu. Sales Silva et al. (2019) concluded that the TriAnd population had a unique chemical pattern, not resembling any known population (dwarf galaxies, local disk, and halo). The results for the TriAnd stellar kinematics in that study indicated that its origin can be linked to the outer Galactic disk. In this study, we investigate the chemical pattern of five αelements in the same sample of TriAnd stars analyzed previously. Overall, our results for the TriAnd overden-sity in this study corroborate our previous findings: the chemical pattern of α-elements in the TriAnd overden-sity also differs from the local (thin and thick) disk. The results obtained for the TriAnd overdensity can be sum-marized as follows:
1) In general, the TriAnd stars analyzed have α-element abundances (except for Si) that are displaced to lower values of [X/Fe] for a given [Fe/H] when compared to the results for the local Galactic trend; in particular, these stars fall between the local disk and the dwarf galaxies in the [α/Fe] vs. [Fe/H] plane (Figure 1 and the top panel of Figure 2), although for Si the TriAnd stars show a pattern that is more similar to the local disk stars, a behavior that is also seen in some of the
stars in dwarf galaxies. The kinematical criteria used in Sales Silva et al. (2019) to classify our stars as TriAnd or non-TriAnd stars also chemically segregated them by the α elements, with the TriAnd stars showing lower [X/Fe] ratios than non-TriAnd stars in a similar metal-licity range; this indicates a clear distinction between the abundance pattern of the control sample (non-TriAnd) stars and the TriAnd stars, all analyzed homogeneously. 2) Our TriAnd sample has stars with [Fe/H] less than −1.2 dex, allowing us to probe the evolution of the α-elements in the low metallicity regime. For [Fe/H]< −1.2, the TriAnd stars studied here show an intriguing chemical pattern: for Mg, Si and Ca, the [X/Fe] ratios indicate an increase with a decrease in metallicity, while for the [O/Fe], and [Ti/Fe] ratios, we find a slightly de-creasing behavior relative to the more metal-rich TriAnd stars. For Mg, in particular, a linear least-squares fit to the results for the TriAnd population in the [Fe/H] vs. [Mg/Fe] plane in comparison with the tendency found for APOGEE DR14 abundance pattern for more local disk hints that the high [Mg/Fe] ratios for the lower metallicities TriAnd stars may correspond roughly to a parallel sequence at lower values of [Fe/H] relative to the Milky Way local disk, revealing a shifted ’knee’, for lower metallicities, for the TriAnd population relative to the more local disk. Thus, in addition to the TriAnd popu-lation representing an extension of the disk radial abun-dance gradient for the α-elements, as shown by Hayes et al.(2018), our results indicate that the TriAnd
over-density may also characterize a new knee for the outer disk.
3) In the [αh/ex] vs. [Mg/H] plane, the TriAnd stars
are displaced in Mg from the local disk pattern, stay-ing in the parameter space of some dwarf galaxy stars. However, TriAnd stars show a relatively small dispersion in the [αh/ex] ratio unlike the dwarf galaxy populations
that present a much larger dispersion.
The TriAnd overdensity presents a peculiar chemical pattern for the α elements, differing from the known stellar populations of our Galaxy. Comparisons with the disk field population at RGC >15 kpc is not yet possible
because the composition of the remote disk is still not known. In addition, the small number of TriAnd stars with determined chemical abundances, particularly with [Fe/H]< −1, also limits our present ability to under-stand the puzzling chemistry of TriAnd and place it into
an evolutionary and Galactic structure context. Clearly more high resolution spectroscopic observations of addi-tional TriAnd members at all metallicities is needed.
We thank Allyson Sheffield for providing the metal-licity data used in Sheffield et al. (2014). We thank Chris Hayes for extensive discussions. KC also thanks Kathryn Johnston and Verne Smith for discussions. JVSS thanks FAPERJ proc. 202.756/2016. JVSS, HDP, HJR-P and FA-F thank the Brazilian Agency CAPES for the financial support of this research. HDP thanks FAPESP proc. 2018/21250-9. This research has made use of the services of the ESO Science Archive Facility.
Facilities:
Gemini North:GRACES, ESO-Archive:VLT:UVESSoftware:
IRAF Opera REFERENCESAbolfathi, B., Aguado, D. S., Aguilar, G., et al. 2018, ApJS, 235, 42
Allende Prieto, C., Lambert, D. L., & Asplund, M. 2001, ApJL, 556, L63
Asplund, M., Grevesse, N., Sauval, A. J., & Scott, P. 2009, ARA&A, 47, 481
Bensby, T., Feltzing, S., & Oey, M. S. 2014, A&A, 562, A71 Bergemann, M. 2011, MNRAS, 413, 2184
Bergemann, M., Kudritzki, R.-P., W¨url, M., et al. 2013, ApJ, 764, 115
Bergemann, M., Kudritzki, R.-P., Gazak, Z., et al. 2015, ApJ, 804, 113
Bergemann, M., Sesar, B., Cohen, J. G., et al. 2018, Nature, in press
Blackwell, D. E., Menon, S. L. R., & Petford, A. D. 1983, MNRAS, 204, 883
Blackwell, D. E., Booth, A. J., Menon, S. L. R., et al. 1986, MNRAS, 220, 289
Blancato, K., Ness, M., Johnston, K. V., et al. 2019, ApJ, 883, 34
Caffau, E., Ludwig, H.-G., Steffen, M., et al. 2011, SoPh, 268, 255
Carlin, J. L., Sheffield, A. A., Cunha, K., et al. 2018, ApJL, 859, L10
Carretta, E., Bragaglia, A., & Gratton, R. G. 2007, A&A, 473, 129
Chou, M.-Y., Majewski, S.R., Cunha, et al., 2011 ApJL, 731, 30
Deason, A. J., Belokurov, V., Hamren, K. M., et al. 2014, MNRAS, 444, 3975
De Silva, G. M., Freeman, K. C., Bland-Hawthorn, J., et al. 2015, MNRAS, 449, 2604
Edvardsson, B., Andersen, J., Gustafsson, B., et al. 1993, A&A, 500, 391.
Geisler, D., Smith, V. V., Wallerstein, G., Gonzalez, G., & Charbonnel, C. 2005, AJ, 129, 1428
Genovali, K., Lemasle, B., da Silva, R., et al. 2015, A&A, 580, A17
Gilmore, G., Randich, S., Asplund, M., et al. 2012, The Messenger, 147, 25
Grevesse, N., & Sauval, A. J. 1999, A&A, 347, 348 Gustafsson, B., Edvardsson, B., Eriksson, K., et al. 2008,
A&A, 486, 951
Hayden, M. R., Bovy, J., Holtzman, J. A., et al. 2015, ApJ, 808, 132
Hayes C. R., Majewski, S. R., Hasselquist, S. et al., 2018, ApJL, 859, L8
Heiter, U., Lind, K., Asplund, M., et al. 2015, PhyS, 90, 054010
Helmi, A. 2020, arXiv e-prints, arXiv:2002.04340
Ishigaki, M. N., Chiba, M., & Aoki, W. 2012, ApJ, 753, 64 Iwamoto, K., Brachwitz, F., Nomoto, K., et al. 1999, ApJS,
125, 439
Jofr´e, P., Heiter, U., Soubiran, C., et al. 2015, A&A, 582, A81
Koch, A., Grebel, E. K., Gilmore, G. F., et al. 2008, AJ, 135, 1580
Kubryk, M., Prantzos, N., & Athanassoula, E. 2015, A&A, 580, A126
Lawler, J. E., Guzman, A., Wood, M. P., et al. 2013, ApJS, 205, 11
Lemasle, B., Fran¸cois, P., Genovali, K., et al. 2013, A&A, 558, A31
Li, T. S., Sheffield, A. A., Johnston, K. V., et al. 2017, ApJ, 844, 74
Luck, R. E., Andrievsky, S. M., Kovtyukh, V. V., et al. 2011, AJ, 142, 51
Maeda, K., R¨opke, F. K., Fink, M., et al. 2010, ApJ, 712, 624
Majewski, S.R., Ostheimer, J. C., Rocha-Pinto, H. J. et al., 2004, ApJ, 615, 738
Majewski, S. R., Schiavon, R. P., Frinchaboy, P. M., et al. 2017, AJ, 154, 94
Magrini, L., Randich, S., Kordopatis, G., et al. 2017, A&A, 603, A2
Mashonkina, L., Korn, A. J., & Przybilla, N. 2007, A&A, 461, 261
Matteucci, F. 2003, Ap&SS, 284, 539
Minchev, I., Chiappini, C., & Martig, M. 2014, A&A, 572, A92
Monaco, L., Bellazzini, M., Bonifacio, P., et al. 2005, A&A, 441, 141
Nitz, D. E., Wickliffe, M. E., & Lawler, J. E. 1998, ApJS, 117, 313
Perottoni, H. D., Rocha-Pinto, H. J., Girardi, L., et al. 2018, MNRAS, 473, 1461
Price-Whelan, A. M., Johnston, K. V., Sheffield, A. A., Laporte, C. F. P., & Sesar, B. 2015, MNRAS, 452, 676 Queiroz, A. B. A., Anders, F., Chiappini, C., et al. 2019,
arXiv e-prints, arXiv:1912.09778
Ram´ırez, I., & Allende Prieto, C. 2011, ApJ, 743, 135 Recio-Blanco, A., de Laverny, P., Kordopatis, G., et al.
2014, A&A, 567, A5
Reddy, B. E., Tomkin, J., Lambert, D. L., et al. 2003, MNRAS, 340, 304.
Reddy, B. E., Lambert, D. L., & Allende Prieto, C. 2006, MNRAS, 367, 1329
Rocha-Pinto, H. J., Majewski, S. R., Skrutskie, M. F., Crane, J. D., & Patterson, R. J. 2004, ApJ, 615, 732 Sales Silva, J. V., Pe˜na Su´arez, V. J., Katime Santrich,
O. J., et al. 2014, AJ, 148, 83
Sales Silva, J. V., Carraro, G., Anthony-Twarog, B. J., et al. 2016, AJ, 151, 6
Sales Silva, J. V., Perottoni, H. D., Cunha, K., et al. 2019, ApJ, 886, 113
Sbordone, L., Bonifacio, P., Buonanno, R., et al. 2007, A&A, 465, 815
Sharma, S., Hayden, M. R., & Bland-Hawthorn, J. 2020, arXiv e-prints, arXiv:2005.03646
Sheffield, A. A., Johnston, K. V., Majewski, S. R., et al. 2014, ApJ, 793, 62
Sheffield A. A., Price-Whelan A. M., Tzanidakis A., Johnston K. V., Laporte
Shetrone, M., Venn, K. A., Tolstoy, E., et al. 2003, AJ, 125, 684
Sneden, C. A. 1973, Ph.D. Thesis,
Tolstoy, E., Hill, V., & Tosi, M. 2009, ARA&A, 47, 371 Venn, K. A., Irwin, M., Shetrone, M. D., et al. 2004, AJ,
128, 1177
Weinberg, D. H., Holtzman, J. A., Hasselquist, S., et al. 2019, ApJ, 874, 102
Woosley, S. E., & Weaver, T. A. 1995, ApJS, 101, 181 Yong, D., Carney, B. W., & Friel, E. D. 2012, AJ, 144, 95 Xu, Y., Newberg, H. J., Carlin, J. L., et al. 2015, ApJ, 801,

![Figure 1. The abundance ratios of [O, Si, Ca and Ti/Fe] vs. [Fe/H] in different populations](https://thumb-us.123doks.com/thumbv2/123dok_us/9579347.2443763/6.918.152.747.92.509/figure-abundance-ratios-si-ca-ti-different-populations.webp)
![Figure 2. Abundance ratios of [Mg/Fe] vs. [Fe/H]. The symbols have the same meaning as in Figure 1](https://thumb-us.123doks.com/thumbv2/123dok_us/9579347.2443763/7.918.154.720.136.512/figure-abundance-ratios-mg-fe-symbols-meaning-figure.webp)
![Figure 3. Ratio between the α-elements formed by hydrostatic (Mg and O) and the explosive process (Si, Ca and Ti) versus [Mg/H]](https://thumb-us.123doks.com/thumbv2/123dok_us/9579347.2443763/9.918.159.754.96.519/figure-ratio-elements-formed-hydrostatic-explosive-process-versus.webp)
