Asbestos
G e z o n d h e i d s r a a d H e a l t h C o u n c i l o f t h e N e t h e r l a n d s
To the Minister of Housing, Spatial Planning and the Environment
P. O . B o x 1 6 0 5 2 V i s i t i n g A d d r e s s N L - 2 5 0 0 B B T h e H a g u e P a r n a s s u s p l e i n 5 T e l e p h o n e + 3 1 ( 7 0 ) 3 4 0 6 4 8 7 N L - 2 5 1 1 V X T h e H a g u e T e l e f a x + 3 1 ( 7 0 ) 3 4 0 7 5 2 3 T h e N e t h e r l a n d s E - m a i l : s i e s . d o g g e r @ g r . n l w w w . h e a l t h c o u n c i l . n l Subject : Presentation of advisory report Asbestos: Risks of environmental
and occupational exposure
Your reference : SAS/DBU/200627185 Our reference : I-637/06/SD/fs/459-F63 Enclosure(s) : 1
Date : 3 juni 2010
Dear Minister,
Your ministerial predecessor wrote to me (under reference SAS/DBU/200627185) asking for the Health Council’s advice on the risks associated with environmental exposure to asbestos. The then State Secretary for Social Affairs and Employment also sought the Council’s advice concerning the risks associated with occupational exposure to asbestos. I accordingly enclose herewith a report compiled by the Dutch Expert Committee on Occu-pational Safety (DECOS). The report was formulated in consultation with the Standing Committee on Health and Environment and also takes into account input from a number of national and international bodies. The latter feedback was solicited in June 2009, in the con-text of a public consultation exercise, which involved inviting interested parties to comment on a draft report.
In the report, the Committee puts forward new values corresponding to the risk levels defined in the context of environmental and occupational health policy. The values have been calculated on the basis of a new meta-analysis commissioned by the Committee, for which a selection of epidemiologic studies was made using predefined inclusion criteria. While it has not been possible to exclude all uncertainty from the calculated values, the state-of-the-art analysis undertaken has reduced the element of uncertainty to the minimum.
G e z o n d h e i d s r a a d H e a l t h C o u n c i l o f t h e N e t h e r l a n d s
Subject : Presentation of advisory report Asbestos:
Risks of environmental and occupational exposure
Our reference : I-637/06/SD/fs/459-F63
Page : 2 Date : 3 juni 2010 P. O . B o x 1 6 0 5 2 V i s i t i n g A d d r e s s N L - 2 5 0 0 B B T h e H a g u e P a r n a s s u s p l e i n 5 T e l e p h o n e + 3 1 ( 7 0 ) 3 4 0 6 4 8 7 N L - 2 5 1 1 V X T h e H a g u e T e l e f a x + 3 1 ( 7 0 ) 3 4 0 7 5 2 3 T h e N e t h e r l a n d s E - m a i l : s i e s . d o g g e r @ g r . n l w w w . h e a l t h c o u n c i l . n l I endorse the conclusions and recommendations that the Committee presents in its report. Copies of the report are being submitted to the Minister of Social Affairs and Employment and to the Minister of Health, Welfare and Sport.
Yours sincerely, (signed)
Prof. D. Kromhout Acting President
Asbestos
Risks of environmental and occupational exposure
to:
the Minister of Housing, Spatial Planning and the Environment the Minister of Social Affairs and Employment
the Minister of Health, Welfare and Sport No. 2010/10E The Hague, June 03, 2010
The Health Council of the Netherlands, established in 1902, is an independent scientific advisory body. Its remit is “to advise the government and Parliament on the current level of knowledge with respect to public health issues and health (services) research...” (Section 22, Health Act).
The Health Council receives most requests for advice from the Ministers of Health, Welfare & Sport, Housing, Spatial Planning & the Environment, Social Affairs & Employment, Agriculture, Nature & Food Quality, and Education, Culture & Science. The Council can publish advisory reports on its own initia-tive. It usually does this in order to ask attention for developments or trends that are thought to be relevant to government policy.
Most Health Council reports are prepared by multidisciplinary committees of Dutch or, sometimes, foreign experts, appointed in a personal capacity. The reports are available to the public.
This report can be downloaded from www.healthcouncil.nl. Preferred citation:
Health Council of the Netherlands. Asbestos: Risks of environmental and occupational exposure. The Hague: Health Council of the Netherlands, 2010; publication no. 2010/10E.
all rights reserved
ISBN: 978-90-5549-810-9
The Health Council of the Netherlands is a member of the European Science Advisory Network for Health (EuSANH), a network of science advisory bodies in Europe.
I N A H TA
The Health Council of the Netherlands is a member of the International Network of Agencies for Health Technology Assessment (INAHTA), an international collaboration of organisations engaged with health technology assessment.
Contents 9
Contents
Executive summary 11 1 Introduction 17 1.1 Background 17 1.2 Issues addressed 181.3 Structure of this report 18
2 Asbestos and the effects of exposure 21
2.1 Properties, production and applications of asbestos 21
2.2 Exposure to asbestos and background concentrations 24
2.3 Health effects 26
3 Current standards 31
3.1 Environmental and occupational risk levels 32
3.2 Asbestos-cancer exposure-response relationship 34
3.3 Existing environmental standards 38
4 Nature and quality of the epidemiological research 47
4.1 Measurement of asbestos exposure in epidemiological studies 47
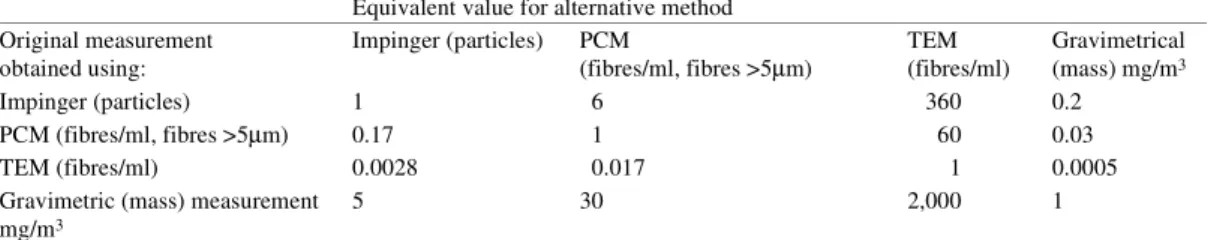
4.2 Use of conversion factors for the comparison of research results 48
4.3 Lack of detail concerning the quantification of exposure in the occupationally exposed cohorts 49
5 Recent risk analyses 51
5.1 Recent meta-analyses 51
5.2 The usefulness of recent analyses for the calculation of new standards for asbestos 52
5.3 The need for a new meta-analysis 55
6 Meta-analysis and calculations for lung cancer 57
6.1 Meta-analysis for lung cancer 58
6.2 Calculation of the concentrations that correspond to the reference environmental and workplace risk levels for lung cancer 65
7 Meta-analysis and calculations for mesothelioma 71
7.1 Meta-analysis for mesothelioma 72
7.2 Calculation of the concentrations that correspond to the reference environmental and workplace risk levels for mesothelioma 75
8 Conclusions: proposed new values for asbestos 81
8.1 New meta-analyses for lung cancer and mesothelioma 81
8.2 Proposed new MPR and NR values for the environment 83
8.3 Proposed new values for the workplace 84
References 85
Annexes 93
A VROM and SZW requests for advice 95
B The Committee 97
C Comments on the public draft 101
D Mortality figures and life table analyses 103
E Environmental exposure and asbestos-related health risks 105
F Calculation of KL values 107
Executive summary 11
Executive summary
Health Council of the Netherlands. Asbestos: Risks of environmental and occupational exposure. The Hague: Health Council of the Netherlands, 2010; publication no. 2010/10.
Background
Exposure to asbestos can cause cancer in various organs. The conditions most commonly associated with asbestos exposure are cancer of the pleura and perito-neum (known as mesothelioma) and lung cancer. Because these types of cancer often do not develop until years after exposure, environmental and occupational exposure to asbestos in the past continues to cause mortality.
In the Netherlands about eight million tons of asbestos-containing products were produced and consumed, in the previous century – much in the form of asbestos-cement products for use in the building industry, but also in a wide variety of other applications. Two main forms of asbestos are distinguished: serpentine asbestos (also known as chrysotile or white asbestos) and amphibole asbestos (which includes crocidolite, or blue asbestos, and amosite, or brown asbestos). Chrysotile asbestos accounts for more than 90 per cent of asbestos applications. The two most widely used types of amphibole asbestos are amosite and crocidol-ite.
Although the use of asbestos was prohibited in 1993, people are still being exposed, because asbestos used in the past is still present in many settings. Occu-pational exposure can still occur when homes and other buildings are demol-ished, when soil purification activities are undertaken, and when ships, drilling
platforms and other machines with asbestos insulation are repaired. Incidental exposure may take place in the context of building renovations and if asbestos is present in the environment.
Ministerial request for advice
In an advisory letter on asbestos submitted in 2006, the Health Council pointed out that new knowledge was available, which might justify revision of the stand-ards governing exposure to airborne asbestos. The State Secretary for Housing, Spatial Planning and Environmental Management at that time accordingly asked the Council to calculate the asbestos concentrations consistent with the risk lev-els defined in the context of Dutch environmental policy: the maximum permis-sible risk level (maximaal toelaatbaar risiconiveau, MTR) and the negligible risk level (verwaarloosbaar risiconiveau, VR). The State Secretary for Social Affairs and Employment additionally asked the Health Council to consider whether new occupational exposure limits for asbestos were necessary and, if so, to specify the concentrations corresponding to the risk levels defined by the government.
The risk analyses underpinning existing policy
The concentrations corresponding to a given risk level* are calculated by means
of risk analysis. Such analysis is based on data concerning groups of people who experienced occupational exposure in the last century. On the basis of the observed associations between asbestos exposure and lung cancer or mesotheli-oma incidence, so-called KL values (for lung cancer) and KM values (for
mes-othelioma) are calculated. These values are expressions of the increase in risk per unit of exposure.
The existing policy is based on reports published by the WHO and the RIVM in 1987. Those reports share two characteristics that are important in this context. First, the various calculations used the average of the KL and KM values from the
individual studies. In other words, no clearly defined allowance was made for the methodological quality of the studies in question. Second, both advisory bodies chose to make recommendations for various concentration intervals, partly because of the uncertainties that existed. However, it was not made clear how the intervals related to the corresponding calculations.
* A risk level is an expression of the likelihood of dying of cancer as a result of exposure to a particular carcinogen (in this case, asbestos).
Executive summary 13
The Committee’s risk analysis
In this report, the Committee presents detailed arguments for concluding that not all studies are equally suitable as sources of risk analysis data. In many cases, for example, the way the exposure is characterised introduces substantial measure-ment error. The quality of the available epidemiological data can vary considera-bly in other respects as well. The Committee therefore considered it essential that meta-analyses are performed for both lung cancer and mesothelioma, using only data from studies selected on the basis of predefined criteria. In this way the best possible point-estimate is obtained, and although the uncertainties are not elimi-nated, they are reduced as much as possible.
Lung cancer
For the lung cancer meta-analysis, the Committee made a selection from eight-een available cohort studies. On the basis of the Committee’s selection criteria, four studies were considered suitable for inclusion. The KL values calculated
using the data from these studies did not differ with the type of asbestos (chrys-otile or amphibole). The weighted average of the KL values (resulting in a
so-called pooled KL value) from the four selected studies has been used as the basis
for defining the ultimate values for lung cancer, as associated with all types of asbestos.
Mesothelioma
Where mesothelioma is concerned, clear differences in carcinogenic potential were discernible between chrysotile asbestos and the amphiboles. Separate KM
values were therefore calculated for these two general forms of asbestos. For its
mesothelioma meta-analysis, the Committee made a selection from twelve
avail-able cohort studies. Application of the Committee’s selection criteria led to just two of these cohort studies being deemed suitable for inclusion: one concerned exclusively with exposure to chrysotile asbestos and one concerned with expo-sure to a mixture of amosite and chrysotile asbestos, in which the latter was pre-dominant. The Committee used the KM values from these studies to calculate a
single value for chrysotile asbestos and a single value for exposure to a mixture of chrysotile asbestos and up to 20 per cent amphibole asbestos. However, in the Netherlands, various situations may occur that could result in exposure to amphi-bole asbestos on its own. The Committee has therefore calculated a KM value for
amphiboles, even though the studies in question did not satisfy the criteria for inclusion in the meta-analysis. The KM values used by the Committee indicate
that the carcinogenic potential of amphiboles is fifty times as great as that of chrysotile asbestos.
Risk analyses for environmental policy
The following table summarizes the conclusions of the Committee’s risk analy-ses for exposure to asbestos in the environment. Distinction has been made according to the type of fibre to which a person is exposed, and the concentration that corresponds to the risk levels defined by the government is stated in each case. The existing values are also presented for comparison.
The Maximum Permissible Risk (MTR) values calculated by the Committee for chrysotile asbestos are about forty times lower than the existing MTR values; the Committee’s MTR values for amphibole asbestos are roughly thirty times lower. The discrepancies are attributable not so much to higher KL and KM values –
where the divergence is relatively small – but mainly to methodological differ-ences. Two such differences are of particular significance. First, as indicated above, the current policy is based upon concentration intervals, as opposed to estimates for specific concentrations, which the Committee prefers to work with. Second, the existing MTR and VR values have been assigned to the upper confi-dence interval of the calculated concentration; this has a particularly pronounced effect.
On the other hand, the existing environmental quality objective is derived from the VR value, whereas, where other substances are concerned, the limit is derived from the MTR value. Consequently, although the existing MTR value for environmental exposure is considerably higher than the Committee’s value, the fact that the existing environmental quality objective for asbestos is based upon
Proposed new MTR and VR values and the existing values for asbestos by type. The values are for lifetime exposure from the general environment, expressed in fibres/m3 as measured using TEM (Transmission Electron Microscopy). The proposed values
are for the two health effects (mesothelioma and lung cancer) combined. The existing MTR and VR values are for mesotheli-oma only.
Proposed new MTR and VR values Existing MTR and VR values
Chrysotile in fibres per m3
Mixed exposure to chrysotile and up to 20% amphibole in fibres per m3
100% amphibole in fibres per m3 Chrysotile in fibres per m3 Amphibole in fibres per m3 MTR 2,800 1,300 300 100,000 10,000 VR 28 13 3 1,000 100
Executive summary 15 the VR value instead of the MTR value means that it is a hundred times lower
than the limit proposed by the Committee.
Risk analyses for occupational safety policy
The proposed occupational exposure limits for chrysotile, for a mixture of chrys-otile and up to 20% amphibole asbestos, and for amphibole asbestos on its own are presented in the table below.
The existing Dutch occupational exposure limit is 0.01 fibres/ml, as measured by phase contrast microscopy (which equates to a TEM value of 0.02 fibres/ml); this limit applies to all types of asbestos. The existing Dutch occupational expo-sure limit is not based on a calculated concentration corresponding to a given risk level, but is derived from (and ten times lower than) the current EU standard for chrysotile. The latter standard is based partly on the detection threshold for phase contrast microscopy. The concentrations calculated by the Committee to corre-spond to a risk level of 4.10-5 are substantially lower than the existing Dutch
occupational exposure limits.
Exposure levels by asbestos type for mesothelioma and lung cancer combined, corresponding to risk levels of 4.10-3 and 4.10-5.
The values are for occupational exposure (eight hours per day, five days per week, for a period of forty years) and are expressed in fibres per m3 (with fibres/ml between brackets), as measured by TEM.
Risk level Occupational exposure levels (as measured by TEM) corresponding to the risk level Chrysotile
in fibres per m3 (fibres/ml)
Mixed exposure to up to 20% amphibole in fibres per m3 (fibres/ml)
100% amphibole in fibres per m3 (fibres/ml)
4.10-3 200,000 (0.2) 130,000 (0.13) 42,000 (0.042)
4.10-5 2,000 (0.002) 1,300 (0.0013) 420 (0.00042)
The existing occupational exposure limit is expressed in the form of values as measured by PCM: 10,000 fibres/m3 or 0.01
fibres/ml; these figures equate to TEM values of 20,000 fibres/m3 or 0.02 fibres/ml.
NB: the existing Dutch occupational exposure limit is not based on a calculated concentration corresponding to a given risk level.
Introduction 17
1
Chapter
Introduction
1.1 Background
In the twentieth century, roughly eight million tons of asbestos-containing prod-ucts were produced and used in the Netherlands. These were predominantly asbestos cement products used in the construction industry, but included numer-ous other items. Although the use of asbestos has been outlawed since 1993, peo-ple can still be exposed to asbestos in the everyday environment.
Exposure to asbestos can lead to mesothelioma (cancer of the lining of the lungs and the internal chest wall, known as pleura; and the lining of the abdomi-nal cavities, known as peritoneum) and lung cancer. Because these types of can-cer usually do not become manifest until years after exposure, incidental and occupational exposure to asbestos in the last century continues to cause mortal-ity.
In 2007, about four hundred people in the Netherlands died from mesotheli-oma: a form of cancer for which exposure to asbestos is the only known cause. Modelling indicates that mesothelioma-related mortality in the Netherlands may yet rise to 490 people per year. If so, the total number of deaths due to mesotheli-oma in the period 2000 to 2028 will be more than 12,400.1
Lung cancer mortality attributable to exposure to asbestos is difficult to quantify, since lung cancer can also have other causes. Nevertheless, it is esti-mated that the annual number of deaths from this form of cancer would be 12% lower without exposure to asbestos.2
Thus, although the use of asbestos is no longer permitted, the health effects of its use will continue for some time to come.
Research by the Erasmus Medical Center Rotterdam, the Comprehensive Cancer Centre for the Twente Urban Triangle and the Twente hospitals has indicated that ongoing exposure to asbestos-containing waste (the so-called asbestos roads) in the area around Goor is the main reason for substantially above-average inci-dence of mesothelioma in local women.3 The research prompted the State
Secre-tary for Housing, Spatial Planning and the Environment (VROM) to ask the Health Council of The Netherlands for advice on the situation in 2006.4
The Health Council’s resulting 2006 advisory letter addressed the question of whether further knowledge had become available since 1987 – when the existing environmental quality requirements regarding asbestos were proposed – which would warrant the review of those requirements. The Council concluded that that was indeed the case, and the consensus was that the existing environmental qual-ity requirements should be reassessed.
1.2 Issues addressed
Following the advisory letter, the State Secretary for VROM asked the Health Council to re-evaluate the existing environmental quality requirements relating to asbestos exposure, and to propose revisions where appropriate. In addition, the State Secretary for Social Affairs and Employment (SZW) asked the Council to indicate the asbestos concentrations corresponding to the risk levels relevant in the context of occupational health and safety policy. Finally, the State Secretary for SZW requested that, in its report, the Council address certain matters relating to exposure and the methods used for its measurement in the workplace. The let-ters from the two State Secretaries seeking the Council’s advice are reproduced in Annex A.
1.3 Structure of this report
In section 2, the Dutch Expert Committee on Occupational Safety (Commissie
Gezondheid en Beroepsmatige Blootstelling aan Stoffen, whose members are
listed in Annex B) considers the general characteristics of asbestos and asbestos exposure, and the health effects associated with exposure to asbestos, in particu-lar the prevalence of mesothelioma. Section 3 describes the risk analyses which form the basis of existing Dutch and other standards; the extent to which the epi-demiological research data used for such risk analyses vary in nature and quality
Introduction 19 is highlighted in section 4. In section 5, having reviewed the recent asbestos risk
analyses, the Committee presents its conclusion that none of the analyses take (adequate) account of the variation in quality of the epidemiological studies; the Committee has accordingly commissioned new meta-analyses as a basis for cal-culating afresh the concentrations that correspond to defined environmental and workplace risk levels for both lung cancer and mesothelioma, in the context of which distinction is made between the better-quality studies and those that do not stand up to critical examination (subsections 6.1 and 7.1). On the basis of the bet-ter-quality studies, the Committee calculated the concentrations that correspond to the defined environmental and occupational risk levels for lung cancer (sub-section 6.2) and mesothelioma (sub(sub-section 7.2). The concentrations that the com-mittee ultimately presents in section 8 as corresponding to the risk levels recognised in the context of environmental and occupational health and safety policy take account of both lung cancer-related and mesothelioma-related mor-tality.
Asbestos and the effects of exposure 21
2
Chapter
Asbestos and the effects of exposure
In this section, the Committee presents background information on the proper-ties, production and applications of asbestos (subsection 2.1), exposure to asbes-tos and background concentrations (subsection 2.2), and health effects of exposure to asbestos (subsection 2.3).
2.1 Properties, production and applications of asbestos
2.1.1 Properties of asbestos
Asbestos is a mineral that is used mainly for its reinforcing, resilient and heat-resistant properties; it is the generic name for a group of naturally occurring fine inorganic fibres (mineral, inorganic metal silicates prone to longitudinal separa-tion). The length and shape of the fibres vary considerably, depending on factors such as the way the material is processed, its precise origin and the type of asbes-tos concerned. The properties of the fibres – and hence the potential applications of the various types of asbestos – are defined by the material’s chemical compo-sition and crystalline structure. Two main forms of asbestos are distinguished: serpentine or chrysotile asbestos, and amphibole asbestos:
• Chrysotile (also referred to as white asbestos) is a magnesium-containing sheet silicate whose flat structure is ‘rolled’ around a virtual axis to form a tube known as a fibril. A fibre normally contains several fibrils and is often inclined to curl. The fibrils give the fibre its strength and flexibility.
Chrys-otile asbestos has a silky structure and its microfibrils can have a diameter of less than 0.03 µm.
• Amphiboles contain less magnesium, but include iron, calcium and manga-nese and typically have a more glassy structure, making them less flexible, more brittle and more rough-textured than white asbestos. The diameter of the fibrils is never less than 0.1 µm, with the exception of crocidolite (approx. 0.05 µm). The two most widely used amphiboles are crocidolite (blue asbestos) and amosite (brown asbestos).
• The physical and chemical properties of the various types of asbestos are summarised in Table 1.
Amphibole asbestos fibres are to a very large extent chemically inert. Chrysotile fibres are also almost fully inert, but the magnesium in the outer layer of the fibre will dissolve in an acidic solution. The length and diameter of the fibres have a major influence on the health effects associated with each type of asbestos. In practice, asbestos fibres are usually a few tens of micrometers in length. The typ-ical diameters of chrysotile and amphiboles are summarised in Table 2. The dia-meters of glass, mineral wool and ceramic fibres are also given, by way of com-parison.
Table 1 Physical and chemical properties of the various types of asbestos. Serpentines Amphiboles
Mineral Chrysotile
(white asbestos) Amosite (brown asbestos)
Tremolite Actinolite Anthophyllite Crocidolite (blue asbestos)
Colour White, grey,
green, yellowish
Brown, grey, greenish
White to pale green
Green Grey, white, brownish-grey, green
Lavender, blue, green
Flexibility Good Intermediate Brittle Intermediate to
brittle Intermediate to brittle Good Melting point, decomposition temperature oC 800-850 600-900 1,040 Unknown 950 800 Specific mass (g/cm3) 2.55 3.43 2.9-3.2 3.0-3.2 2.85-3.1 3.37
Asbestos and the effects of exposure 23
2.1.2 Production and applications of asbestos
In antiquity, asbestos was used in earthenware, shrouds and lamp wicks. Modern industrial use began in about 1880, with the boom in extraction and use getting underway around 1910. At the start of the twentieth century, global production was roughly 30,000 tons a year; its peak was in 1975, when five million tons were produced (see Figure 1).
Figure 1 Global asbestos production from 1900 to the present day.5
Table 2 Typical fibre diameters of the various types of asbestos and other fibres.
Fibre type Diameter in micrometers
Chrysotile fibril 0.02-0.04
Chrysotile fibre 0.75-1.5
Amphibole fibril, type crocidolite 0.05-0.07
Amphibole ‘fibril’, other types 0.1-0.2
Amphibole fibre 1.5-4.0
Ceramic fibre 0.5-4
Glass fibre 1-5
The use of asbestos is now prohibited in the European Union; it has been ille-gal in the Netherlands since 1993 and throughout the EU since 2005. In the USA and Canada, there is no such complete ban, but it is nevertheless barely used any more. It is estimated that nearly eight million tons of asbestos-containing prod-ucts were used in the Netherlands prior to its prohibition, mainly asbestos cement products.
Despite the ban that exists in a significant part of the Western world, global asbestos production is still approximately two million tons a year. Indeed, global production has actually started to rise again in recent years. The principal pro-ducers are South Africa, Canada and Russia.
More than 90% of asbestos applications involve chrysotile (white) asbestos: a relatively cheap form of asbestos, which is also the most flexible. Amosite (brown asbestos) is used primarily for insulation and fire retardation, while croc-idolite (blue asbestos) is found mainly in insulation and asbestos cement prod-ucts. Table 3 summarises the historical applications of asbestos. As well as being incorporated into asbestos cement, plastics and resins, asbestos fibres were sometimes used in woven textiles.
2.2 Exposure to asbestos and background concentrations
Most occupational exposure to asbestos in the Netherlands occurred after the 1930s. The country had a sizeable asbestos-processing sector, in which insulation companies, shipyards and the asbestos cement industry were predominant. At least 330,000 workers experienced significant exposure to asbestos in the past; in the shipbuilding and ship repair industries, almost all workers were exposed to asbestos insulation in various forms.
Table 3 Common applications of asbestos. Corrugated roofing material
Exterior cladding
Underlay for vinyl floor coverings Plant containers
Windowsills
Spray-on coatings for steel structures Insulation material in old electrical appliances, such as toasters, hair dryers, irons
Brake linings Clutch plates Partitions and ceilings
Central heating boiler insulation Fireproof board
Asbestos textiles (fire blankets, welding blankets, gloves, etc)
Asbestos and the effects of exposure 25 Asbestos insulation was used on a large scale not only in shipbuilding, but also
by installation contractors and in the chemicals industry, the rubber and plastics industries, mechanical engineering, the metal products industry and the electro-technical industry. Asbestos cement was used extensively in construction and in the agriculture industry; this typically involved the sawing of asbestos cement slabs, often with an angle grinder. Until 1990, it was also standard practice to clean asbestos-containing brake linings, clutch plates and vibrating conveyor systems with compressed air.
Moreover, people working at asbestos-processing firms would often get asbestos fibres on their clothes and thus take them home, resulting in significant continued exposure outside the workplace. In the domestic environment, expo-sure could arise from the use of asbestos-containing products such as certain floor coverings, asbestos cement sheeting, insulation materials in electrical equipment and heating systems, and construction fillers.
Increasing concern regarding the health hazards led to a rapid decline in the use of asbestos and asbestos products after 1980. In 1993, all occupational handling and processing of asbestos was prohibited in the Netherlands, as a result of which its importation stopped.
Nevertheless, people are still being exposed to asbestos because it is still present in many settings. Occupational exposure can occur when homes and other buildings are demolished, when soil purification activities are undertaken, and when items such as ships, drilling platforms and machines that have asbestos insulation are repaired. Incidental exposure may take place in the context of building renovations and if asbestos is present in the environment. In the area around the former (Eternit) asbestos cement factories in the towns of Goor and Harderwijk for example, asbestos cement waste was used extensively for paving roads and yards up until the 1970s.
The RIVM* Guidance Document on Asbestos published in 1987 reported
background asbestos concentrations measured by TNO** in the preceding years
by means of transmission electron microscopy (TEM).6 In rural areas, the
back-ground concentrations were close to the detection limit of the TEM method then in use, i.e. 500 fibres/m3. In the Goor and Harderwijk areas, where asbestos was
previously used for road paving, higher asbestos fibre concentrations were reported, but the exposure level was generally much lower than that associated with occupational exposure in that era. In urban areas the outdoor atmospheric background concentrations were between 1,000 and 16,000 fibres/m3
(0.001-0.016 fibres/ml), but up to 80,000 fibres/m3 (0.08 fibres/ml) near to busy roads
and tunnels; this compared with 100 to 1,000 fibres/m3 (0.0001-0.001 fibres/ml)
in rural areas.*** Strictly speaking, the higher concentrations should not have
been described as background concentrations, since they were in fact the concen-trations in the vicinity of sources, such as road junctions (at a time when almost all vehicles had asbestos-containing brake linings).
In the past, workplace concentrations of between a few million and 200 mil-lion fibres/m3 (200 fibres/ml) were measured. The data reported in the RIVM
Guidance Document on Asbestos were measured before 1981 (when asbestos use was at its peak, well before the ban introduced in 1993).6
With a few exceptions, such as people living in certain locations near to Goor, most people nowadays experience very little exposure to asbestos fibres. Since the late 1970s, there has been no systematic measurement of background asbestos concentrations. However, when investigating workplace concentrations more recently, TNO has often performed reference measurements in uncontami-nated urban and non-urban areas. These unpublished measurements indicate that the existing background concentration is roughly 10-20 fibres/m3 (personal
cor-respondence, J. Tempelman, TNO). 2.3 Health effects
2.3.1 Toxicity and carcinogenity
Inhaled asbestos fibres can enter the smallest parts of the respiratory tract and the alveoli. Those that are not too large are then engulfed by macrophages; larger fibres can migrate into the tissue.
* The National Institute for Public Health and the Environment. ** Netherlands Organisation for Applied Scientific Research
*** The convention is that a fibre is counted if it is longer than 5 µm and its length:diameter ratio is at least 3:1. The quoted values obtained by electron microscopy therefore relate to fibres of at least the specified dimensions.
Asbestos and the effects of exposure 27 Fibres that are coughed up are liable to be swallowed, and then leave the
body after passing through the digestive tract. However, they can also enter the lymphatic system and thus be transported to parts of the body far from the lungs.
Over time, macrophages deposit iron-containing proteins (ferritins) on the larger fibres in the lungs. This coating leads to the formation of characteristic asbestos bodies in the pulmonary tissue. The number of such asbestos bodies is therefore broadly indicative of the level of asbestos exposure that a person has suffered. In response to the accumulation of asbestos fibres in the lung, fibrous tissue formation (pulmonary fibrosis) occurs; the particular form of diffuse pul-monary fibrosis caused by exposure to asbestos is referred to as asbestosis. It is believed that the presence of reactive oxygen species and direct contact between asbestos and adjacent cells contribute to the further development of asbestosis.7
In the surrounding tissue, asbestos can subsequently trigger the development of malignant growths.
The most common forms of malignant growth attributable to asbestos expo-sure are lung cancer and (pleural) mesothelioma (cancer of the membrane lining of the lungs, or pleura). Numerous possible mechanisms of disease have been investigated, including direct interaction with macro-molecules (proteins, RNA, DNA, membrane lipids), production of oxygen radicals by macrophages, and cell-mediated processes. However, no compelling evidence has been found that any of these mechanisms is responsible for the occurrence of lung cancer or mesothelioma.7-9
In the literature, it is generally assumed that asbestos fibres less than5µm in length have considerably less carcinogenic potential than longer fibres.7 The
greater carcinogenic potential of longer fibres may be related to the inability of macrophages to engulf such fibres (in humans, macrophages are between 14 and 21 µm).
2.3.2 Diagnosis and prognosis of mesothelioma and lung cancer
Mesothelioma is a malignant disease that usually results in death within one or two years of diagnosis. It normally affects the pleura (lining of the lungs and internal chest wall), but can also occur in the peritoneum (lining of the abdomi-nal cavity). In the Netherlands, exposure to asbestos was first linked to the occur-rence of mesothelioma by the occupational doctor, Stumphius, who studied people working at a shipyard in Zeeland,10 and by Zielhuis et al., who conducted
a patient-control study.11 In South Africa, Wagner et al. had previously
demon-strated a correlation between mesothelioma incidence and occupational exposure to crocidolite.12
Mesothelioma is diagnosed on the basis of a tissue sample (biopsy) taken from the suspect growth. If there is doubt as to how the biopsy observations should be interpreted, the case can be referred to the Netherlands Mesothelioma Panel (Nederlandse Mesotheliomen Panel, NMP), which reassesses a large pro-portion of biopsies in cases of suspected mesothelioma in the Netherlands. If the disease has progressed to the point where a biopsy of the affected pleura is not considered to be in the patient’s interest, a probable diagnosis can be made on the basis of the condition’s presentation and clinical progression. It is very unusual for treatment to lead to remission.
In about 80% of cases, it is possible to identify potentially causal exposure to asbestos in the patient’s past. In the other cases, such exposure cannot be con-firmed. Although other causes cannot be excluded in such cases, it is likely that, in the Netherlands, almost all mesotheliomas are attributable to asbestos.*,14
Since the 1950s, it has been known that lung cancer is also more prevalent in people who have worked with asbestos. However, in contrast to the situation with mesothelioma, there is a high background incidence of lung cancer in the non-exposed population (the general population). In the general population, lung cancer causes more deaths in men than any other type of cancer. The annual inci-dence in the Netherlands is seventy cases per 100,000 men and thirty per 100,000 women. Heavy smokers are at least fifteen times more likely to develop lung cancer than non-smokers.
2.3.3 Incidence of mesothelioma and lung cancer attributable to asbestos exposure
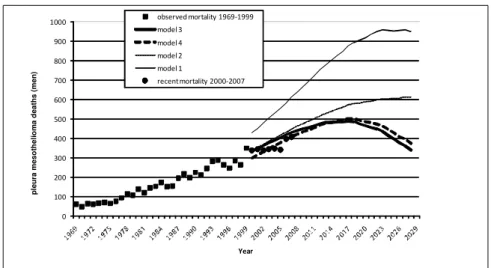
Rates of mesothelioma-related mortality in the years ahead can be forecast from mortality data for various birth cohorts. Using recent data, the most reliable model predicts 490 male pleural mesothelioma deaths per year in the Nether-lands, and a total of approximately 12,400 deaths between 2000 and 2028. Pleu-ral mesothelioma mortality in women is forecast to total about 800 cases between 2000 and 2028.1 Figure 2 shows the actual number of mesothelioma deaths in
men from 1969 to 1999. The Committee has added data on deaths between 2000 and 2007 to the original graph produced by Segura et al. (2003).1
Asbestos and the effects of exposure 29
Figure 2 Male mesothelioma mortality in the Netherlands. The estimates for the period after 1999 were obtained by modelling on the basis of various assumptions*.1 Data on deaths between 2000 and
2007 have been added to the original graph (black circles).
A recent international comparative study has revealed that the current level of mesothelioma-related mortality in the Netherlands is relatively high, even though asbestos was estimated not to have been more extensively used in the past in the Netherlands than elsewhere.15 The reason is not apparent. Figure 2 shows
mortal-ity from 2007 onwards, forecast on the basis of several modelling exercises, with different assumptions made in each case.1 The estimates involve some
uncer-tainty, however. The inclusion of data for the period 1994 to 1999 led to a 44% reduction in forecast mesothelioma mortality, compared with the figure produced by Burdorf and Swuste on the basis of data for the period up to 1993.16 The
authors indicate that the assumptions made for model 3 produce the most plausi-ble forecast.1 The mortality data for the period 2000 to 2007 added by the
Com-mittee confirm the reliability of the latter forecast.
The number of people who develop lung cancer as a result of asbestos expo-sure is harder to ascertain than the number of people who develop mesothelioma.
* Model 1 uses age and year-specific mortality data for the period 1969 to 1993 and assumes that there will be no mesothelioma in workers born in or after 1962. Model 2 additionally makes use of mortality data for the period up to and including 1998 (an extra five years’ data) and assumes that all workers born in or after 1962 have the same (small) risk of developing mesothelioma as those born in the period 1957 to 1961. Model 3 is an extension of model 2, in which the mesothelioma risk for all workers born in or after 1962 is deemed to be zero. Model 4 is an extension of model 3, which additionally makes allowance for a gradual reduction in the total population exposed to asbestos, estimated on the basis of the risk of mesothelioma in each five-year period, after correction for age and birth year. 0 100 200 300 400 500 600 700 800 900 1000 Year observed mortality 1969-1999 model 3 model 4 model 2 model 1 recent mortality 2000-2007 p le u ra m e s o th e li o m a d e a th s ( m e n )
It is often assumed that the trend in asbestos-related lung cancer mortality should be consistent with the malignant mesothelioma trend. While this may be true in workers who experience relatively low levels of exposure, in those who experi-ence high asbestos exposure, asbestos-related lung cancer mortality is several times higher than malignant mesothelioma mortality.17
A comprehensive Dutch epidemiological study suggested that 12% of all lung cancer cases in men could have been prevented by the avoidance of occupa-tional exposure to asbestos.2 The study subjects were men between fifty-five and
sixty-nine years old, who had been recruited in 1986 and who had been exposed to asbestos in the period around World War II and particularly in the postwar period. This estimate of the proportion of lung cancer mortality attributable to asbestos exposure is broadly consistent with figures from other countries: 6% in Scotland,18 14% in northern Italy,19 16% in Gothenburg (Sweden),20 and 19% in
Helsinki (Finland).21
Assuming that the Dutch estimate is valid, this equates to roughly 900 avoid-able cases a year in the Netherlands. Given that the relevant research used a cohort of older workers who had been exposed to high concentrations of asbes-tos, it may reasonably be assumed that asbestos exposure’s contribution to lung cancer mortality will decline in the future. However, as with mesothelioma, such a decline is unlikely to begin for some years, due to the length of the latency period.
Current standards 31
3
Chapter
Current standards
The International Agency for Research on Cancer (IARC) has recently reaf-firmed its conclusion that asbestos is a human carcinogen and that all types of asbestos are causally associated with mesothelioma and lung cancer.22
Further-more, the IARC22 asserts that there is now also adequate evidence that asbestos
causes ovarian and laryngeal cancer. However, the asbestos-related risk is much higher for lung cancer and mesothelioma than for the other cancers.7,23-25 Lung
cancer and mesothelioma risks were therefore used to define standards. Asbesto-sis occurs only in association with exposure to concentrations (more than 10 fibre-years, measured using TEM14,24) that are generally a lot higher than the
concentrations associated with lung cancer and mesothelioma in a regulatory context. Therefore asbestosis was also ignored in this standard setting process. In subsection 3.1, the Committee begins by considering the risk levels used for carcinogens in the context of environmental and occupational health and safety policy. In subsection 3.2, the Committee examines the exposure-response rela-tionship between asbestos and cancer, and the principles and assumptions used to calculate cancer risk. The existing environmental standards are described in sub-section 3.3, and the existing workplace standards in subsub-section 3.4.
3.1 Environmental and occupational risk levels
3.1.1 Environmental risk levels
In the context of policies for the management of risk associated with substances in the environment, two risk concepts play important roles: the ‘maximum per-missible risk (MPR) level’ and the ‘negligible risk (NR) level’. It is assumed that any exposure to a genotoxic carcinogen entails some risk of cancer; in other words, there is no safe level of exposure, (also known as a ‘threshold’ in the sci-entific literature). Policy concerned with such substances is therefore aligned with what is deemed to be a permissible level of risk that a given form of cancer will occur following exposure*. A year of exposure to the concentration corre-
sponding to the MPR should result in a risk of cancer mortality not exceeding one in a million (10-6)**. The cancer mortality risk associated with year-long
exposure to the concentration corresponding to the NR should not exceed one in a hundred million (10-8).
However, risk analyses for asbestos (including the risk analysis presented in this report) involve the calculation of a concentration corresponding to a given risk of developing mesothelioma or lung cancer later in life, as a result of one’s total lifetime exposure (cumulative exposure). From the policy document ‘Premises for risk management’, it may be deduced that a cancer mortality risk of one in ten thousand (10-4) associated with lifetime exposure is equivalent to the
MPR.26 Since the negligible risk (NR) level is defined as a level of risk a hundred
times lower than the MPR, the NR (in policy terms) is equivalent to a risk of one in a million (10-6) associated with lifetime exposure.
In other words, the Committee calculated concentrations (or exposure limits) that correspond to:
• A cancer mortality risk of one in ten thousand associated with lifetime expo-sure. In this report, this risk is referred to as the 10-4 risk (for lifetime
expo-sure). For policy purposes, this value equates to the MPR value.
* The precise effect mechanism of asbestos is not known; on precautionary grounds, it is therefore assumed that there is no safe level of exposure to asbestos.
** The policy document in which the MPR is defined states that all induced cancers are assumed to result in death.26
In this report, the Committee calculates values for lung cancer and mesothelioma, which may indeed be expected to lead to death.
Current standards 33 • A cancer mortality risk of one in a million associated with lifetime exposure.
In this report, this risk is referred to as the 10-6 risk (for lifetime exposure).
For policy purposes, this value equates to the NR value.
The concentrations stated in this report as corresponding to the above-mentioned environmental risk levels (10-4 and 10-6 lifetime exposure) have been calculated
on the assumption that exposure is measured by means of transmission electron microscopy (TEM)*.
3.1.2 Risk levels and occupational exposure limits
Under the current procedure, the Minister of Social Affairs and Employment asked the Health Council to calculate the airborne asbestos concentrations corre-sponding to the following risks:
• 1 extra cancer death for every 250 deaths from all causes, given forty years of occupational exposure. This equates to a risk of 4.10-3 associated with
expo-sure throughout a person’s working life. The annualised equivalent is a risk of one in ten thousand deaths (1.10-4 per year)
• 1 extra cancer death per 25,000 deaths from all causes, given forty years of occupational exposure. This equates to a risk of 4.10-5 associated with
expo-sure throughout a person’s working life. The annualised equivalent is a risk of one in a million deaths (1.10-6 per year)**.
Where asbestos is concerned, the values relate to the extra mesothelioma-related mortality or asbestos-related lung cancer (exposure measured using phase con-trast microscopy (PCM)).
The standard procedure is for the Social and Economic Council (SER) to then be asked to report on the technical and economic feasibility of realising the concen-trations corresponding to the two risk levels. Finally, the Minister of Social Affairs and Employment sets an exposure limit.
* There is a strong possibility that non-asbestos fibres (e.g. paper, cotton, mineral wool and glass fibres) will be present in the environment. It is therefore advisable to use TEM or Scanning Electron Microscopy (SEM), in order to differentiate adequately. In a workplace setting where it is considered less likely that other fibres will be encoun-tered, phase contrast microscopy (PCM) may be used. The conversion of values obtained by PCM analysis to be equivalent to TEM-based values is considered in section 4.
3.2 Asbestos-cancer exposure-response relationship
Epidemiological research data have been used to specify the associations (and exposure-response relationships) between (the level of) exposure to the various types of asbestos and the occurrence of lung cancer and mesothelioma. By mak-ing assumptions regardmak-ing matters such as the duration/length of the latency period, interaction (joint effect, or effect modification) between asbestos expo-sure and smoking (where lung cancer is concerned), and average life expectancy, it is possible to perform a risk analysis using the exposure-response relationship data, and thus to calculate the risk of mesothelioma or lung cancer associated with a given level of exposure.
3.2.1 Exposure-response relationships: fibre exposure and lung cancer
Epidemiological research has shown that the risk of lung cancer increases as the total amount of inhaled asbestos (usually expressed as the cumulative exposure) increases. The cumulative exposure – usually quantified in ‘fibre-years’, i.e. (fibres/ml) × years – is the product of the exposure concentration in fibres/ml air and the exposure duration in (working) years*. A meta-analysis by Hodgson and
Darnton (2000) identified a relationship between cumulative exposure and lung cancer mortality, which took a form that was between a linear association and a quadratic association, based on a regression analysis across all studies
included.27 However, in one study using relatively high quality exposure
infor-mation, a linear relationship between exposure and lung cancer risk was observed.28 In view of the aforementioned research results, analyses of lung
can-cer risk have assumed a linear increase in the effect of asbestos exposure on lung cancer incidence with increasing exposure. This linearity is represented by KL:
the gradient of the exposure-response relationship, normally expressed as the increase in lung cancer risk per fibre-year of exposure.
So, for example, given a cumulative exposure of 100 fibre-years, a KL value
of 0.01 will result in a doubling of the relative risk of lung cancer**.
* The fibre-year ‘unit’ is therefore an expression of fibres/ml of air times years. Since this is the standard unit used in the literature, values expressed in this way have, in the context of this report, not been converted into fibres/m3
times years.
** The lung cancer risk, as established in cohort studies, is usually expressed as relative risk (RR). This is risk in the exposed population divided by the risk in the non-exposed population (the general population or a control group). RR and KL are related according to the formula: RR=1+KL x f x d, where f x d = cumulative exposure in fibres/ml
Current standards 35 KL values are often reported as 100×KL, because the actual value of KL is low.
In order to analyse the lung cancer risk associated with asbestos, it is impor-tant to take account of the interaction between asbestos exposure and smoking. A study published in 1968 demonstrated that the combination of asbestos exposure and smoking resulted in a risk of lung cancer that exceeded the sum of the sepa-rate risks.29 On the basis of a recent meta-analysis, it is now believed that the
combined risk is between the sum of the separate risks (additive interaction) and the multiple of the separate risks (multiplicative interaction), making it difficult to define using a simple function.27,30 A recent study, in which a large cohort of
people exposed to chrysotile asbestos were followed for a long period, provided further evidence that the combined effect of smoking and asbestos exposure is less than a multiple of the separate effects.31 Nevertheless, for practical reasons,
smoking and asbestos exposure are usually assumed to have a multiplicative effect.
3.2.2 Exposure-response relationships: fibre exposure and mesothelioma
Cancer risk is determined by the cumulative exposure; a function of concen-tration and duration. However, with mesothelioma there is a very long latency period of about thirty to forty years. This is probably due to the length of time needed for the fibres to migrate through the lung tissue to the pulmonary mem-brane (pleura). Figure 3 shows how time since first exposure, age and mesotheli-oma risk are associated.
Figure 3 Association between time since first exposure, age and risk of mesothelioma. Diagram A shows three (part) cohorts (from the same study), with first exposure occurring at various ages (indicated as t1=0, t2=0 and t3=0). In diagram B, the curves have been shifted so that the age of first exposure is the same (t1,t2,t3=0); it will be seen that the curves then coincide (adopted from 32).
The incidence density of mesothelioma-related mortality (KM ) can adequately
be defined by the following formula (EPA 1986)24
I(t,f,d) = KM x f x [(t-10)3-(t-10-d)3] if t > 10+d
= KM x f x (t-10)3 if 10+d > t >10
= 0 if 10 > t
Where: I(t,f,d) equals the mortality density (expressed in the mesothelioma-related mortality in year t), depending on t (the number of years since first expo-sure), f (the exposure level in fibres/ml), d (the exposure duration in years); 10 is the minimum latency period required between exposure and effect (in years). This formula gives the expected likelihood of mesothelioma in a given year, e.g. the seventieth life-year of someone who was exposed to asbestos at work between the ages of twenty and forty. A person’s cumulative lifetime risk is cal-culated by summation of the risks calcal-culated for each year since first exposure. However, this will result in a significant overestimate, since it is necessary to take account of the lifetime risk of mesothelioma-related mortality and mortality from other causes. This formula cannot therefore serve as direct input for risk analysis, but needs to be used in combination with life tables (see Annex D). The background incidence of mesothelioma in the general population is very low. The exposure-response relationship between asbestos and mesothelioma can therefore most easily be defined in terms of absolute risk.*
In the formula above, the incidence density of mesothelioma is expressed as the number of cases per 100 000 person-years; hence, the value of KM is very
low. KM is consequently often expressed as a number times 108.**The
relation-ship between incidence density and exposure duration is not linear but exponen-tial, as may be deduced from figure 3. KM values and the time factor exponent
have been estimated using various models and data from various cohorts. In a model, the values of KM, the exponent of the time factor and the assumed
latency period are interrelated. The most widely used model is the EPA model, in
* Where lung cancer is concerned, the relationship is defined in terms of a relative risk (RR), a risk relative to the background incidence of lung cancer; see subsection 3.2.1.
** The formula presented above defines the mesothelioma incidence (density), which the committee has used in com-bination with so-called ‘life tables’ (see Annex D) to calculate lifetime risk. To calculate lifetime risk or the cumu-lative incidence, the formula has to be integrated; the dimension associated with the KM value is then: (fibres/ml x
Current standards 37 which an exponent value of 3 and a minimum latency period of ten years provide
the ‘best fit’ with the data.24 Berman and Crump (2008) recently tested the most
up-to-date data for the cohorts against this model and again observed a good fit.33
The Committee has therefore used the EPA model for the calculations presented in this report (with a value of 3 assigned to the time factor exponent and assum-ing the minimum latency period to be ten years). The combination of the expo-nent and the modelled latency period of ten years approximates the ‘actual latency period’, which is generally thought to be about thirty to forty years.
3.2.3 Principles and assumptions for the calculation of cancer risk
Given the defined exposure-response relationships for lung cancer and mesothe-lioma, it is possible to calculate the concentrations that correspond to the speci-fied environmental and occupational risk levels. All the information necessary to make the calculations is extracted from epidemiological literature. Various assumptions then need to be made, such as the following:
• The duration of occupational exposure is usually assumed to be forty years at 1920 hours per year. The duration of environmental exposure is assumed to be life-long.
• Calculations can be made using assumed average or maximum human life expectancy figures. However, it is better to work from the life expectancies defined in ‘life tables’, which take account of the risk of dying from some other cause (‘competing risks’). Hence, the likelihood of dying from asbes-tos-related mesothelioma or lung cancer is calculated for each life year (allowing for the likelihood of dying from another cause).
• The calculations are normally made using a minimum latency period of ten years.
• Where lung cancer is concerned, assumptions need to be made regarding interaction between the effects of smoking and those of exposure to asbestos. • The levels of exposure observed in less recent epidemiological studies are
generally significantly higher than those experienced by modern-day work-ers. Extrapolation to a much lower exposure level corresponding to the risk level used for regulatory purposes is usually required. In the context of such extrapolation, a linear relationship is normally assumed to exist between exposure and effect.
• The principles and assumptions adopted by the Committee are set out in sub-sections 6.2 and 7.2.
3.3 Existing environmental standards
The calculation of the existing Dutch MPR and NR values for asbestos is described in the RIVM Guidance Document (1987);6 this document and the
cal-culation method were the subject of a 1988 Health Council report.34 The RIVM
Guidance Document follows the WHO’s guidelines25 (published in 1987), except
in relation to chrysotile asbestos.
On the following pages, the Committee summarises first the WHO
guidelines25 and then the proposals set out in the RIVM Guidance Document on
Asbestos, concerning MPR and NR values for the Netherlands.6
In relation to mesothelioma, the WHO’s advice draws upon the risk analyses per-formed by two USA bodies: the National Research Council (NRC, 1984) and the Environmental Protection Agency (EPA, 1986).24,35 Where lung cancer was
con-cerned, the WHO made its own calculations.
The WHO, the US Academy of Sciences and the US EPA all indicate that findings of any separate risk analyses for lung cancer and mesothelioma will be divergent.24,35,36 The calculation is based on epidemiological data regarding the
working population. In order to enable comparison between, on the one hand, the WHO guidance and the analyses presented by the WHO and, on the other hand, the concentrations that correspond to the relevant environmental risk level, all values quoted in this subsection have been converted to concentrations corre-sponding to a risk level 10-4 (for lifetime exposure), as measured by means of
TEM*.
3.3.1 WHO risk analysis for lung cancer
Availability of analytical data at the time of the WHO risk analysis
Table 4 presents the KL values used in risk analyses performed by the US EPA,
the US Consumer Product Safety Commission (CPSC), the NRC, Canada’s Ontario Royal Commission (ORC) and the UK Health and Safety Executive (HSE)17,24,35-37 prior to formulation of the WHO report.25 It will be apparent that
the studies differ particularly in terms of the estimated risk per unit exposure (vertical). Differences in KL value were also observed within individual studies.
* The Committee assumes that the values obtained by means of TEM were twice as high as those obtained by PCM; see subsection 6.2.1.
Current standards 39 The latter differences were due to variation in the selected conversion factors and
statistical analysis (and, in some cases, in the cohort re-analysis method).
In 1987, on the basis of a review of KL values by Liddell (1985),53 the WHO25
estimated that the average 100×KL value was 1. The 1986 EPA risk analysis is
often cited in the literature, because of the extensive KL value calculations it
involved24; for lung cancer, the average 100×K
L value was put at 1. This figure
was obtained by working out the average of the KL values from all the available
epidemiological studies (except for those concerning mine workers), in some cases after making certain corrections (e.g. for differences in the background lung cancer mortality levels assumed in the context of a cohort study and the national or regional mortality figures). Studies of mine workers44-46 generally
indicate a lower risk; it has been suggested that this may be due to the fibres encountered during extraction having a different length:diameter ratio from those encountered during processing.
Table 4 Comparison of lung cancer risk estimates from earlier risk analyses (adopted from 17) that were based on cohort studies
of exposed workers. The reported figures are 100×KL values: the increase in lung cancer risk per unit of asbestos exposure (fibre-years).
Auteur 100×KL-value in (fibres/ml×year)-1
EPA CPSC NRC ORC HSC
Dement et al.38 2.8 2.3 5.3 4.2
McDonald et al.39 2.5 1.25
Peto et al.40 1.1 1.0 0.8 1.0 0.54
McDonald et al..41 1.4
Berry & Newhouse42 0.058 0.06 0.058
McDonald et al.43 0.010 McDonald et al.44 0.06 0.06 0.06 0.02-0.046 Nicholson et al.45 0.17 0.12 0.15 Rubino et al.46 0.075 0.17 Seidman47 4.3 6.8 9.1 Selikof et al.48 0.75 1.0 1.7 1.0
Henderson & Enterline49 0.49 0.50 0.3 0.069
Weill et al.50 0.53 0.31
Finkelstein51 6.7 4.8 4.2
Newhouse & Berry52, ( Men) 1.3
(Women) 8.4
(Geometrical average) value used for the risk analysis (100×KL)
1.0 0.3-3 2.0 0.02-4.2 1.0
EPA (1986): Environmental Protection Agency (US); CPSC (1983): Consumer Product Safety Commission (US); NRC (1984): National Research Council (US); ORC (1984): Ontario Royal Commission (Canada); HSC (1979): Health and Safety Executive (UK) 17,24,35-37
All the studies used by the EPA involved workers with relatively high levels of cumulative exposure. The average exposure varied between 31 and 400 fibre-years. For lung cancer, for example, the NRC initially calculated 100×KL values
for nine studies, which varied from 0.06 to 9.1.35 The median value of 100×K L
was 1.1, but for its risk analysis the NRC decided to adopt a 100×KL value of 2.
The EPA, HSC and WHO all used 1 as the value of 100×KL.17,24,36
WHO lung cancer calculation
The assumptions and principles adopted by the WHO25 for its calculation of lung
cancer risk included the following:
• Smokers are ten times more likely to develop lung cancer than non-smokers. The joint effect of asbestos exposure and smoking (interaction) is assumed to be multiplicative.
• The value of 100×KL is put at 1, which implies that a cumulative exposure of
100 fibre-years would double the risk of lung cancer.
• Lifetime exposure implies exposure over a period of seventy years; smokers are assumed not to have smoked for the first twenty years of life.
• The estimated concentrations are as measured using PCM; TEM-measured values will be twice as high (conversion factor = 2).
As well as providing its own risk analysis, the WHO presents the findings of three other risk analyses, including those by the EPA and the NRC.24,35,36 The
figures calculated for male smokers by the WHO, NRC and EPA are between 260 and 1,000 fibres/m3 24,35,36 (These figures are converted* into
TEM-measured** exposures corresponding to a risk level of 10-4 (for lifetime
expo-sure) – i.e. the reference level of risk used in this report and the Guidance Document). It is not surprising that the various risk analyses yielded quite similar results, since all used almost the same 100×KL value: 1 (EPA and WHO) or 2
(NRC). According to the WHO, the risk to non-smokers is ten times lower than the risk to smokers.
On the basis of its own analysis (in which the value of KL is 1) and those
per-formed by others, the WHO puts the exposure concentration at 10,000 to 100,000
* Such conversions are easy to make, since all the models concerned assume a linear relationship between exposure and risk.
Current standards 41 fibres/m3 for an exposure corresponding to a risk level of 10-4 (for
TEM-meas-ured lifetime exposure) and assuming that 30% of the population smokes.
3.3.2 WHO risk analysis for mesothelioma
The WHO25 guidelines on mesothelioma drew upon, among other sources, the
risk analyses performed by the National Research Council (NRC, 1984) and the Environmental Protection Agency (EPA, 1986).24,35 These risk analyses were in
turn based on a relatively small number of cohort studies, since the available studies did not encompass a sufficiently high number of deaths to support the calculation of reliable exposure-response relationships. Only in cohorts exposed to both chrysotile and amphiboles, or to amphiboles only, was mesothelioma-related mortality sufficiently high to permit the calculation of an exposure-response relationship.
Converted into TEM-measured concentrations that correspond to a risk level of 10-4 (for lifetime exposure), the findings of the four mesothelioma risk
analy-ses referred to in the WHO report vary between 500 and 2,000 fibres/m3. The
WHO quotes a guideline range of 1,000 to 10,000 fibres/m3 (converted into a
concentration) corresponding to a risk level of 10-4 (for TEM-measured lifetime
exposure).25
WHO conclusions on mesothelioma and lung cancer
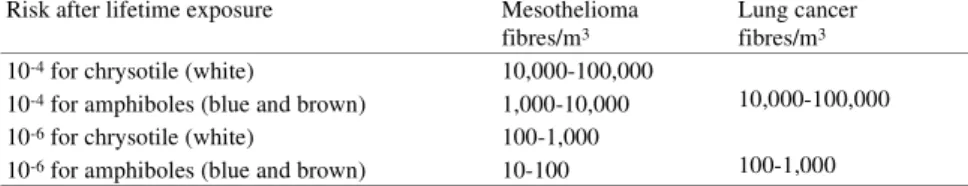
To summarize, the WHO25 gives the following values – converted to
concentra-tions corresponding to the risk level of 10-4 (for TEM-measured lifetime
expo-sure) – for lung cancer and mesothelioma:
Although the WHO states that amphiboles have greater mesothelioma-inducing potential, for precautionary reasons it is assumed that chrysotile carries the same risk as amphiboles. In calculating the risk of lung cancer, too, the WHO makes no distinction between different types of asbestos.
Table 5 WHO guidelines (1987)25 converted to concentrations corresponding to the risk level 10-4
(for TEM-measured lifetime exposure).
WHO guidelines,25 converted to concentrations corresponding to a risk level
of 10-4
Lung cancer 10,000 to 100,000 fibres/m3