A joint initiative of the Queensland Major Contractors Association and Construction Skills Queensland
2014
Major Projects Report
© February 2014 QMCA & CSQ
The copyright of this document belongs to the Queensland Major Contractors Association (QMCA) and Construction Skills Queensland (CSQ).
All rights reserved.
No part of this document may be reproduced or transmitted in any form or by any means, including photocopying, without the prior written permission of the QMCA. All requests to be directed to the QMCA.
Exclusion of Liability
This document is strictly provided on the basis that, to the extent permissible by law, neither the QMCA, CSQ or BIS Shrapnel nor any person involved in the production of this document: (1) warrants in any way the reliability or accuracy of any representation herein; (2) assumes any duty of care or other legal duty to any person who may use or rely on this document and persons using or relying on this document do so entirely at their own risk; (3) shall have any liability to any person with respect to any loss or damage howsoever arising, including in contract, tort or under statute, or otherwise from the use of or reliance upon this document.
Acknowledgement
This report has been prepared by Tony Hackett, James Schirmer, Jemina Dunn (QMCA); Brett Schimming, Kylie Long, Jo Mason-Smith (CSQ); and Adrian Hart, Alek Schoevers (BIS Schrapnel).
Note: Although great care has been taken to ensure accuracy and
completeness of this report, BIS Shrapnel Pty Ltd does not accept responsibility for the completeness and accuracy of the factual information on which its opinions and assumptions are based.
QMCA contact:
Queensland Major Contractors Association
GPO Box 3254 Brisbane QLD 4001 Australia T: +61 (0)7 3900 9005 F: +61 (0)7 3211 4900 E: [email protected] CSQ contact:
Construction Skills Queensland
PO Box 3294 South Brisbane QLD 4101 Australia T: 1800 798 488 F: +61 (0)7 3846 5067 E. [email protected]
BIS Shrapnel contact: Adrian Hart
Senior Manager – Infrastructure & Mining
BIS Shrapnel Pty Limited Level 8, 99 Walker Street North Sydney NSW 2060 Australia
T: +61 (0)2 8458 4200 F: +61 (0)2 9959 5795 E: [email protected]
Contents
Foreword
Executive Summary
1. Queensland Major Projects
2. International & Domestic Economy
3. Queensland Economy
4. Queensland Construction Outlook
5. Key Implications, Challenges and Risks
Appendix - 2014 Major Projects List
4
6
10
19
23
27
32
44
Foreword
This is the sixth edition of the Major Projects Report. With each passing year, it has become a more
powerful strategic policy document for the Queensland construction industry and its stakeholders, and an important bellwether for the broader Queensland economy. This year’s Report is no exception.
Within these pages you will find not only a detailed outlook for major project work across the state, but a thoughtful and authoritative discussion of the strategic implications of the outlook for contracting businesses, government policy, skilling and the broader Queensland economy.
The construction industry continues to be a powerful driver of the Queensland economy. Over the past decade, annual construction work in Queensland has grown from $21 billion to $53 billion in real terms, and the industry now directly employs nearly a quarter of a million people.
Within this, engineering construction activity has undergone an unprecedented expansion, booming fivefold from $7.5 billion in 2003 to over $38 billion in 2013.
This boom has been driven by global demand for Queensland’s high quality natural resources, particularly gas and coal, as well as the need to invest in new social and economic infrastructure as more and more
people have made Queensland their home. In turn, this investment is making Queensland’s economy more diverse and productive.
The sheer scale of the resources investment boom has provided a stern test for the construction industry, skilling agencies, governments and the broader economy. Soaring commodity prices and massive capital inflows which accompanied the boom pushed the Australian dollar to uncomfortably high levels, squeezing profitability and investment in other sectors of the Queensland economy.
Strong demand for construction skills, equipment and technical expertise,
particularly in remote and regional areas, has affected costs and competitiveness.
Responding to natural disasters across the state has provided additional unique challenges. In delivering growth in this environment, the engineering
construction industry has had to demonstrate flexibility, resilience and innovation in project and skills planning, and delivery.
Now Queensland faces a whole new set of challenges. While this year’s Major Projects Report confirms that a significant fall in activity is now underway, the upside is that activity should remain high in a historical sense, with the prospect of further substantial cycles in investment and construction in the near future.
We are proud to introduce the 2014 Major Projects Report – an important
partnership between the Queensland Major Contractors Association and
Construction Skills Queensland.
Consequently, it is important that plans are put into place to not only deal effectively with the current downturn, but to seize this once in a generation opportunity to deliver longer term, transformative outcomes for the Queensland construction industry which will put it on a more sustainable footing to meet the growing demands of public and private investment in the decades ahead.
As detailed in this Report, this includes, amongst other objectives:
• Preparing industry to meet strong growth in operations, maintenance and facilities management.
• Providing industry with greater certainty regarding the funding and delivery of infrastructure plans.
• Tackling uncompetitive practices and regulations.
This will require a coordinated and consultative approach between industry, government and labour. Queensland’s dynamic economy requires a healthy, competitive and highly skilled engineering construction sector. The Queensland Major Contractors Association and Construction Skills Queensland look forward to working with you as we meet the challenges and opportunities ahead.
Tony Hackett, President
Queensland Major Contractors Association
February 2014
Graham Capenter, Chairman
With the boom now fading, Queensland faces a new series of challenges and opportunities. This report highlights the outlook for major engineering construction activity in Queensland, the workforce resourcing requirements this necessitates for contractors and government agencies, and the implications for the industry as a result of these findings.
The report focuses on major engineering construction projects – funded and unfunded – defined as those exceeding $100 million. A complete list of major projects considered for this analysis, and the explicit assumptions for each project regarding work done and construction workforces employed each year, are provided in the Appendix.
Key Findings
The key findings from the 2014 Major Projects Report are:
• Global economic growth is expected to gradually
recover through 2014, but the Australian and Queensland economies are likely to experience weaker growth as the resources investment boom
transitions to the production and export phase. While this will see a rebalancing of Queensland’s diversified economy, the timing and magnitude of change remains uncertain.
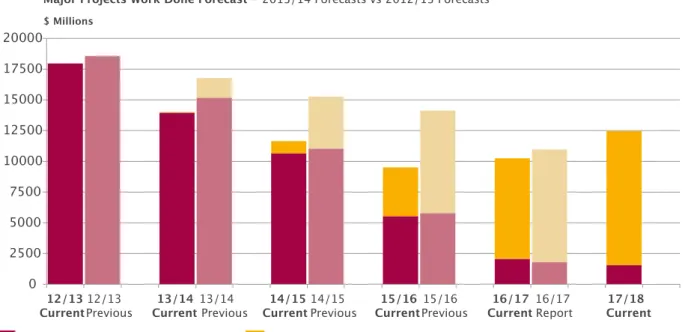
• A sharper decline – and an earlier and lower
trough – in major project work is now expected
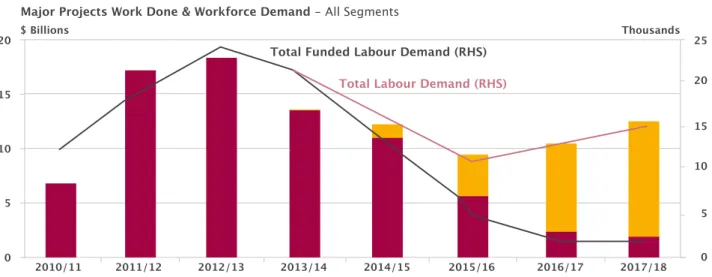
compared to the 2013 Report, as both public and private investment unwinds from unusually high levels – as shown in Figure A. Major project
work done is forecast to contract nearly 50%
over the three years to 2015/16, to a trough of $9.5 billion, in what is arguably the biggest challenge facing the contracting industry, and the broader Queensland economy.
• The outlook for major project work is now much
weaker than the previous Report. In the near
term, this is due to both weaker levels of funded and unfunded work (with now almost all unfunded work in 2013/14 not expected to proceed). Later on, a much sharper decline is expected as projects previously included (but unfunded) are no longer included in the major projects list. Mining and heavy industry construction projects are most affected as shown in Figure B, with a 45% decline in work done expected, displacing over 8,000 workers. But there are also significant declines in other engineering construction segments, both publicly and privately funded.
• An upswing in major project work is now
expected from 2016/17, rising further over 2017/18. To some extent, this represents the impact
of shifting some of the projects delayed in 2012/13 and 2013/14 to recommence later in the forecast period. It also represents changes in the outlook for some very large (and very risky) private and public projects.
This is the 6th Major Projects Report, with earlier reports published between 2006
and 2013. During this period, Queensland has experienced a substantial boom
cycle in construction activity and major project work. The boom was driven by a
simultaneous phase of public infrastructure and resources investment. Interrupted
by the global financial crisis over 2009 and 2010, a renewed wave of investment
then drove major project work to new heights. At every stage, the Queensland
major contracting industry has been faced with new challenges and opportunities,
affected by rapid increases in construction demand, regional skilling, logistical and
infrastructure demands, volatile shifts in global economic conditions, commodity
prices and exchange rates, and natural disasters, with threats to industry
productivity and competitiveness. In catering for growth, the industry has shown
innovation in project and skills planning, and project delivery, with varying degrees
of success.
• Substantial regional shifts in major project activity continue to take place. Once construction
is complete on the three major Liquefied Natural Gas (LNG) projects at Curtis Island and in the Surat Basin, the share of major project work is expected to shift towards South East Queensland and the Galilee Basin, as shown in Figure C.
• There is a significant difference between total
major project activity (and outlook) and the addressable market for domestic contractors.
Importing engineering design and fabrication skills, and the use of labour hire agreements by EPCMs, meant that domestic contractors only represented a small portion of booming LNG work. These strategies
Figure A 0 5 10 15 20 25 20 15 10 5 0 $ Billions Thousands 2010/11 2011/12 2012/13 2013/14 2014/15 2015/16 2016/17 2017/18 Total Funded (LHS) Year Ended June
Total Not Funded (LHS)
Total Labour Demand (RHS) Total Funded Labour Demand (RHS) Major Projects Work Done & Workforce Demand - All Segments
Figure B 0 5 10 15 15 10 5 0 $ Billions Thousands 2010/11 2011/12 2012/13 2013/14 2014/15 2015/16 2016/17 2017/18 Total Funded (LHS) Year Ended June
Total Not Funded (LHS)
Total Labour Demand (RHS) Total Funded Labour Demand (RHS) Major Mining and Heavey Industry - Projects Work Done & Workforce Demand Forecast
will not completely disappear over the next five years, but are likely to evolve and find use in other segments.
Implications and Challenges
The extent of the downturn in major project work depends crucially on how industry and government react from here; how the causes of the downturn are interpreted, how issues are identified and prioritised, and whether long term solutions are put into place. While negative external factors, such as weaker growth in global demand and a high exchange rate, are beyond the direct control of industry participants, there remains much that can be done to improve the prospects for major project activity, and secure the longer term health of the Queensland contracting industry, the construction market and the broader economy. This Report identifies three distinct causes of the coming downturn in major project work, each with their implications for industry strategy and government policy:
1. Completion of an unusually high phase of investment, with public and private investment likely
to revert to more “normal” levels from here. For a contracting industry used to double digit rates of growth, moving to this “new normal” is a significant shift, with the following implications for industry and government:
• Volatility in resources investment places a greater
onus on governments to develop – and stick to – sensible long term infrastructure plans which provide
industry certainty and avoid damaging phases of under and overinvestment.
• Public sector infrastructure strategies should
encompass not just engineering construction major projects, but also other major projects and programs that will drive more balanced economic growth and employment.
• A lower profile for engineering construction major
project work may not necessarily be accompanied by equivalently lower demand for labour, skills, materials or services across the construction industry. Competition for resources, both within the
construction industry in Queensland, as well as across different regions and other Australian states, may keep demand – and prices – for services relatively high in the medium to long term.
• For contractors, strategies should be put into place
to address appropriate operations and maintenance of the large asset base installed (including facilities management), rather than focusing exclusively on new investment.
2. Moderation in global demand growth (and prices) for resources, which may be temporarily or
permanently affecting the feasibility of the next round of projects. This implies:
• Further cycles in resources investment require careful planning to ensure the Queensland construction industry is competitive, retains appropriate skills to undertake new projects effectively and efficiently, and that key regions are supported by industry and government to encourage sustainable communities.
• Government and industry should develop alternative growth strategies for the state now, such as in
agriculture, niche manufacturing, services and tourism, and the appropriate skills and industrial mix to achieve this.
Executive Summary
Figure C 100% 90% 80% 70% 60% 50% 40% 30% 20% 10% 0% 2011/12 2010/11 2012/13 2013/14 2014/15 2015/16 2016/17 2017/18South East Queensland Gladstone Bowen Surat Northern Queensland Galilee Year Ended June
Major Projects Work Done - All Segments by Region (Share LHS, $billions by column in constant 2011/12)
2.1 1.5 1.2 0.2 0.7 0.6 0.3 0.6 1.1 1.0 2.2 1.1 3.6 1.2 2.2 3.0 2.1 2.4 1.8 1.9 3.4 3.4 2.0 1.5 1.7 1.9 1.8 9.2 10.3 2.2 2.2 1.5 1.0 7.7 6.8 0.8 1.3 2.2 1.8 1.3 2.1 1.8 0.3
3. Relatively high costs and lower competitiveness
which is affecting Queensland’s share of major project work. This includes the impact of the high Australian dollar, but also cost factors which may be more specific and addressable by government, labour and industry, including regulation, productivity, costs associated with the bidding and procurement process, and the treatment of risk. Positive changes aimed at reducing local costs may include:
• Ensuring against risks to productivity through skills and training reforms, better management and planning of the major project pipeline, and developing policies that encourage industry investment.
• Encouraging industry innovation in design and delivery through competition, procurement strategies and the use of performance or outcome based (rather than prescriptive based) regulations.
• Streamlining regulatory approvals and accelerate decision timeframes (which is already underway in Queensland).
• Lowering costs at the tendering stage. This may include simple measures such as committing to published decision timeframes, using fewer bid stages, lowering the quantum of design detail required and reimbursing bid costs (amongst other measures).
• Adjusting decision criteria to encourage
greater competition (and new entrants) at the tendering phase.
• Placing a greater importance on quality scoping, engineering design and a more appropriate allocation of risks before the construction phase of projects to avoid costly variations and overruns.
Risks to the Outlook
Since last year, the outlook for major project work has become even more uncertain, and remains
subject to risks and revisions as new information becomes available. Key risks identified in the Report include:
• The economic outlook for Queensland’s key
trading partners, such as China and India,
the strategic decisions they make in achieving sustainable growth, and how this will impact on the global trade of resources.
• Decisions made specifically regarding the
development of substantial Galilee Basin coal projects and related infrastructure. One Galilee
thermal coal project has been assumed here
(including related port and rail), but this could easily be one or more than one utilising either shared or multiple infrastructure.
• Upside and downside risks to the forecast
regarding public investment, which hinge on
decisions taken by State and Federal Governments.
• Upside and downside risks to Queensland LNG
investment, particularly in upstream gasfield
development which is more likely to be undertaken by local contractors (and may technically not be considered as major projects if they are less than $100 million individually).
• Potential constraints to industrial development
in Queensland due to energy shortages or supply disruptions have not been assumed, but could
have upside and downside implications for major project work.
1. Queensland Major Projects
The 2014 Major Projects List is presented in the Appendix of this report. The Major Projects List is for projects in excess of $100 million and was developed by BIS Shrapnel in coordination with QMCA member input though November and December 2013.
Total Major Projects Outlook and
Employment Demand
Figure 1.1 highlights the current activity and
projections for major project work and employment demand for the period 2012/13 to 2017/18 based on the 2014 Major Projects List, as well as historical data to 2010/11. Key points from this analysis are:
• Sharp slowdown in growth in major project
work in 2012/13, although workforce demand continued to rise in aggregate. Queensland
engineering construction for major projects reached a record $18 billion in 2012/13. However, growth slowed sharply compared to the previous year with work done edging only 2% higher compared to the 130% surge in 2011/12. That said, workforce demand continued to strengthen, with construction employment increasing 23% to a record 23,500 positions – however it is doubtful that this increase was completely absorbed by the local contractor industry, with many positions likely taken through off-shoring of work or the use of specific labour hire contracts.
Mining and heavy industry remained in the driver’s seat in 2012/13, commanding 75% of the growth in work done and 60% of the workforce growth.
• Severe contraction in major project work expected
over the next three years. In aggregate, major
project work done is forecast to decline nearly 50% to a trough of $9.5 billion in 2015/16. However, major project activity will still be higher than in 2010/11 if currently unfunded works proceed.
• Most engineering segments are expected to
contribute to declining activity, but mining and heavy industry construction will dominate the overall shape of activity going forward. The
completion of three major LNG projects on Curtis Island and in the Surat Basin, and the substantial retreat in coal and coal related works, will drive a 45% decline in major project work done. In terms of the construction workforce, mining and heavy industry alone is anticipated to shed over 8,000 full time workers.
• An upswing in major project work expected over
the latter years of the forecast period, with work
done forecast to rise back above $12 billion by 2017/18. However, this recovery is predicated on currently unfunded projects proceeding, including large public sector road and rail projects, as well as another round of resources investment focused on Galilee Basin coal. As such, the outlook is highly susceptible to risk.
Figure 1. 1. (Figure A in the Executive Summary)
0 5 10 15 20 25 20 15 10 5 0 $ Billions Thousands 2010/11 2011/12 2012/13 2013/14 2014/15 2015/16 2016/17 2017/18
Total Labour Demand (RHS) Total Funded Labour Demand (RHS) Major Projects Work Done & Workforce Demand - All Segments
• The cycles in major project work will also see shifts in employment demand through the next five years. From the peak in 2012/13, workforce
demand is expected to fall 50% to 11,400 persons by 2015/16, before recovering to 15,700 persons by 2017/18. As shown in Figure 1.2, there is also a sectoral shift in employment demand, with oil and gas demand falling as a share of total workforce demand after 2014/15.
Funded versus Unfunded Projects
This projection is based on a considered view of both funded and unfunded projects. Consequently, it is likely to provide a more realistic outlook of major projects activity in Queensland, and illustrate how the workforce requirement is likely to develop over the forecast period.
If the exercise were simply narrowed to consider just those projects which currently had funding approval, then major projects activity would experience a more rapid decrease in activity.
However, this is not the most likely scenario for activity given the reasonable probability that many (currently unfunded) projects will eventually be funded and committed to within the forecast horizon. Therefore, the unfunded forecast view is closer to a “worst case scenario” outlook, should international development deteriorate significantly further and the combination of threats to the Queensland construction industry remain unaddressed.
Towards an Addressable Market for Local
Contractors
Given the high import content of materials, equipment, buildings and structures attached to LNG projects and the use of direct labour employment contracts in assembling downstream LNG components on site, BIS Shrapnel has produced an alternative measure of major projects work, which better captures the (smaller) market for which local contractors can effectively compete. This analysis is based on discussions with major contractors regarding the approximate percentage of LNG major project value year by year (both upstream and downstream, which are quite different) that tends to be imported, offered through
Figure 1. 2. 100% 90% 80% 70% 60% 50% 40% 30% 20% 10% 0% 2011/12 2010/11 2012/13 2013/14 2014/15 2015/16 2016/17 2017/18
South East Queensland Gladstone Bowen Year Ended June
direct labour employment contracts or tendered as packages of work to local contractors. Figure 1.3 shows the expansion of the contractor market was likely not as steep as indicated by the total value of major project work alone (and official ABS engineering construction data, which includes the value of imported LNG components) during 2011/12. During this
period, the three major Gladstone-based LNG projects began to ramp up construction considerably, but this period coincided with a large increase in imports. The analysis shows, however, that the local contract market continued to grow strongly into 2012/13, corresponding well with the data on construction employment which also rose during the same year.
Furthermore, much of the downturn in local contractor work occurs in 2013/14, with another smaller decline in 2014/15 before stabilising in 2015/16. By contrast, a much greater proportion of major project work after 2015/16 is assumed to be won by local contractors, being more upstream related LNG work, other inland resources projects (such as Galilee Basin thermal coal mines and railways) and public infrastructure.
Roads and Bridges
Major project work for roads and bridges is expected to deteriorate further through the next 1-2 years, but may then pick up sharply from 2015/16. Constrained Federal and State Government funding and the absence
Figure 1. 4. 0 0.5 1.0 1.5 2.0 6 5 4 3 2 1 0 $ Billions Thousands 2010/11 2011/12 2012/13 2013/14 2014/15 2015/16 2016/17 2017/18
Total Funded (LHS) Total Not Funded (LHS)
Total Labour Demand (RHS) Total Funded Labour Demand (RHS)
Major Roads and Bridges - Projects Work Done & Workforce Demand Forecast Figure 1. 3. 0 5 10 15 20 $ Billions 2010/11 2011/12 2012/13 2013/14 2014/15 2015/16 2016/17 2017/18
Local Work Done Offshore LNG
Local Major Projects Work Done - (Excluding Offshore LNG) All Segments
of major toll road projects are the primary reasons for the initial weakness. However, with the next round of Nation Building Program projects (NBP2) starting from 2014/15 and the addition of the Toowoomba Second Range Crossing (as a potential PPP), Gateway Upgrade North (GUN) and possibly the Kingsford Smith Drive (all currently unfunded), Queensland roads and bridges construction work is expected to recover through to 2016/17 and remain elevated in 2017/18.
Flood-related reconstruction funding has been broken down into smaller packages of less than $100 million, and therefore does not impact the major projects outlook presented here. It does, however, influence the overall level of civil construction activity within the state, and the ability of the State and Federal Government to source labour and fund major projects into the future. As shown in Figure 1.4, major project road and bridge construction work done is expected to contract by nearly 60% by 2014/15 compared to the peak of 2010/11.
Major project workforce demand is expected to decline by a similar proportion over the same period.
The next round of NBP2 projects is expected to trigger the next upswing in 2015/16, but is unlikely to deliver the activity peaks of 2010/11. For contractors in this segment, a positive development has been the outsourcing of road maintenance arrangements in Brisbane, the Gold Coast and Sunshine Coast. As with flood-related works, this activity has not been considered in this report given that the ultimate packages of work will likely be well under the $100 million threshold, and the focus is on maintenance as opposed to construction work.
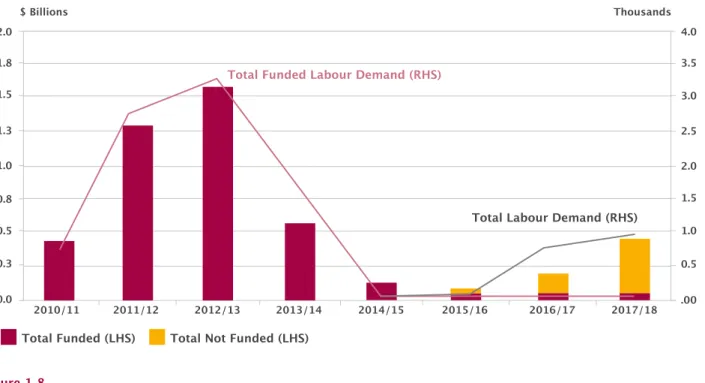
Railways and Harbours
Major project work across railways and harbours in Queensland has moved to a higher plane over the last few years, with work done peaking in 2013/14 at over $1.6 billion. Workforce demand requirements mirror the work done profile, with major railways and harbours construction employment having grown to 3,300 persons in 2012/13 and remaining at this level in 2013/14.
Railways and harbours work has been driven
predominantly by the demands of the resources sector. Consequently, the pause in new resource project commencements during the second half of calendar 2012 is driving a lower volume of major project work in this segment across 2014/15 and 2015/16. Activity remains relatively high in 2014/15, but this is mainly due to two very large ports projects: the $2.5 billion Hay Point Stage 3 expansion (timed to complete in 2014/15) and the $2.4 billion Wiggins Island Stage 1 (mostly complete by 2014/15). Without new projects to fill the gap, work done and employment is expected to drop sharply over 2015/16.
The key risk to the railways and harbours major project forecast concerns the future of the Galilee Basin – this is, essentially, the “Not Funded” category of work shown in Figure 1.5.
Should the development of the Galilee Basin take place (located further north and west of existing coal infrastructure in the Bowen Basin), this will necessitate a massive construction program involving over 400 kilometres of new rail and up to 120 million tonnes per annum of new coal port capacity.
For this report, it has been assumed that major construction will begin on one Galilee Basin coal mine
Figure 1. 5. 0.0 1.0 2.0 3.0 4.0 6 5 4 3 2 1 0 $ Billions Thousands 2010/11 2011/12 2012/13 2013/14 2014/15 2015/16 2016/17 2017/18
Total Funded (LHS) Total Not Funded (LHS)
Total Labour Demand (RHS) Total Funded Labour Demand (RHS)
by 2015/16, along with associated infrastructure. However, there remains significant risk that the cost of developing these projects relative to expected coal prices may see activity delayed beyond 2016/17.
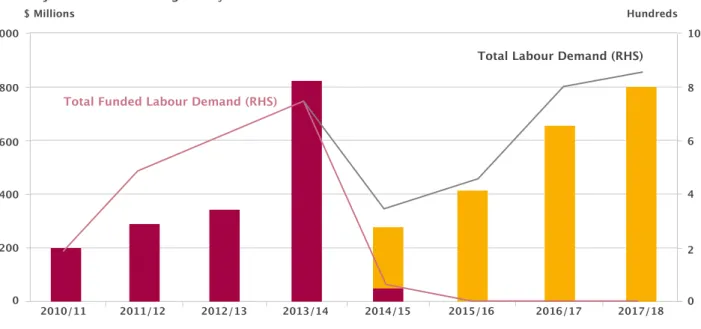
Water and Sewerage
Water and sewerage work done and workforce demand for major projects both climbed strongly in 2011/12 and 2012/13, largely on account of new water treatment plant facilities and pipeline work.
Major project sewerage activity experienced double digit growth rates over the last couple of years, albeit from a low base, to settle just shy of $400 million and employ around 600 persons.
Looking ahead, as shown in Figure 1.6, water and sewerage is expected to surge in the short term, peaking in 2013/14 at over $800 million. This is underpinned by new water treatment facilities and pipeline construction projects supporting upstream Coal Seam Gas (CSG) field development in the Surat Basin. However, as these projects finish, activity and workforce demand is anticipated to decline sharply, bottoming out at just over $250 million and 350 persons in 2014/15. By 2016/17, activity is expected to be rising strongly again due to stronger pipeline work and the beginning of the new projects that will provide flood mitigation benefits as well as additional water supplies for new coal and CSG fields. Taken together, work done is expected to reach a new cyclical peak of $800 million by 2017/18, employing over 800 persons.
There are significant risks with the water and sewerage major projects outlook. Many pipeline projects are unfunded because they are related to coal projects, so
there is plenty of flexibility for their starting dates. If conditions do not prove ideal for these projects, they could be further delayed or pushed out beyond the forecast horizon, considerably weakening the industry growth profile.
Electricity, Pipelines and Telecoms
Electricity, pipelines and telecoms major project work employed more than 3,000 persons in 2012/13, two thirds of which were involved in (non-water) pipelines work. In aggregate, electricity, pipelines and telecoms work done reached nearly $1.6 billion in 2012/13, a new record as shown in Figure 1.7. The growth in 2012/13 was delivered by a simultaneous increase in activity in the electricity and pipeline segments. In the electricity sector, a host of new Powerlink distribution and supply projects were a key driver. In the pipeline sector, the South West Queensland Pipeline and a series of CSG pipelines took activity to a whole new level. In the short term, major project electricity, pipelines and telecoms work done is expected to contract sharply, settling under $100 million in both 2014/15 and 2015/16. Over the medium to long term, the picture is much different sector by sector. With regards to electricity, weaker forecasts of electricity demand from the Australian Energy Market Operator (AEMO) suggest that new baseload generation capacity will not be required until the 2020s. For non-water pipelines, the vast bulk of major project work (comprising major gas transmission lines between Gladstone and CSG fields in the Surat Basin) is occurring now and will decline substantially in subsequent years.
1. Queensland Major Projects
Figure 1. 6. 0 200 400 600 800 1000 8 10 6 4 2 0 $ Millions Hundreds 2010/11 2011/12 2012/13 2013/14 2014/15 2015/16 2016/17 2017/18
Total Labour Demand (RHS) Total Funded Labour Demand (RHS)
Ongoing development of the CSG fields to feed the LNG trains once they are built will require continual upstream investment in pipelines (and other infrastructure) over the long term.
Finally, major project telecoms activity is assumed to remain consistent from here as the fibre to the node National Broadband Network (NBN) network is rolled out progressively across Queensland.
A major upside opportunity for additional pipeline work is if Surat Basin coal fields were to be developed within the forecast period. However, this is not assumed in the Report. Figure 1. 7. 0.0 0.3 0.5 0.8 1.0 1.3 1.5 1.8 2.0 3.5 3.0 4.0 2.5 2.0 1.5 1.0 0.5 .00 $ Billions Thousands 2010/11 2011/12 2012/13 2013/14 2014/15 2015/16 2016/17 2017/18
Total Funded (LHS) Total Not Funded (LHS)
Total Labour Demand (RHS) Total Funded Labour Demand (RHS)
Major Electricity, Pipeline and Telecom - Projects Work Done & Workforce Demand Forecast
Figure 1. 8. 0 5 10 15 15 5 10 0 $ Billions Thousands 2010/11 2011/12 2012/13 2013/14 2014/15 2015/16 2016/17 2017/18
Total Funded (LHS) Total Not Funded (LHS)
Total Labour Demand (RHS) Total Funded Labour Demand (RHS)
Mining and Heavy Industry
Mining and heavy industry major project work has experienced a period of unprecedented expansion between 2010/11 to 2012/13, increasing a collective 215% to reach a new peak of $13.6 billion, as shown in
Figure 1.8. From a major project workforce perspective,
the number employed in Queensland’s mining and heavy industry space doubled over the same period to
13,800 persons. Queensland’s LNG projects were the key driver of growth (although as mentioned, many of these positions may have been effectively off-shored) while existing coal projects, such as the Broadmeadow, Caval Ridge, Daunia and Grosvenor coking coal mines, also sustained a high level of work.
While major project work done is expected to have peaked in 2012/13, measured labour demand is
Figure 1. 9. 100% 90% 80% 70% 60% 50% 40% 30% 20% 10% 0% 2011/12 2010/11 2012/13 2013/14 2014/15 2015/16 2016/17 2017/18
South East Queensland Gladstone Bowen Surat Northern Queensland Galilee Year Ended June
Major Projects Workforce Demand - All Segments by Region (Share LHS, Employment by Column) 1,045 229 1,869 3,030 3,785 10,945 3,975 5,755 3,020 665 2,420 3,100 285 2,485 2,360 2,035 5,015 4,745 12,305 2,910 499 1,110 2,230 9,705 2,000 1250 1,050 754 2,363 2,180 3,457 3685 1,614 910 2,335 470 4,015 4100 930 2,324 2,105 1,650 3,900 Figure 1. 10. 100% 90% 80% 70% 60% 50% 40% 30% 20% 10% 0% 2011/12 2010/11 2012/13 2013/14 2014/15 2015/16 2016/17 2017/18
South East Queensland Gladstone Bowen Surat Northern Queensland Galilee Year Ended June
Major Projects Work Done - All Segments by Region (Share LHS, $Billions by column in constant 2011/12)
1.2 0.2 3.4 10.3 2.2 2.2 1.5 0.3 3.0 2.0 0.7 2.1 1.5 1.8 3.4 9.2 7.7 1.0 0.3 2.1 1.5 6.8 0.8 1.1 2.4 0.6 1.7 2.2 1.3 2.2 1.0 1.8 1.9 1.3 1.8 3.6 1.9 1.1 1.8 2.1 1.8 0.6 2.2
expected to remain steady in 2013/14 despite sharp falls in work done. However, this is mostly driven by peak phases of downstream activity on LNG projects which may not be contestable by local contractors. By contrast, labour demand for major coal projects is expected to slip by one quarter in 2013/14 (to 1,870 persons), while a 70% decline is expected for other minerals projects (to just 350 persons).
Further declines in work done and workforce demand are forecast in subsequent years, with funded activity dipping to 2010/11 levels by 2015/16, and moving substantially lower thereafter as current projects move to completion. However, assuming Queensland can meet challenges on costs and competitiveness, and is supported by strengthening global demand, a range of mining and heavy industry projects that are currently unfunded could come back late in the forecast period. Most of these are coal projects (in the Bowen and Galilee Basin), but there are also other developments such as Rio Tinto’s South of Embley bauxite project, the Paradise phosphate project, and ethanol projects in North Queensland.
Regarding LNG, it has been assumed in this report that a Shell LNG train will not proceed, but the upstream CSG fields will be developed to support one expansion of the existing projects by 2016/17. This is a significant departure from the previous 2013 Report. However, ongoing development of CSG fields over the operational life of LNG facilities (at least two decades) will require continual investment in related field infrastructure, including roads, pipelines, gas facilities, and water. Again, while not major projects in their own right, in aggregate, they will lift the volume of sector activity compared to pre-CSG times.
Queensland Regional Focus
Significant shifts in major project work and employment are expected at the regional level over the forecast period, as shown in Figures 1.9 and 1.10. While major project activity will be declining in aggregate terms, a greater share of this work is expected to be focused in the Gladstone and Surat Basin regions over the next twelve months. Later, activity is expected to switch back to South East Queensland, the Bowen Basin and the Galilee Basin. The LNG boom continues to be the key driver of this switch, which once completed, gives way to a potential upswing in coal-related work in the Bowen and Galilee Basins. Meanwhile, a broader based recovery in South East Queensland is dependent on investment decisions by State and Federal governments, particularly regarding new transport infrastructure.
The initial shift of labour and capital to Gladstone and the Surat Basin, in a very concentrated period of time, continues to present challenges to local communities and projects.
The construction workforce has more than doubled here in recent years to meet the construction schedule of the LNG projects. Other regions are set to remain around current workforce demand initially. Tight semi-skilled and skilled labour conditions will likely be the result. Currently, fly-in-fly-out (FIFO) construction workforces, new entrants and the use of overseas fabricators are helping to fill regional labour gaps. FIFO workforces, although a viable solution to intense, temporary skill requirements, have introduced challenges for regional communities. In many cases, these communities suffer from a classic free rider problem: FIFO workers enjoy regional community services (health care and other common access services) while not necessarily contributing fully in return if their spending and taxes leak back to their home region or interstate. Further, local businesses lose employees to major projects eroding communities. Although many of these projects and associated workforce pressures may be viewed as “one off” type events, they are in reality quite likely to be recurring as investment cycles in regional communities play out time and again.
Strengths, Weaknesses, Threats by Region
South East QueenslandPublicly funded infrastructure works are the key driver in South East Queensland, with roads and railways work likely to remain the principal source of major project activity. In this sense, the projection of declining levels of public investment and major project works in this region places local contractors at significant risk. A turnaround in public investment is expected to come through after the middle of the decade, supporting major project activity in South East Queensland. However, conditions will remain difficult until then, with only a handful of major road and rail projects, road maintenance contracts and potential flood reconstruction works in the near term.
Gladstone
The strengths, weaknesses and threats to the Gladstone region are shaped by the outlook for LNG and coal, the latter affecting the staged development of the Wiggins Island Coal Export Terminal (WICET). Major project demands are expected to have peaked in 2013/14 in this region, and are then expected to decline sharply as various LNG jetties projects and the $2.4 billion first stage of WICET move to completion. Whether the decline becomes more substantial later on depends on whether further stages to existing LNG projects, or new LNG projects commence during the forecast period or are delayed by high cost pressures and the emergence of competitive threats (such as from US shale gas). One brownfield LNG expansion has been assumed in this Report which, in conjunction with water, road and pipeline works, sees a recovery late in the forecast period.
Bowen Basin
Coal related major projects shape the Bowen Basin region. A substantial portion of these projects are either underway and heading to completion, or unfunded. Given weakness in thermal coal prices and falling coking coal prices, the next round of major projects remain under threat. In particular, a number of producers with allocations to the Wiggins Island Coal Terminal remain unable to access finance and further delays cannot be ruled out. In this Report, it is assumed that several of the delayed coal projects will be revived late in the forecast period under more favourable Australian dollar prices and local cost structures, but it is not guaranteed.
Galilee Basin
The Galilee Basin remains a key downside threat to our forecasts. As indicated in the Major Projects List, one major coal project has been assumed for the Galilee Basin. Mine construction is expected to commence later in the forecast period, alongside supporting rail and port infrastructure. However, these projects could easily be pushed back by a lack of funding or low coal prices.
Surat Basin
Upstream CSG LNG work is currently driving robust activity in the Surat Basin. Given the region’s significant thermal coal resources (which are expected to remain unrealised for now) there is substantial upside opportunities to the forecast. If economic conditions permit the Wandoan Coal Project to proceed for example, then this could start a chain reaction of development as other mines are developed to piggy back on related infrastructure such as the Southern Missing Link rail project. In addition, a number of CSG fired electricity generators are currently proposed in the region meaning further upside potential exists, although there is a low probability of this occurring in the next five years given the outlook for electricity demand.
North Queensland
The North West Queensland Mineral Province could stand to benefit from multiple major base minerals projects covering phosphates, silver-lead-zinc, copper, tin and nickel. Timing of the global economic recovery and demand for metals and minerals will be the key factor underwriting the next round of minerals investment in this region. While dominated by the sheer scale of the coal and LNG investments further south, base metals and minerals projects in this region may still be substantial over the next three to five years.
2. International & Domestic
Economy
– Setting the Stage
The health of the global economy is critically important to Queensland and the local contracting industry. Queensland’s abundance of natural resources
means the outlook for the global economy and, more importantly, industrial production has a strong bearing on future levels of investment activity and major project work. In particular, Queensland is a dominant player in the global seaborne coal trade and will shortly be a key player in the international LNG market. Investment in these industries not only provides major project work directly, but the boost to state economic activity and production also helps underwrite broader employment growth and investment in traditional economic infrastructure.
Rising metal and energy consumption in the East Asian region, particularly China, has been the main source of demand growth for the past three decades. China now accounts for around one-quarter to one-third of global consumption of most minerals and metals. Therefore, any disturbance to Chinese economic growth, and Chinese investment and infrastructure construction growth specifically, has important implications for world commodities demand, prices and investment.
Beyond China, stable growth in energy demand in mature Asian markets (including Japan, South Korea and Taiwan) coupled with stronger growth among emerging economies such as India and South-East Asia will continue to spur investment in the coal and gas sectors.
While a question mark remains around Queensland’s current competitiveness, characteristics such as geographical
location, quality of resources and supporting infrastructure, political stability and,
eventually, a lower Australian dollar should help maintain Queensland’s position in the global minerals and energy supply chain.
Outlook for the Global Economy
Following lower growth in calendar 2012 and calendar 2013, prospects for the global economy are starting to improve. Following growth around 3% over the past two years, global economic growth is expected to accelerate to 3.7% in calendar 2014 and 4.1% in 2015, as shown in
Figure 2.1.
Economic growth prospects differ substantially by region, however.
• Europe has taken the first steps to emerge from
recession, but is expected to continue to struggle for growth through the forecast period. Austerity
policies, high debts, structural and cultural change, and competitive disparities in the currency union are expected to constrain growth through the Euro region.
• The United States’ (US) economy is set to
accelerate over the next few years as the private Figure 2.1. Real GDP/Gross National Product (GNP) Forecasts
(1) Organisation for Economic Co-operation and Development: Australia, Austria, Belgium, Canada, Denmark, Finland, France, Germany, Greece, Iceland, Ireland, Italy, Japan, Luxembourg, Netherlands, New Zealand, Norway, Portugal, Spain, Sweden, Switzerland, Turkey, United Kingdom, United States.
(2) Euro area: Cyprus, Estonia, Ireland, Malta, Slovakia, Slovenia, France, Germany, Italy, Spain, Portugal, Austria, Belgium, Netherlands, Luxembourg, Finland, Greece.
(3) Other East Asia: Indonesia, South Korea, Malaysia, Philippines, Singapore, Taiwan, Thailand, Vietnam.
Source: OECD, IMF, National Government Sources, BIS Shrapnel t Year Ended December OECD US 2012 1.4 1.4 2.2 2.5 3.0 3.0 1.4 1.9 1.0 1.5 1.4 7.6 7.4 6.9 4.5 4.6 3.7 4.1 2.2 2.0 2.0 1.8 -0.6 -0.5 7.8 7.8 4.0 4.4 3.9 3.8 3.0 3.1 2013e e: estimate Forecasts 2014 2015
Japan Euro Area China India Other EastAsia WorldGDP
(1)
2. International & Domestic Economy
sector revives, employment continues to pick up, and US company profits and investment benefit from relatively inexpensive energy and low funding costs. High public sector debt, and the possibility of further political brinkmanship in dealing with this, represents a downside risk.
• China is expected to experience lower, yet still
robust, growth as the economy rebalances away
from exports and investment towards sustainable domestic consumption.
• Developing countries will assume a greater
leadership role in world growth. The economies
of South-East Asia are expected to benefit from stronger trade volumes as the Chinese economy stabilises at growth rates in the 7% range. After suffering setbacks in recent years, the Indian economy is expected to stabilise in 2014 before heading back toward long term growth rates above 6%.
The mild acceleration in world growth over the next few years is expected to support growth for most commodity prices (gold being the exception).
However, commodity prices (in US dollar terms) are generally expected to increase only gradually and fall considerably short of the price peaks achieved over the past five years, as shown in Figures 2.2 and 2.3. A falling Australian dollar through the forecast period, however, could see more significant increases in commodity prices in Australian dollar terms, assisting the development of resources projects later in the forecast period.
Coking coal prices fell by over 30% during 2012/13, following the resolution of supply disruptions which plagued the market in 2012 (particularly Queensland’s floods). Coking coal prices are likely to soften further during 2013/14 before strengthening in the middle of the decade. Whilst the growing Chinese steelmaking industry is expected to support demand for coking coal, a strong supply-side response is expected to see coal production growth keep pace with demand growth, keeping a lid on prices in the longer term.
Figure 2. 2.
$USD Commodity Prices – Metals and Gold
Quarterly Averge Prices (US$/t) (Log Scale)
As At June Source: BIS Shrapnel, ABARES data, BREE data Forecast 500 98 00 02 04 06 08 10 12 14 16 96 1000 2000 4000 8000 16000 32000 64000 Lead (x10) Nickel Copper Gold (x10) (US$/oz) Aliminium Zinc Figure 2. 3.
$USD Commodity Prices – Oil, Coal and Iron Ore
Quarterly Averge Prices (Log Scale)
As At June Source: BIS Shrapnel, BREE data Forecast 10 98 00 02 04 06 08 10 12 14 16 96 20 40 80 160 320 Coking Coal (US/t)
Crude Oil (WTI) (US$/bbl)
Iron Ore (US$/t)
Thermal Coal (US$/t)
Thermal coal prices have also fallen recently, with Japanese fiscal year (JFY) contracts cutting the price for second consecutive year. The JFY 2013 contract price settled at US$95 and represents a fall of US$30/ tonne over the last two years. Similarly, spot prices travelled lower to around US$80/tonne. At these prices, the exchange rate becomes a key factor, as a number of Australian thermal coal mines struggle to remain profitable. As miners cut back investment intentions, rising demand in South and East Asia should underpin a longer term, but gradual, recovery in spot prices.
Outlook for the Australian Economy
The Australian economy is in a transition phase. Over
the past five years, the economy was heavily reliant on mining and government investment for growth.
Weakness elsewhere across the economy (particularly in trade exposed industries badly affected by the GFC and the high Australian dollar) slowed the annual average rate of economic growth (GDP) during the 2007/08 to 2012/13 period to 2.5%, down from the 3.6 % annual average growth experienced in the decade to 2007/08.
During 2012/13, GDP growth slowed to 2.6%, from a resources-driven 3.7% through 2011/12. Growth in domestic demand (GNE) slowed from 5.2% in 2011/12 to just 1.6% in 2012/13, as shown in Figure 2.4. Key features of the outlook for the Australian economy from here:
• The Australian economy is expected to remain softer while growth drivers shift from resources to non-resources investment. GDP growth is expected to remain between 2 and 3% during both 2013/14 and 2014/15, but picking up to 3.5% by 2015/16 as non-resources investment recovers.
• Declining government expenditure and resources investment will be the key constraining factors in the short to medium term. Despite commodity prices remaining high in a historical sense, weaker demand growth and lower competitiveness is impacting on decisions to invest in new capacity. Meanwhile, all levels of government are in fiscal repair mode, constrained by the need to bring budget deficits under control. While public investment has been declining for the last two years, further cuts to infrastructure spending are likely.
• The positive legacy of the resources investment boom is that increased capacity will continue to underwrite strong increases in mining production
Figure 2. 4. Australia GNE and GDP: Moving Annual Total, Annual % Change
Extenal Contribution Real GNE
Per Cent
Quarterly Source: BIS Shrapnel, ABS data
Forecast -4 -2 0 2 4 6 8 88 90 92 94 96 98 00 02 04 06 08 10 12 14 16 Real GDP
2. International & Domestic Economy
and exports, making a strong positive contribution to growth right through the next five years.
• Interest rate cuts delivered by Reserve Bank have also allowed residential building to regain momentum. While focused in New South Wales at first, it should extend to other states with significant undersupply including Queensland and Western Australia, making a positive contribution to growth.
• A broader recovery in non-resources investment is still likely to be at least one to two years away. A bounce in consumer and business confidence following the 2013 Federal election was not sustained as more negative news on resources investment and domestic manufacturing (including the closure of Rio Tinto’s Gove refinery and Holden vehicle production) offset more positive global sentiment and a weakening Australian dollar. However private consumption and business investment, supported by low interest rates, a weakening Australian dollar, solid income growth and rising domestic demand, should eventually make positive contributions to growth. As the housing recovery becomes entrenched and confidence about the global and Australian economic outlook grows, households are expected to dip into their large savings buffer to fund a re-acceleration in consumer spending.
In summary, business conditions are expected to remain difficult over the next two years as non-mining investment takes time to come through.
Further depreciation in the value of the Australian dollar would help speed up the adjustment process and assist Australia’s trade-exposed industries. The Australian dollar is reasonably valued (from the point of view of competitiveness) between US70 and US75 cents. However, there remains considerable uncertainty as to extent and timing of depreciation, which will be linked to the winding back of major economy monetary stimulus, particularly the United States. The major beneficiaries of the lower dollar will be those trade-exposed sectors that were badly affected when the dollar rose, including agriculture, trade-exposed manufacturing, tourism, education, and finance and business services. Mining, too, would also stand to benefit significantly from a lower Australian dollar.
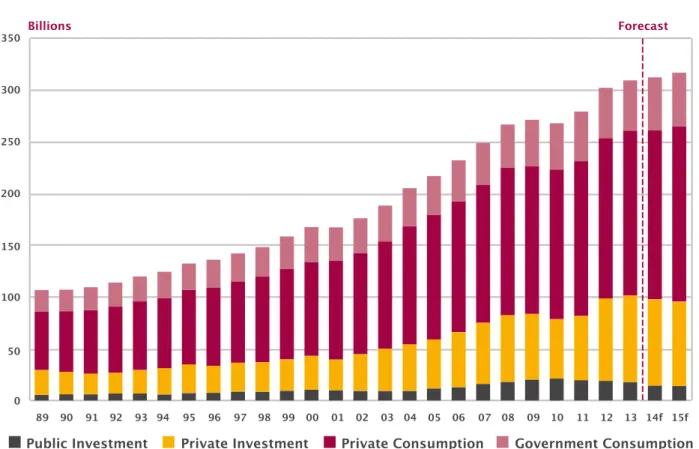
Apart from positive global fundamentals, a strong and diverse Queensland economy is also important to the local contracting industry. As one of Australia’s
fastest growing states, there has been substantial public and private investment in infrastructure over the past decade to support the expanding population, ranging from new schools and hospital buildings, to integrated transport and utilities networks. This investment is often realised as local construction activity, which in turn boosts local employment, incomes, spending and economic growth.
Although the Queensland economy is reasonably diversified, it is more heavily concentrated in agriculture, mining and tourism than the Australian economy. Over the past few years the tourism industry has been hit very hard by the high Australian dollar, while output from Queensland mining and agriculture has been severely impacted by floods and storms. The long run
impact of the global financial crisis, weaker global growth and demand – has impacted on Queensland manufacturers and exporters, while the resources investment boom has crowded out investment in other parts of the economy. As a consequence, recent growth in the Queensland economy has been sourced almost exclusively from resources investment, as shown in
Figure 3.1. In this sense it has been a microcosm of
Australia’s “two speed economy” but even more extreme (as illustrated in Figure 3.2).
Given the likely decline in resources investment from here, it will be important that new drivers of investment and economic growth emerge, not only for the health of the contracting industry, but to maintain employment growth and living standards in the state.
Figure 3. 1. Queensland Economy: Components of Domestic Demand
Forecast Billions 89 0 50 100 150 200 250 300 350 90 91 92 93 94 95 96 97 98 99 00 01 02 03 04 05 06 07 08 09 10 11 12 13 14f 15f
Public Investment Private Investment Private Consumption Government Consumption
Recent Trends
After experiencing a private investment “recession” in the wake of the global financial crisis, the Queensland economy grew more rapidly again through 2011/12. State Final Demand (SFD) – a measure of domestic demand, being goods and services sold in the state excluding imports and exports – surged by 8.6% in 2011/12, the fastest growth since 2003/04. Gross State Product (GSP) – a measure of state income and output, grew by 4.4% in real terms. The renewed growth was driven by a surge in resources-related investment, as well as a recovery in consumption growth, which offset weakening levels of public investment and a trough in housing activity.
This surge in growth was not sustained in 2012/13, as more mixed signals began to emerge regarding both private and public investment. Private investment growth slowed sharply from 27% to 6% as weaker commodity prices saw several major mining projects delayed, particularly for coal. Public investment fell again for a third successive year as the State Government completed a raft of projects spanning transport, water and energy without a commensurate increase in new projects. High State Government debt and lower GST revenues is still driving cuts in public spending, affecting funding for infrastructure projects and producing lower employment and wage growth in the public service.
Overall, growth in domestic demand (SFD) decelerated sharply to 2.4% with state economic growth (GSP) slowing to an estimated 3.6%. While mining investment continued to unwind, non-mining sectors such as housing and business services have yet to pick up the baton to drive growth.
2014 and Beyond
Over the next five years, divergent investment cycles are expected to play out across non-mining and mining-related sectors of the Queensland economy. As the Queensland economy transitions, growth is expected to be weaker, but more broadly based. Key features of the state economic outlook are:
• Growth will weaken further in 2013/14 and stay
weaker for several years. Growth in Queensland
domestic demand is forecast to slow to under 1% in 2013/14 and grow only modestly thereafter, supported by housing (initially) and non-mining investment (later), but against the headwind of lower mining investment. Economic growth in Queensland is also expected to dip in 2013/14, before recovering marginally in 2014/15. A positive and growing net exports position (as coal and LNG exports soar from recent investments) will keep economic growth stronger than growth in domestic demand. A lower Australian dollar can be expected
3. Queensland Economy
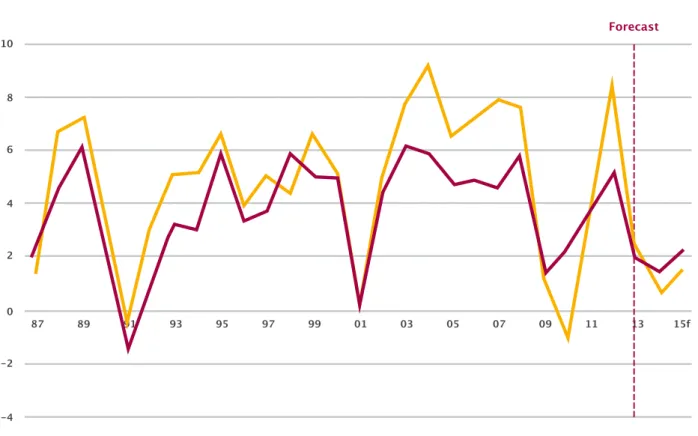
Figure 3.2. Queensland SFD and Australia GNE: Year Ended June, Annual % Change
Forecast -4 -2 0 87 89 91 93 95 97 99 01 03 05 07 09 11 13 15f 2 4 6 8 10
to boost Queensland’s key tourism and education, exports and agricultural industries eventually, as well as limiting the US dollar falls in resource-related commodity prices, in terms of Australian dollar revenues.
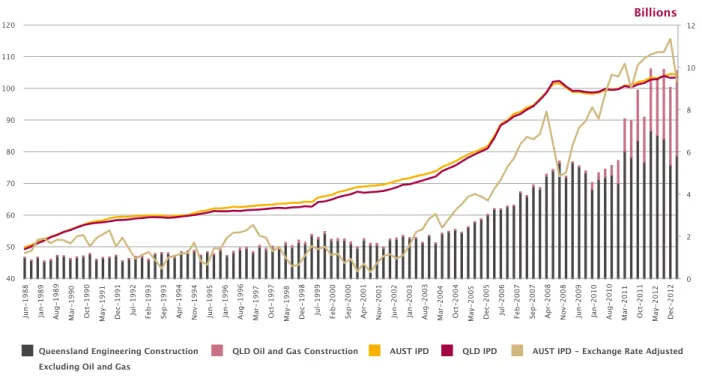
• Mining investment – the key driver of economic
growth in Queensland over the past decade – is expected to decline significantly, even if major new coal developments in the Galilee Basin proceed. During the mining investment boom, total
engineering construction for coal and minerals mines, smelters, and oil and gas facilities (including LNG) ballooned from $637 million in 2000/01 to $22.8 billion in 2012/13 (both in constant 2010/11 prices). Construction on associated infrastructure, such as railways, harbours and electricity, also increased substantially.
Having risen so spectacularly, the coming fall in mining investment will have a huge impact on the construction industry, private investment and the broader Queensland economy, even if much of the boom in LNG has been supported by offshoring and imports.
• Dwelling investment is expected to recover,
but will not fill the gap left by lower mining investment. Dwelling investment in Queensland
has declined nearly 30% since peaking in 2006/07, despite a fast growing population. BIS Shrapnel estimates that during 2012/13 alone, dwelling commencements in Queensland were around 10,000 dwellings (or 26%) below the estimated underlying demand. Ongoing population growth from here (as shown in Figure 3.3), an emerging dwelling shortage, low vacancy rates, rising rents and below-average interest rates should all help support a significant recovery in dwelling investment.
This, in turn, will provide economic benefits for other Queensland sectors, such as manufacturing, retail trade, and property services. But despite a pickup in housing, private investment is still expected to fall nearly 10% over the next few years.
• Meanwhile, further falls in public investment over
the next two years are likely to compound the downturn in private investment. Public projects
funded since the GFC have been completed without being replaced by new initiatives, with the State Government firmly focused on reducing the State’s debt burden. The nearing completion of a swathe of flood recovery and reconstruction initiatives following the 2011 and 2013 floods is also contributing to falling levels of public investment. In the short term, the State Government is likely to continue to rein in
Figure 3.3. Queensland Popultion Increase, Annual
Forecast Thousands 01 02 03 04 05 06 07 08 09 10 11 12 13 14 15 16 17 18 0 20 40 60 80 100 120
any non-essential expenditure, while at the same time pursuing asset sale programs, including some of its office building portfolio. In the medium to longer term (three-five years), public investment should begin to recover on the back of new infrastructure projects and reinvestment in plant and equipment. This will likely require funding supported by stronger State Government revenues and/or asset sales.
• A broader based investment recovery, both
public and private, is expected, but will take time to come through. A high Australian dollar and
weak profitability (outside of mining) since the GFC has stymied broader business investment in the Queensland economy. However, over the medium to longer term, some of these barriers to investment are expected to subside. Population growth will remain one of the fastest of all Australian states. Wholesale and retail trade will be assisted by a pickup in housing activity. A weaker Australian dollar will eventually spur investment in tradeables sectors (and, specifically, tourism facilities) – but the very low levels of investment outside of mining, transport and education over the past five years means that Queensland is not catering for even moderate growth in demand. Consequently, further smaller cycles in investment can be expected over the next three to five years.
In summary, it is the very diversity of the Queensland economy which will help soften the impact of the fall in minerals investment.
Essentially, the greater the fall in commodity prices and mining investment from here, the greater will be the fall in the Australian dollar and the greater the structural readjustment in the economy.
The Queensland economy has been attracting labour, providing jobs and growing more strongly than the national average for decades, well before the mining boom. Structural change will take the Queensland economy back towards balanced growth based on tourism, agriculture and education services; precisely those sectors that suffered during the period that the mining boom raised the dollar to levels at which those industries weren’t competitive, as well as parts of mining itself.
The key risk for Queensland is the timing and
magnitude of this readjustment. While the current round of LNG investment (both downstream and upstream) should prevent a sudden collapse in mining investment and, hence, resource-related employment, there is a risk that a faster unravelling of investment could occur, which could itself negatively affect business and consumer confidence and postpone the forecast upswing in dwelling construction.
With regards to the Australian dollar, the key risk is that it stays higher for longer, relative to commodity prices, which would further delay investment in mining and other trade exposed industries.