Health and well-being at
work: a survey of employees
Department for Work and Pensions
Research Report No 751
Health and well-being at work:
a survey of employees
Viv Young and Claire Bhaumik
A report of research carried out by GfK NOP Social Research on behalf of the
Department for Work and Pensions
or write to the Information Policy Team, The National Archives, Kew, London TW9 4DU, or email: [email protected].
This document/publication is also available on our website at: http://research.dwp.gov.uk/asd/asd5/rrs-index.asp
Any enquiries regarding this document/publication should be sent to us at:
Department for Work and Pensions, Commercial Support and Knowledge Management Team, Upper Ground Floor, Steel City House, West Street, Sheffield S1 2GQ
First published 2011.
ISBN 978 1 84712 985 7
Views expressed in this report are not necessarily those of the Department for Work and Pensions or any other Government Department.
iii
Contents
Contents
Acknowledgements ... vii
The Authors ... viii
Summary ...1
1 Introduction ...5
1.1 Background and survey objectives ...5
1.1.1
HSE ...5
1.1.2
HWWB ...5
1.2 Overview of the survey method ...6
1.3 The research series ...9
2 Health and well-being at work ... 10
2.1 Health and well-being initiatives and support ... 10
2.1.1
Take up of health and well-being initiatives or benefits ... 13
2.2 Flexible working ... 15
2.3 Attendance management ... 16
2.3.1
Return to work assistance ... 16
2.3.2
Job adjustments ... 17
2.4 Stress management ... 18
3 Relationships at work and work culture ... 20
3.1 Line managers or supervisors ... 20
3.2 Senior managers ... 22
3.3 Relationships with staff ... 24
3.4 Other colleagues ... 26
3.5 Organisational culture ... 27
4 Key employee findings ... 30
4.1 Sickness absence ... 30
4.2 Presentee-ism ... 32
4.3 Well-being ... 33
4.5 Retention ... 35
5 Other aspects of working life ... 36
5.1 Pay ... 36
5.1.1
‘I am paid fairly for the work that I do’ ... 36
5.1.2
‘I am satisfied with the pay and benefits I receive in this job’ ... 36
5.2 Sick pay ... 37
5.3 Concerns about job security ... 40
5.4 Retirement plans ... 40
5.5 Self-reported rating for health ... 41
5.6 Health symptoms, their causes and impacts on work ... 41
5.7 Stress outside of work ... 43
6 Conclusions ... 45
6.1 Health and well-being initiatives and support ... 45
6.2 Flexible working ... 45
6.3 Stress management ... 46
6.4 Attendance management ... 46
6.5 Sickness absence ... 46
6.6 Next steps ... 46
Appendix A Other questions relating to health ... 48
Appendix B Further details on method ... 53
Appendix C Sample profile ... 62
Appendix D Index calculation ... 65
Appendix E Approach to multivariate analysis ... 67
Appendix F Advance letter, contact sheet and survey questionnaire ... 74
List of tables
Table 1.1
Sample profile: selected characteristics ...8
Table 2.1
Provision of health and well-being initiatives or benefits ... 12
Table 2.2
Average number of health and well-being initiatives provided ... 13
v
Table 2.4
Summary of characteristics of respondents with higher/lower likelihood of
working for an organisation that offers flexible working options ... 16
Table 2.5
Measures used to help employees with five or more days of continuous
absence back to work ... 17
Table 3.1
Levels of agreement and disagreement with statements about line
manager/supervisor ... 21
Table 3.2
Levels of agreement and disagreement with statements about line
manager/supervisor ... 23
Table 3.3
Levels of agreement and disagreement with statements about relationships
with staff ... 25
Table 3.4
Levels of agreement and disagreement with statements about others
in organisation ... 26
Table 3.5
Levels of agreement and disagreement with statements about the
employing organisation ... 28
Table 3.6
Levels of agreement and disagreement with the statement ‘There
are few opportunities for me to learn and grow in this organisation’ ... 29
Table 3.7
Levels of agreement and disagreement with the statement ‘This
organisation fails to reward extra effort made by staff’ ... 29
Table 4.1
Summary findings relating to incidence of any sickness absence and mean
number of days’ absence ... 31
Table 4.2
Profile of employees in large public sector and large private sector
organisations by gender and age ... 32
Table 4.3
Levels of agreement and disagreement with statements about
engagement ... 34
Table 5.1
Sick pay in first seven days of absence, by establishment size, organisation
type and hours worked ... 38
Table 5.2
Sick pay in first seven days of absence, by industry sector ... 39
Table 5.3
Intended age for retirement by gender ... 40
Table 5.4
Health symptoms experienced ... 41
Table 5.5
Health symptoms and their relationship to work ... 43
Table A.1
Summary of scores for BMI ... 48
Table A.2
Summary of scores for body mass index, Health Survey for England, 2008 ... 49
Table B.1
Quality of Working Life (agreement) statements ... 55
Table B.2
Screening response rate ... 58
Table B.3
Main interview response rate ... 58
Table C.1
Sample profile: organisational characteristics ... 62
Table C.2
Sample profile: personal demographics ... 63
Contents
List of figures
Figure 2.1
Provision of health and well-being initiatives or benefits (% of respondents
citing each) ... 11
Figure 2.2
Adjustments ever made or offered by employer to help employees with
sick leave do their jobs (% respondents) ... 18
Figure 3.1
Level of agreement (%) with statements about senior managers, by size
of organisation ... 24
Figure 5.1
Sick pay in first seven days of absence ... 37
Figure A.1 Frequency of employee physical activity (%) ... 50
Figure A.2 Smoking prevalence by annual income (%, after Tax and NI) ... 51
Figure E.1
Dummy example of a CHAID tree output displaying multiple ‘splits’ ... 70
vii
Acknowledgements
This research was commissioned by the Health and Safety Executive (HSE) and the
cross-government Health, Work and Well-being Strategy Unit, which comprises representatives from the Department for Work and Pensions, the Department for Health, HSE, the Scottish Government and the Welsh Assembly.
We would like to thank Isobel Swarc at the Department for Work and Pensions and David Riley and Alison Higgins at HSE for their advice and guidance throughout this project.
We extend our special thanks to all the employees who gave their time to take part in this project.
Acknowledgements
The Authors
Viv Young is a Research Director at GfK NOP Social Research, with 15 years’ experience of working with public sector clients. Viv specialises in research with businesses, particularly in the areas of well-being and learning and skills.
Claire Bhaumik is a Research Manager at GfK NOP Social Research. Claire has over six years’ experience, working with a wide range of public sector organisations, including research amongst employees and employers about the employee experience of health and well-being at work.
1
Summary
Background and survey objectives
The Health and Well-being Employee Survey was jointly funded by the Health and Safety Executive (HSE) and the Cross-Government Health, Work and Well-being Strategy Unit (HWWB). The HWWB is sponsored by five government partners: the Department for Work and Pensions (DWP), the Department of Health (DH), HSE, the Scottish Government and the Welsh Government. This report focuses specifically on HWWB’s objectives for the research.
In March 2008, Dame Carol Black’s review of the health of Britain’s working age population was published1. This review recognised the beneficial impact that work can have on an individual’s state of health and that work is generally good for both physical and mental health. The response to Dame Carol Black’s review2 was published in November 2008 and identified seven key indicators to develop baselines for and measure progress against. The second of the indicators was ‘improving the promotion of health and well-being at work’, which has several sub-indicators:
• Health and well-being initiatives and support. • Flexible working policies.
• Stress management standards.
• Attendance management (in terms of helping employees back to work or making adjustments to jobs to keep them in work).
• Employee engagement.
The survey meets HWWB’s objectives for the research, by:
• Developing the evidence base around work and health and workplace health initiatives from the employee perspective.
• Providing baseline data so that progress on health and well-being at work can be measured and monitored over time.
Research method
The survey used a random probability sample design. Interviews averaging 35 minutes in length were administered in employees’ homes by GfK NOP’s field force between October and December 2009. In total 2,019 interviews were achieved with paid employees, working in all sectors of the economy.
The survey data are representative of paid employees in GB aged 16+, meaning that we can draw conclusions from the data about the population of employees in Great Britain3.
1 http://www.dwp.gov.uk/docs/hwwb-working-for-a-healthier-tomorrow.pdf
2 http://www.dwp.gov.uk/docs/hwwb-improving-health-and-work-changing-lives.pdf 3 The findings discussed in the report are based on significance testing at a 95 per cent
confidence interval.
Setting the scene
To set the findings in context, this section summarises some key information about the survey respondents.
General health and well-being
Ninety per cent of respondents said their general health was either very good or fairly good, younger respondents were more likely than older respondents to describe their health in this way (see
Section 5.5).
Thirty per cent of respondents said their life outside work was not at all stressful, whilst just over four in ten (44 per cent) described it as mildly stressful (see Section 5.7).
Respondents’ overall well-being was assessed using the Warwick-Edinburgh Mental Well-being Scale (WEMWBS)4. Across the sample, the average well-being score was 26 out of 35 (see Section 4.2). Broadly speaking, as many people sat above the average score as sat below it, so there was not a situation in which a few people had exceptionally high or low well-being scores.
Pay and future plans
Respondents held positive views about pay and benefits; 59 per cent agreed that they were satisfied with the pay and benefits they received in their job, and those in the top income brackets tended towards higher levels of agreement. Public sector respondents and those working in medium or large establishments tended to be most satisfied with their pay and benefits (see Section 5.1). Retention was assessed in terms of whether or not employees had thought about leaving their employer in the past year: 40 per cent of respondents had thought of doing so (see Section 4.5). Thirteen per cent of respondents thought that losing their current job in the next 12 months was very or fairly likely; those working in Manufacturing/Utilities and Transport/Communications were among those most likely to feel this was the case (see Section 5.3).
Most people intended to retire from paid work between the ages of 60 and 65 (see Section 5.4).
Sickness and sick pay
5Forty-four per cent of respondents said that they had gone to work in the past 12 months when, in their opinion, they should have taken sick leave, which could be considered evidence of ‘presentee-ism’. On average, respondents had gone to work on two days in the past 12 months when, in their opinion, they were really too sick to do so (see Section 4.2).
Forty-eight per cent of respondents had taken some sick leave in the last 12 months; the average number of days’ sick leave was 4.9 days (see Section 4.1).
For 65 per cent of all respondents, sick pay was paid at their normal rate of pay during their first seven days of absence, but ten per cent did not know their organisation’s policy on sick pay
(see Section 5.2).
4 WEMWBS measures subjective well-being and psychological functioning, see http://wrap.warwick.ac.uk/543/1/WRAP_Stewart_Brown_Warwick_Edinburgh.pdf
5 Figures for sickness absence and ‘presentee-ism’ are based on respondents who worked for their organisation for one year or more unless otherwise stated.
3
Health and well-being at work
Health and well-being initiatives
From a list of twenty support measures incorporating the whole spectrum of initiatives designed to promote worker safety, healthy lifestyles and well-being6, those most commonly cited as being provided by organisations in the last 12 months were more than 20 days’ holiday (excluding bank holidays) and an employer pension scheme, cited by 84 per cent and 70 per cent of respondents respectively (see Section 2.1).
Considering only those respondents who were eligible to take up an initiative or benefit, those most commonly used in the last 12 months were7: subsidised canteens or restaurants, healthy food choices in vending machines/canteens and employer pension schemes (Section 2.1.2). It is important to remember that not all initiatives and benefits would have been applicable or useful to all employees (e.g. programmes to help people give up smoking, weight management programmes, etc), and, correspondingly, these had lower take up levels.
Flexible working options
Fifty-seven per cent of respondents said their organisation offered at least one flexible working practice8, and this was more likely to be the case for respondents working in very large, public sector organisations (see Section 2.2).
Attendance management
Attendance management was examined in terms of assisting people back to work after illness or injury, or making adjustments to jobs to help people stay in work. Among respondents who reported more than five days’ continuous sickness absence, around half (48 per cent) had received assistance to return to work, and the most commonly identified measures were reduced working hours or days (20 per cent), access to occupational health measures (19 per cent) and reduced workloads (19 per cent) (see Section 2.3.1).
Respondents who had experienced more than five days’ continuous sick leave were asked whether their organisation had ever made, or offered to make, any adjustments to their job at any point, not just on their return from sick leave. Forty-four per cent of respondents in this group had received or been offered adjustments to their job, and the most common measures were different or reduced working hours (18 per cent) and different duties at work (15 per cent) (see Section 2.3.2).
Stress management
Thirty-two per cent of respondents said that stress management support or advice was provided to employees and/or managers within their organisation. In terms of direct experience, around a third of respondents with a line manager or supervisor (34 per cent) agreed that this person had talked to them about avoiding stress at work, and just under half of line managers themselves (45 per cent) reported that they had received information, help or advice on managing stress among their employees.
6 For a full list of the initiatives and support measures see Section 2.1.
7 Respondents who mentioned that their organisation offered ‘more than 20 days’ holiday, excluding bank holidays’ were not then asked questions about levels of take up.
8 For more information about the index please see: http://www.civilservice.gov.uk/about/ improving/engagement/index.aspx. The statements are detailed in Section 4.4.
Employee engagement
At least fifty-nine per cent of respondents strongly agreed or tended to agree with the five statements making up the employee engagement question battery9. Agreement was highest, at 69 per cent, for the statement: My organisation inspires me to do the best in my job. Responses to the five statements were summed and an average score calculated for the whole sample; when scaled up, the overall level of employee engagement was 67 out of 100.
Relationships at work and work culture
Most respondents were positive about their relationships with colleagues, with some of the most positive views related to the help and support received from other colleagues in their organisation. High levels of positive feeling were recorded for relationships with line managers (70 per cent or more returned positive ratings on all but one measure10). There was, however, some criticism of senior managers, particularly in terms of delivering on promises (47 per cent said they failed to do so; see Section 3.2).
In terms of organisational culture, respondents were most negative about statements relating to how employees were rewarded and developed, with 39 per cent saying that their organisation failed to reward extra effort made by staff (see Section 3.5).
Conclusions
This survey has provided baseline evidence of activity, across organisations of all sizes and in all sectors, for the indicator ‘Improving the promotion of health and well-being at work’ and several of its sub-indicators. There are some clear patterns in the data that show that provision is more prevalent in large organisations, especially those in the public sector and those with trade union presence.
As well as providing data to support the government’s commitment to monitoring employee health and well-being at work, the survey has provided evidence that may be of interest to policy makers responsible for the promotion of good work and employee engagement, as illustrated by the recommendations of the Marmot Review11 and Macleod Review12 respectively.
9 For more information about the index please see: http://www.civilservice.gov.uk/about/ improving/engagement/index.aspx. The statements are detailed in Section 4.4.
10 On the negatively phrased statement ‘your line manager expects you to work too hard’, 55 per cent disagreed that this was the case.
11 http://www.marmotreview.org/AssetLibrary/pdfs/Reports/FairSocietyHealthyLives.pdf 12 http://www.bis.gov.uk/files/file52215.pdf
5
1 Introduction
1.1
Background and survey objectives
The Health and Well-being Survey of Employees was jointly funded by the Health and Safety Executive (HSE) and the Cross-Government Health, Work and Well-being Strategy Unit (HWWB). HWWB is sponsored by five government partners: the Department for Work and Pensions (DWP), the Department of Health, HSE, the Scottish Government and the Welsh Government. The development of the survey was initiated by HSE with HWWB’s involvement commencing at the questionnaire design phase.
As funders of the survey, the objectives of HSE and HWWB were complementary but each had a slightly different perspective. Whilst this report focuses solely on the findings that relate to HWWB’s objectives, the following sections summarise the context in which the survey was commissioned from the perspective of each respective body.
1.1.1
HSE
The role of HSE is to ensure that risks to people’s health and safety from work activities are properly controlled. However, in an increasingly service-focused business landscape, HSE recognised that safeguarding and promoting the health and safety of employees required the examination of ‘softer’ aspects of the workplace experience. In 2008, GfK NOP was commissioned to develop a ‘quality of working life’ survey of employees to explore the relationships between a wide range of aspects of working life, objective measures of employee support (e.g. working practices) and other areas of interest including the incidence of sickness absence, employee retention, employee engagement, presentee-ism13 and the mental and physical health of employees.
In summary, HSE’s specific objectives for the survey were to:
• measure objective factors about employees’ working lives, e.g. whether they were offered flexible working, other benefits, etc;
• measure subjective factors, e.g. attitudes towards working with line managers and colleagues, views on the culture of the employing organisation;
• explore the links between the objective and subjective measures and specific items of interest, such as mental and physical health, the incidence of sickness absence, presentee-ism, employee engagement and retention.
1.1.2
HWWB
In March 2008, Dame Carol Black’s review of the health of Britain’s working age population was published14. The review recognised the beneficial impact that work can have on an individual’s health and that work is generally good for both physical and mental health. It also identified the importance of healthy workplaces designed to protect and promote good health, and the central role that such workplaces play in preventing illness arising in the first place.
13 The definition of presentee-ism used in this report is when someone who is ill goes to work when, in their opinion, they should have taken sickness absence.
14 http://www.dwp.gov.uk/docs/hwwb-working-for-a-healthier-tomorrow.pdf. Op cit
Introduction
The response to Dame Carol Black’s review15 was published in November 2008 and identified seven key indicators to develop baselines for and measure progress against. The second of the indicators was ‘improving the promotion of better health and well-being at work’, which has several sub-indicators:
• Health and well-being initiatives and support. • Flexible working policies.
• Stress management.
• Attendance management programmes. • Employee engagement.
• Satisfaction with work16.
This survey develops the evidence base and explores the links between health and work, as well as providing baseline data so that progress on health and well-being at work can be measured and monitored over time.
1.2
Overview of the survey method
The survey used a clustered, two-stage probability sample design, with Lower Super Output Areas as the primary sampling unit. Sampled addresses were screened for eligibility, and where there was more than one adult eligible for interview, one person was selected at random from each screened household. The eligibility criteria were:
• Aged 16+ but no upper age limit.
• In paid employment for seven or more hours across a week. • Employed rather than self-employed17.
• Working for an organisation where two or more people were in employment. • Employed by an organisation rather than directly by a private household. • Had been in work during the preceding month.
Interviewing took place in people’s homes and was undertaken by GfK NOP’s field force between October and December 2009. It is worth mentioning that the survey followed a period of
economic recession, which saw a large number of private sector redundancies, but it preceded announcements of funding cuts within the public sector. All of the fieldworkers working on the study
15 http://www.dwp.gov.uk/docs/hwwb-improving-health-and-work-changing-lives.pdf. Op cit 16 In terms of a satisfaction with work measure, the Employee Survey did not include a single
job satisfaction metric, but there is an intention to review the attitude statements relating to different aspects of work to assess whether a measure for satisfaction may be constructed; this will be informed by the latest literature relating to job satisfaction.
17 Self-employed was defined as where the individual was responsible for tax and National Insurance contributions.
7
were fully trained and Interviewer Quality Control Scheme (IQCS)18 qualified and all attended a formal briefing given in person by members of the GfK NOP executive team.
The final questionnaire averaged 35 minutes in length and comprised five sections as follows: 1 Organisation and job characteristics. Information about the nature of the respondent’s
(main) job, hours worked and details on their employing organisation (e.g. Standard Industrial Classification (SIC)19, size, multiple sites, managerial structure, etc).
2 Attitude statements. Fifty-seven attitude statements (with a five point agreement scale) divided into nine subsections: the work itself, the workplace, work/life balance, organisational culture/ values, relationships with line manager, relationships with senior managers, peer relationships, relationships with those managed and external relationships.
3 Key employee measures. A variety of employee measures were explored including retention, sickness absence, presentee-ism and engagement as well as mental well-being (using the Warwick-Edinburgh Mental Well-being Scale20), a self reported measure of health, health
symptoms and health behaviour measures. Answers to more sensitive questions (such as height, weight, alcohol consumption and the well-being attitude statements) were collected using a self-completion module, whereby the interviewer ‘taught’ the respondent to use the laptop to enter their answers and then left him/her to complete the section in their own time21.
4 Objective measures of support, covering: pay and benefits and the provision and take up of benefits or initiatives with a possible connection to well-being (for example, flexible working, employee assistance programmes, canteen facilities, fitness programmes).
5 Personal demographics, e.g. age, gender, ethnic background, income level and caring responsibilities.
The final survey questionnaire is included in the appendices.
In total 2,019 interviews were achieved with paid employees. The survey data were weighted to correct for probability of selection (in some households more than one adult would have been eligible for interview), and secondly, to ensure the data were representative of paid employees in GB aged 16+. For the latter, the data were profiled against filtered information from the latest Labour Force Survey22 and weighted to ensure that they were representative by gender, age, hours worked, industry sector and region. Further details about the data collection and preparation methods and the final profile of the sample are provided in the appendices to this report.
18 IQCS is an independent organisation, working with providers and buyers of social and market research fieldwork to develop and maintain high standards of data collection in the social and market research Industry. Clients can be reassured that member companies’ processes facilitate the collection of high quality robust data.
19 The United Kingdom SIC of Economic Activities is used to classify business establishments and other standard units by the type of economic activity in which they are engaged.
20 http://wrap.warwick.ac.uk/543/1/WRAP_Stewart_Brown_Warwick_Edinburgh.pdf
21 Data collected on height, weight, alcohol consumption, diet, smoking and exercise have not been used in this report but will form part of HSE’s analysis of the data.
22 Labour Force Survey, see http://www.ons.gov.uk/about-statistics/user-guidance/lm-guide/ sources/household/lfs/about/index.html
Table 1.1 provides information about the profile of the final sample by key personal demographics and organisational characteristics; further details are supplied in the appendices to this report.
Table 1.1 Sample profile: selected characteristics
Group Weighted % (^)
Type of organisation
A private sector business 65
A public sector business 31
A voluntary/not for profit organisation 3
Organisation size Small (1-50) 23 Medium (51-249) 11 Large (250-499) 5 Very large (500+) 57 Sector Manufacturing/utilities 12 Construction 6 Retail/wholesale/hotels 20 Transport/communications 6 Finance/business 17 Public administration 8 Education 11 Health/social work 14
Other service industry 5
Other 1 Gender Male 51 Female 49 Age 16-24 15 25-34 22 35-44 25 45-54 23 55+ 15
Hours worked per week
Less than 35 (part-time) 29
35 or more (full-time) 70
Base: All employees (unweighted 2,019; weighted 2,019).
Note: Some percentages do not add up to 100. This is due to some respondents being unable or unwilling to classify themselves and/ or due to rounding. ^ The data were weighted to correct for probability of selection and to be representative of paid employees in GB aged 16+.
9
1.3
The research series
The Employee Survey forms part of a wider programme of research encompassing: • an HWWB-sponsored survey of employers;
• and an HSE-sponsored survey of line managers; the findings from that study will be examined alongside further analysis of the Employee Survey data.
This report is the first output from the Employee Survey and focuses solely on the HWWB’s
objectives for the research, presenting baseline findings for the key sub-indicators already detailed. The remainder of this report is divided into five chapters. The next chapter provides a discussion of the evidence relating to health and well-being at work. Chapter 4 covers findings concerning relationships at work and the culture of the workplace. Key employee findings are examined in Chapter 5, namely well-being, engagement, sickness absence and retention. Chapter 6 covers other aspects of working life of interest to HWWB. The final chapter provides concluding thoughts about the findings and next steps.
Unless otherwise stated, the report focuses only on findings that were found to be statistically significant (based on a confidence interval of 95 per cent) after the effects of weighting and data clustering had been taken into account.
2 Health and well-being at work
Summary
This chapter looks at health and well-being at work and covers health and well-being initiatives/ support, flexible working, stress management and attendance management.
Some of the key findings are:
• The most commonly cited health and well-being initiatives were more than 20 days’ holiday (excluding bank holidays) and an employer pension scheme. Access to counselling/an employee assistance programme was provided for 40 per cent of respondents and access to occupational health services to 38 per cent of respondents.
• Fifty-seven per cent of respondents said their organisation made use of flexible working practices, such as flexi-time, working from home, job sharing, working condensed hours or changing working patterns. Respondents working for very large public sector organisations were more likely to say that such practices were used in their organisation.
• Among respondents who had had five or more days of continuous absence in the previous 12 months, 48 per cent had received some type of assistance to help them back to work. The most common types were reduced working hours or days, access to occupational health services and reduced workloads. Such measures were more likely to be cited by public sector workers.
• Thirty two per cent of respondents said that stress management support or advice was provided to employees and managers in their organisation, and 34 per cent of those with a line manager/supervisor reported that this person had talked to them about avoiding stress at work.
• Among line managers, 45 per cent had received information, help or advice about managing stress among their employees, and this was more prevalent among those working in the public sector and in large organisations.
2.1
Health and well-being initiatives and support
This section assesses to what extent employees reported the presence of initiatives used to promote or encourage healthy lifestyles and improved well-being in their organisation, as well as looking at levels of take up.
A list of 20 initiatives and support measures were explored, which incorporated a wide spectrum of initiatives designed to promote worker safety, healthy lifestyles and well-being. The initiatives fell into four broad categories:
• ‘Traditional’ benefits: e.g., more than 20 days’ holiday excluding bank holidays, company pension, private medical insurance, subsidised canteen or restaurant.
• Traditional health and safety initiatives: e.g., work area assessments and adjustments, training in injury prevention.
• Dedicated employee support services: e.g. a well-being intranet site, occupational health services, access to counselling and other employee assistance programmes, stress management support and advice, health screening and health checks.
• Proactive lifestyle initiatives: e.g. healthy food choices in vending machines, fitness classes, loans for bicycle purchase, schemes to help people undertake voluntary work in work time.
11
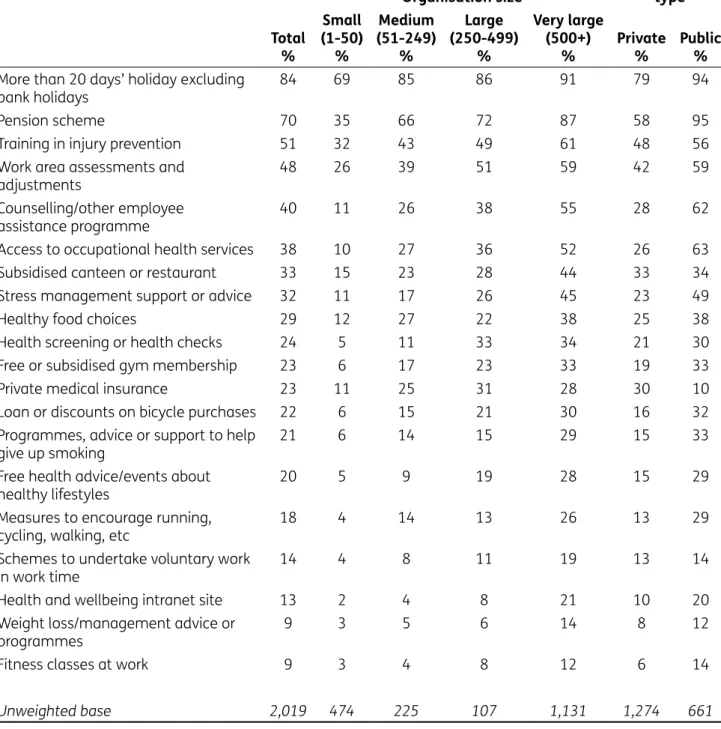
Respondents were asked to identify which of the initiatives their organisation had provided in the last 12 months, regardless of whether the initiatives were provided to all staff or just some, or whether the respondent had used them or not. Figure 2.1 shows the initiatives and benefits in descending order of provision.
Figure 2.1 Provision of health and well-being initiatives or benefits (% of
respondents citing each)
The main areas of provision were so called ‘traditional’ benefits; 84 per cent of respondents cited more than 20 days of holiday excluding bank holidays being provided by their employer, and 70 per cent mentioned an employer pension scheme. Traditional health and safety initiatives were also commonly provided: around half of employees mentioned training in injury prevention (51 per cent) and work area assessments and adjustments (48 per cent).
Dedicated employee support service benefits were cited by smaller proportions of employees: 40 per cent mentioned access to counselling or other employee assistance programmes and 38 per cent cited occupational health services. Health screening and health checks, however, were mentioned by just under a quarter of respondents (24 per cent).
Initiatives that related to employees’ lifestyles were mentioned by less than a quarter of respondents: 23 per cent mentioned a free or subsidised gym membership and 22 per cent
mentioned a loan or discount towards a bicycle purchase. It should be noted, however, that whilst these were relatively low proportions, they represented many tens of thousands of employees in Great Britain.
Health and well-being at work
Weight loss/management advice or programmes Fitness classes at work Dedicated health and wellbeing intranet site Schemes to undertake voluntary work in work time Measures to encourage running, cycling, walking etc Free health advice/events about healthy lifestyles Programmes, advice or support to help give up smoking Loan towards or discounts on bicycle purchases Free or subsided gym membership Private medical insurance Healthy food choices in vending machines/staff canteenHealth screening or health checks Stress management support or adviceSubsidised canteen or restaurant Access to occupational health services Counselling/other employee assistance programme Work area assessment and adjustments Training in injury prevention Pension scheme More than 20 days of holiday excluding bank holidays
9 9 1314 18 20 2122 23 23 24 24 32 33 38 40 48 51 70 84 0 10 20 30 40 50 60 70 80 90 Base: all respondents (unweighted base: 2,019).
An important finding (and one that is repeated throughout the survey data) is that the size of the organisation the respondent worked for had an impact on the results: those working for medium and large organisations were more likely to mention almost all benefits and initiatives compared with those working in small organisations (see Table 2.1). Many benefits and initiatives were more likely to be provided to public sector workers than to those working in the private sector (the exceptions were private medical insurance, subsidised canteen/restaurant, schemes to undertake voluntary work and weight loss advice/programmes). It is worth pointing out, however, that these characteristics are linked: public sector workers were more likely than private sector workers to work in organisations with 250+ employees.
Table 2.1 Provision of health and well-being initiatives or benefits
Organisation size Organisation type
Total % Small (1-50) % Medium (51-249) % Large (250-499) % Very large (500+) % Private % Public %
More than 20 days’ holiday excluding
bank holidays 84 69 85 86 91 79 94
Pension scheme 70 35 66 72 87 58 95
Training in injury prevention 51 32 43 49 61 48 56
Work area assessments and
adjustments 48 26 39 51 59 42 59
Counselling/other employee
assistance programme 40 11 26 38 55 28 62
Access to occupational health services 38 10 27 36 52 26 63
Subsidised canteen or restaurant 33 15 23 28 44 33 34
Stress management support or advice 32 11 17 26 45 23 49
Healthy food choices 29 12 27 22 38 25 38
Health screening or health checks 24 5 11 33 34 21 30
Free or subsidised gym membership 23 6 17 23 33 19 33
Private medical insurance 23 11 25 31 28 30 10
Loan or discounts on bicycle purchases 22 6 15 21 30 16 32
Programmes, advice or support to help
give up smoking 21 6 14 15 29 15 33
Free health advice/events about
healthy lifestyles 20 5 9 19 28 15 29
Measures to encourage running,
cycling, walking, etc 18 4 14 13 26 13 29
Schemes to undertake voluntary work
in work time 14 4 8 11 19 13 14
Health and wellbeing intranet site 13 2 4 8 21 10 20
Weight loss/management advice or
programmes 9 3 5 6 14 8 12
Fitness classes at work 9 3 4 8 12 6 14
Unweighted base 2,019 474 225 107 1,131 1,274 661
13
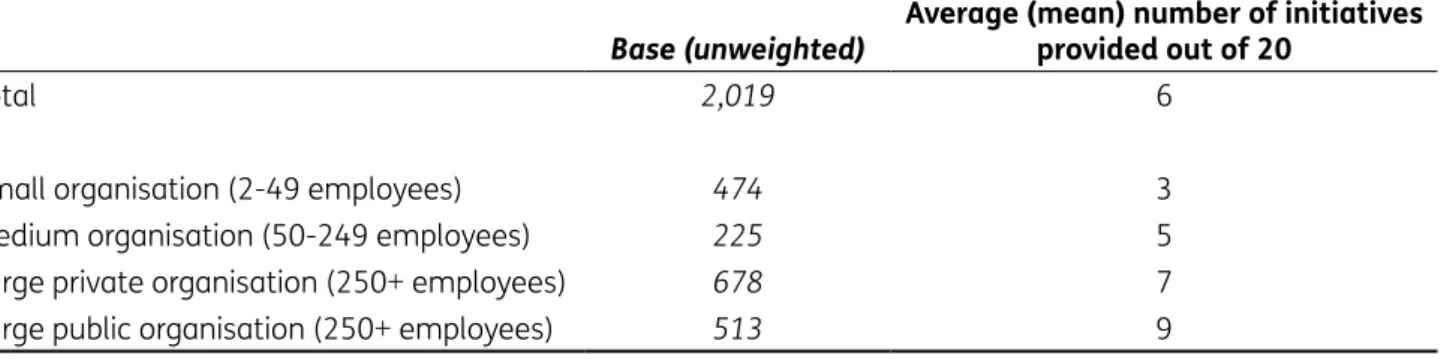
Small sample sizes prevented detailed analysis at an individual initiative level so a summary measure was calculated to demonstrate the general patterns in the data, namely the average number of initiatives provided out of the 20 shown to respondents. Table 2.2 illustrates this
summary measure by size of organisation and, in the large organisation size band, by public versus private sector. It shows that employees working for small organisations mentioned fewer initiatives or benefits on average compared with employees in large private sector and large public sector organisations.
Table 2.2 Average number of health and well-being initiatives provided
Base (unweighted) Average (mean) number of initiatives provided out of 20
Total 2,019 6
Small organisation (2-49 employees) 474 3
Medium organisation (50-249 employees) 225 5
Large private organisation (250+ employees) 678 7
Large public organisation (250+ employees) 513 9
2.1.1
Take up of health and well-being initiatives or benefits
For each initiative or benefit provided, with the exception of paid holiday, respondents were asked whether they had made use of it in the last 12 months. Levels of take up varied and some initiatives were more widely used than others.
Table 2.3 shows the provision and take up of each initiative in the last 12 months. Take up is displayed in two ways, first as a proportion of the total sample and second as a proportion of those who were provided with (and were eligible for) each initiative. It should be noted that certain benefits and initiatives would have been offered on a universal basis to all employees in an organisation, whereas others would have only been relevant to, or targeted at, certain employees. For example, help to give up smoking and weight loss programmes would have only been of relevance to some employees, and as a consequence, these two initiatives were taken up by relatively small proportions of eligible employees: ten per cent and 17 per cent respectively. Across the sample as a whole, the most utilised initiative was an employer pension scheme: just over half of all respondents (51 per cent) had made use of this benefit in the last 12 months. When considering only those employees who were provided with this benefit and were eligible to receive it, take up was high at 75 per cent. However, there was variation in take up across the sample, for example, public sector workers were more likely than private sector workers to have taken up this initiative (89 per cent versus 61 per cent), as were those in the higher income brackets (85 per cent of those earning £20,800 or more after tax and national insurance had taken up this initiative versus 64 per cent of those earning less than this amount).
The other most commonly taken up initiatives across the whole sample were work area adjustments or assessments, training in injury prevention and a subsidised canteen (all 29 per cent). However, when just those who were provided with each benefit and were eligible to receive it were considered, the take up rates varied quite considerably at 63 per cent, 59 per cent and 89 per cent respectively, i.e. when offered to eligible respondents, the benefit of a subsidised canteen was more widely adopted than health and safety initiatives.
Whilst only 29 per cent of employees reported healthy food choices being made available in vending machines or the staff canteen by their organisation, three-quarters of eligible employees (75 per cent) took advantage of this initiative. In the case of private medical insurance, across the whole sample take up was relatively low at 12 per cent. However, among those who were provided with the benefit and were eligible for it, take up stood at 58 per cent (i.e. on a par with other, more widely available benefits).
Table 2.3 Provision and take up of health and well-being initiatives or benefits
Organisationprovides Take up in the last 12 months
All respondents (unweighted 2,019) % All respondents (unweighted 2,019) %
All provided with and eligible for the initiative (base varies)
%
Subsidised canteen or restaurant 33 29 89
Healthy food choices available in
vending machines or staff canteen 29 22 75
Employer pension scheme 70 51 75
Work area assessment and
adjustments 48 29 63
Training in injury prevention 51 29 59
Private medical insurance 23 12 58
Health screening or health checks 24 10 44
Dedicated health and well-being
intranet site 13 5 41
Measures to encourage activities such as running, cycling and walking
18 7 36
Free health advice or events to raise
awareness about healthy lifestyles 20 7 35
Free or subsided gym membership 23 7 32
Fitness classes at work 9 2 27
Access to occupational health
services 38 10 26
Schemes to help employees undertake voluntary work in work time
14 3 21
Weight loss or weight management
advice or programmes 9 2 17
Stress management support or
advice 32 5 15
Loan towards or discounts on
bicycle purchases 22 3 12
Programmes, advice or support to
help people give up smoking 21 2 10
Access to counselling or other
employee assistance programme 40 3 8
Base: All.
Note: Take up is shown in two ways, first as a proportion of the total sample, and second as a proportion of those who were provided with and were eligible for the initiative or service.
15
2.2
Flexible working
Flexible working is generally upheld as a positive working practice as it allows people with family or other caring commitments to fit work around other responsibilities, whilst for those without specific caring commitments, such working arrangements may be adopted as a lifestyle choice.
The survey explored how many employees worked for organisations that offered flexible working practices, where flexible working was taken to cover a range of practices including flexi-time, working from home, job sharing and the ability to change hours, work condensed hours or change working patterns23.
Almost six in ten respondents (57 per cent) said their organisation offered flexible working24, and Table 2.4 summarises the types of respondents more or less likely to report flexible working options being provided by their employing organisation.
Respondents working for public sector, very large organisations (with 500+ employees) and
organisations in which there was trade union presence were among those most likely to report the presence of flexible working options. As already mentioned, there is some linkage between these factors: public sector organisations tend to be larger and to be characterised by a trade union presence.
Perhaps reflecting the nature of their work, respondents working as skilled tradesmen, process, plant, machine operatives and those in elementary occupations were less likely than respondents working in managerial, associate professional and administrative roles to be working for
organisations that offered flexible working.
In terms of income, those earning £20,800 per annum or more (after tax and national insurance) were more likely than lower paid respondents to report that their organisation offered flexible working practices. Finally, respondents who reported flexible working options in their organisations often held more positive views about various aspects of their working life.
23 Flexibility was also examined in terms of the practices used by employers to help people back to work after illness and to facilitate their ability to do their job on a day to day basis (see Section 3.3).
24 It is not possible to put this figure in context with other findings from either the Labour Force Survey or Workplace Employment Relations Survey (WERS); both surveys measure employees’ actual (or potential) use of an array of flexible working options, rather than an organisation’s provision of flexible working practices per se.
Table 2.4 Summary of characteristics of respondents with higher/lower
likelihood of working for an organisation that offers flexible
working options
Flexible working options offered by employing organisation
Analysis variable More likely Less likely
Type of organisation Public (63 per cent) Private (53 per cent) Trade union presence Yes (62 per cent) No (51 per cent) Organisation size Very large (500+ employees) (64 per
cent) Organisations with <500 employees (50 per cent or less) Income (after tax and
National Insurance) >= £20,800 (65 per cent) < £20,800 (53 per cent) Occupation Managerial, associate professional and
administrative (all 66 per cent) Skilled tradesmen, process, plant, machine operatives and elementary occupations (41 per cent, 37 per cent and 40 per cent respectively)
2.3
Attendance management
Keeping people in work is a key policy objective, various policy documents point to the links between working and beneficial health outcomes25. In this survey, attendance management was examined in terms of an organisation’s flexibility when faced with people returning to work after illness or injury, or making adjustments to jobs to help people stay in work.
2.3.1
Return to work assistance
We asked what employers had done to help respondents with more than five days’ continuous sick leave back to work, various types of assistance were explored.
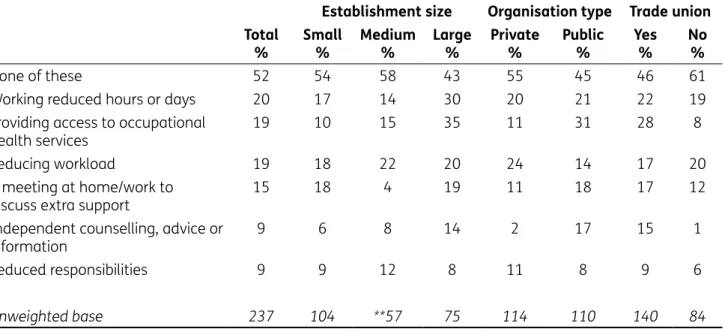
Among this group of respondents, half (48 per cent) said their employer had used one or more measures to help them back to work (see Table 2.5). The most commonly reported were: being allowed to work reduced hours or fewer days (20 per cent); access to occupational health services (19 per cent); or, having workloads reduced (19 per cent). Smaller proportions mentioned a meeting at home or at work to discuss what extra help or support they might need, independent counselling, advice or information to help with work-related, health-related, legal, financial or domestic issues and reduced responsibilities at work.
17
Table 2.5 Measures used to help employees with five or more days of
continuous absence back to work
Establishment size Organisation type Trade union Total
% Small % Medium % Large % Private % Public % Yes % No %
None of these 52 54 58 43 55 45 46 61
Working reduced hours or days 20 17 14 30 20 21 22 19
Providing access to occupational
health services 19 10 15 35 11 31 28 8
Reducing workload 19 18 22 20 24 14 17 20
A meeting at home/work to
discuss extra support 15 18 4 19 11 18 17 12
Independent counselling, advice or
information 9 6 8 14 2 17 15 1
Reduced responsibilities 9 9 12 8 11 8 9 6
Unweighted base 237 104 **57 75 114 110 140 84
Base: All who had longer than five days’ continuous sick leave.
Note: Don’t know not shown (< 0.5 per cent).** denotes small base (unweighted base less than 100). Considering individual initiatives, it was apparent that public sector employees who had had a continuous period of sickness of five days or more were more likely than those working in the private sector to mention being given access to occupational health services (31 per cent versus 11 per cent) and independent counselling, advice or information (17 per cent versus two per cent). Linked to this (the public sector being more unionised than the private sector), respondents working in organisations with a trade union presence were also more likely to have been offered both these initiatives than those working in non-unionised organisations.
Those working for large establishments were more likely to mention access to occupational health than respondents working for small establishments (35 per cent versus ten per cent). When the results were analysed in terms of whether the respondent had a long-term health condition, no significant differences were detectable.
2.3.2
Job adjustments
The survey also examined whether employers had made adjustments to people’s jobs to help keep them in work. This question was directed to respondents who reported more than five days’ continuous sick leave and explored whether employers had made adjustments to their job at any point, not just on their return to work from sick leave.
Forty-four per cent of respondents in this group said their organisation had made, or had offered to make, adjustments to help them do their job at some point (see Figure 2.2). Eighteen per cent were offered different or reduced working hours, while 15 per cent were offered different duties at work. Smaller proportions were offered specialist equipment, e.g. a telephone with a text display, different chairs or desks, extra breaks and changes to the work area to improve access.
Figure 2.2 Adjustments ever made or offered by employer to help employees
with sick leave do their jobs (% of respondents)
Further analysis revealed no significant variations by the presence of a long-term health condition or by the characteristics of the employing organisation. There were, however, variations by gender: women were more likely than men to have been offered different or reduced working hours (25 per cent versus eight per cent).
2.4
Stress management
The survey explored to what extent stress management support was provided by organisations and the direct experiences of managed employees and line managers.
Around a third of respondents reported that stress management support or advice was provided by their organisation, and, of those eligible, 15 per cent had taken up this support service. Respondents who had a line manager or supervisor were also asked to what extent they agreed or disagreed with the statement ‘(they) have talked to you about avoiding stress at work’26. Whilst around a third
(34 per cent) of this group agreed that their line manager had talked to them about avoiding stress at work, nearly half disagreed that this was the case (48 per cent) – although it should be noted that not all respondents would have wished for, or necessarily needed, such intervention.
Respondents who were themselves managers were asked whether they had ever received information, help or advice on how to handle stress among the staff they managed. Just under half of this group (45 per cent) had received such support.
26 The five point scale was: strongly agree, tend to agree, neither agree nor disagree, tend to disagree and strongly disagree.
56
10
0 20 30 40 50 60
Building modifications, e.g. ramps Job coach or personal assistant Changes to work area to improve access Extra breaks Different chair or desk Equipment to help do your work Different duties Different or reduced working hours None of these 18 15 11 10 7 6 1 1
Base: all who had longer than five days’ continuous sick leave (unweighted 237). Note: don’t know and other not shown (two per cent combined).
19
Some familiar patterns were evident:
• Respondents working in the public sector were more likely than those working in the private sector to say that stress management support measures were in place.
• Respondents in larger organisations and in organisations with a trade union presence tended to be more likely to report stress management support measures or interventions than those in small organisations or those in organisations without a trade union presence.
The survey did not collect reasons for sickness absence in the past year, but depression, bad nerves or anxiety were reported as the most common symptoms of ill health caused by work. Further analysis, however, did not reveal any evidence, that this group of respondents had been targeted for support from their line manager, i.e. they were just as likely as other employees to say that their line manager had spoken to them about managing stress. It is important to note that line managers may not have been aware of such health symptoms among their staff.
3 Relationships at work and
work culture
Summary
This chapter explores how employees felt about relationships at work and the culture of their organisation. Relationships with line managers, those managed, senior managers and other colleagues are examined, while organisational culture is considered in terms of the employer’s vision and values, consultation practices, reward and development and general working culture. Some of the key findings are:
• The majority of respondents were positive about many aspects of their relationships with different groups of colleagues. Some of the most positive views related to the help and support received from work colleagues. There was, however, some criticism of senior managers, particularly in terms of delivering on promises.
• Workers in small organisations appeared to be able to foster more positive working relationships with those at a senior management level and were more positive about the time they were able to devote to staff management. Respondents’ views about line managers did not vary by organisation or establishment size.
• Public sector managers were more negative than private sector managers about the time available for managing staff.
• In terms of organisational culture, respondents were most negative about issues relating to reward and development, with 39 per cent agreeing that their organisation failed to reward extra effort made by staff.
3.1
Line managers or supervisors
The survey examined workers’ views on their line manager or supervisor using eight agreement statements as follows27, (they):
• give you help and support;
• give constructive feedback on the work you do; • expect you to work too hard;
• show they care about you as a person; • are unwilling to listen to your problems; • encourage you at work;
• treat you unfairly;
• encourage you to develop your skills.
21
Table 3.1 shows the proportions of respondents who agreed with each statement. It should be noted that the three statements at the bottom of the table were all negatively phrased, so low levels of agreement are a positive finding. From the table it is clear that line managers and supervisors were positively regarded: over 70 per cent of respondents agreed to some extent with all the positively phrased statements, and a quarter or less agreed with the negatively phrased statements about working too hard, line managers being unwilling to listen to problems, and unfair treatment (eight per cent of respondents agreed they were treated unfairly, although this does, of course, equate to many thousands of employees when grossed up to a total population level).
Table 3.1 Levels of agreement and disagreement with statements about line
manager/supervisor
Strongly agree % Tend to agree % Neither agree nor disagree % Tend to disagree % Strongly disagree % All agree % All disagree %Give you help and support 35 43 11 7 4 78 11
Encourage you at work 35 41 14 8 3 76 11
Encourage you to develop
your skills 36 38 14 8 3 75 11
Give constructive feedback
on the work you do 33 40 12 10 6 72 16
Show they care about you as
a person 30 41 14 9 6 71 15
Expect you to work too hard 8 17 21 35 19 25 55
Are unwilling to listen to your
problems 5 10 11 37 37 15 74
Treat you unfairly 3 6 8 31 53 8 84
Base: All who are managed or supervised (unweighted: 1,907).
Note: Percentages in table are row percentages; individual percentages may not tally with grouped figures due to rounding.
Analysis of the eight statements showed no significant variations in levels of agreement when public/private sector, industry sector and occupation splits were examined.
In terms of personal demographics, women were more likely than men to perceive that their line manager or supervisor was willing to listen to their problems: 42 per cent of women strongly disagreed that their line manager or supervisor was ‘unwilling to listen to your problems’ compared with 32 per cent of men. The findings also varied by the age of the respondent: across the positively worded statements there was a tendency for levels of agreement to decrease with age. For example in the case of ‘(they) encourage you at work’, 86 per cent of those aged 16-24 agreed with this statement, reducing to 70 per cent of those aged 45 or older.
There were no other significant demographic differences, but it appeared to be the case that respondents who said that flexible working was offered by their employer had a greater tendency to be positive: they were more likely to agree with all the positively worded statements than other respondents. This pattern was also carried through to the negatively worded statements, for example in the case of ‘(they) expect you to work too hard’, 31 per cent of respondents in organisations with flexible working strongly disagreed with the statement versus 20 per cent of those in organisations without flexible working practices.
3.2
Senior managers
Given that senior managers are influential within an organisation but may be more ‘remote’ to employees (particularly in large organisations), the survey aimed to explore respondents’ views of this group28.
Respondents who reported that they had had contact with senior managers in the last year, or whose line manager was part of the senior management team, or who were themselves part of the senior management team were asked to what extent they agreed or disagreed with six statements about senior managers29 as follows, (they):
• are difficult to communicate with; • show they listen to junior staff; • fail to seek the views of staff; • respond to suggestions from staff; • deliver on their promises;
• treat employees unfairly.
Table 3.2 summarises the findings and, whilst the general picture is one of positivity, it is clear that levels of agreement with the positively phrased statements are not as high as was the case with the positive statements relating to line managers. Over half of employees agreed that senior managers
responded to suggestions from staff (58 per cent), showed they listened to junior members of staff (55 per cent), and encouragingly, less than a fifth of employees (16 per cent) agreed that senior managers treated employees unfairly (although this is a slightly higher percentage than that recorded in relation to unfair treatment by line managers).
Respondents were less positive, however, about senior managers delivering on their promises: less than half (47 per cent) agreed with this statement and three in ten employees were critical in terms of senior managers seeking staff views (29 per cent said they failed to seek the view of staff). Around a quarter (26 per cent) thought that senior managers were difficult to communicate with.
28 In the survey, senior managers were defined as follows: ‘a senior manager may be someone more senior than the person who manages or supervises you, right through to those at the top of your organisation. They may or may not work at your site’. Those without a line manager or supervisor were asked whether they were themselves part of the senior management team, and those who said they had a line manager but no senior managers were asked whether their line manager was part of the most senior team in their organisation.
23
Table 3.2 Levels of agreement and disagreement with statements about line
manager/supervisor
Strongly agree % Tend to agree % Neither agree nor disagree % Tend to disagree % Strongly disagree % All agree % All disagree %Respond to suggestions from
staff 16 43 20 15 7 58 22
Show they listen to junior staff 16 39 20 17 8 55 25
Deliver on their promises 12 35 28 17 8 47 25
Fail to seek the views of staff 9 20 16 36 19 29 55
Are difficult to communicate
with 8 18 14 35 25 26 60
Treat employees unfairly 4 12 16 38 29 16 68
Base: All having contact with senior managers in past year/whose line manager part of senior management team/who were themselves part of the senior management team (unweighted: 1,796).
Note: Percentages in table are row percentages; individual percentages may not tally with grouped figures due to rounding.
Further analysis showed that gender appeared to have no influence on respondents’ views of senior managers. Age had an impact in the case of listening to junior staff: 67 per cent of respondents aged 16-24 agreed with the statement versus 53 per cent or less of older respondents.
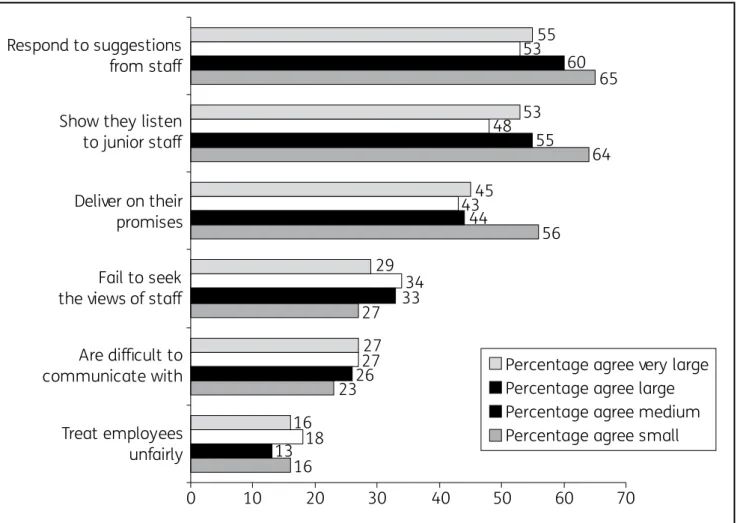
There was some evidence that smaller organisations were able to foster better communications between staff at different levels. For example, in the case of senior managers showing they listened to junior staff, respondents working in small organisations were more likely than those working in the very largest organisations (with 500+ employees) to agree that this was the case (64 per cent versus 53 per cent respectively – see Figure 3.1). In the case of senior managers responding to suggestions from staff, 22 per cent of respondents working in small organisations strongly agreed with this statement, versus 13 per cent of respondents working in organisations with 500+ employees. This, perhaps, points to an issue of greater interaction with senior staff in smaller workplaces.
Figure 3.1 Level of agreement (%) with statements about senior managers,
by size of organisation
Patterns also emerged with trade union presence: where no trade union was present, some ratings for senior managers were higher than those organisations with trade union presence. For example, 62 per cent of respondents in organisations with no trade union presence agreed that senior managers responded to staff suggestions compared with 53 per cent of organisations with a trade union presence. This linked with the size of the organisation, as respondents in smaller organisations were less likely to report trade union presence30.
3.3
Relationships with staff
The experience of managing staff was also covered by the survey. No minimum or maximum size of team was specified in the survey questions; it was hypothesised that teams of all sizes could have a positive or negative impact on a manager’s experience at work.
30 Seventeen per cent of employees in small organisations reported the presence of a trade union, compared with at least 32 per cent of those working in larger organisations.
55 10 0 20 30 40 50 60 70 Treat employees unfairly Are difficult to communicate with Fail to seek the views of staff Deliver on their promises Show they listen to junior staff Respond to suggestions from staff
Percentage agree very large Percentage agree large Percentage agree medium Percentage agree small
53 60 65 53 48 55 64 45 43 44 56 29 34 33 27 27 27 26 23 16 18 13 16
Base: all having had contact with senior managers in past year, or whose line manager was part of senior management team, or who were themselves part of the senior management team (unweighted bases: small (419), medium (207), large (90), very large (1,009)).
25
Respondents who had a management or supervisory responsibility31 were asked to what extent they agreed or disagreed with the following four statements:
• My staff are difficult to manage. • My staff give me positive feedback.
• My staff are unwilling to share their problems with me. • I have enough time to manage my staff.
Table 3.3 shows that over eight in ten respondents (84 per cent) agreed that their staff gave them
positive feedback. Meanwhile just seven per cent agreed that their staff were unwilling to share their problems (82 per cent disagreed with this statement) and 11 per cent agreed that their staff were difficult to manage (77 per cent disagreed). In terms of having enough time to manage or supervise staff, six in ten respondents (63 per cent) were positive in this regard but a quarter (25 per cent) were negative, and this was the highest level of negativity across the four statements.
Table 3.3 Levels of agreement and disagreement with statements about
relationships with staff
Strongly agree % Tend to agree % Neither agree nor disagree % Tend to disagree % Strongly disagree % All agree % All disagree %My staff give me positive
feedback 25 59 11 4 1 84 5
I have enough time to
manage my staff 20 42 12 20 5 63 25
My staff are difficult to
manage 1 10 12 40 37 11 77
My staff are unwilling to share
their problems with me 2 6 11 47 35 7 82
Base: All responsible for managing or supervising staff (unweighted: 845).
Note: Percentages in table are row percentages; individual percentages may not tally with grouped figures due to rounding.
Levels of agreement to most statements did not tend to vary by organisational characteristics, with one exception: managers in private sector organisations were much more likely than those in the public sector to say they had enough time to manage their staff (71 per cent versus 51 per cent). As already mentioned, public sector organisations tend to be trade unionised, so it followed that managers in organisations with a trade union presence were less likely than other managers to agree that they had sufficient time for staff management.
Analysis by personal demographics shows that age was important in some instances. In the case of feedback, those aged 35 and older were more likely than those aged 25-34 to agree that their staff gave them positive feedback (at least 85 per cent versus 74 per cent). However, in terms of having sufficient time to manage, younger respondents aged 16-34 were more likely than those aged 35+ to agree that they had enough time (72 per cent agreed versus 59 per cent of those aged 35 or older); these findings may relate to those observed for the public/private sector, as the public sector is characterised by an older workforce.
31 Respondents were asked ‘In your job, do you regularly have any formal responsibility for supervising the work of other employees?’ and interviewers were provided with a list of exclusions. Please see questionnaire in the appendices for further details.