Contents lists available atScienceDirect
Journal of Corporate Finance
journal homepage:www.elsevier.com/locate/jcorpfin
Private equity investment criteria: An experimental conjoint
analysis of venture capital, business angels, and family offices
Joern Block
a,b, Christian Fisch
a,b, Silvio Vismara
c,d,⁎, René Andres
aaFaculty of Management, Trier University, 54286 Trier, Germany
bErasmus Institute of Management (ERIM) and Erasmus School of Economics, Erasmus University Rotterdam, P.O. Box 1738, 3000, DR, Rotterdam, the Netherlands
cDepartment of Management, Information and Production Engineering, University of Bergamo, viale Marconi 5, 24044 Dalmine (BG), Italy dDepartment of Accountancy and Corporate Finance, Ghent University, Sint-Pietersplein 7, 9000 Gent, Belgium
A R T I C L E I N F O Keywords: Venture capital Business angels Family offices Investment criteria Conjoint analysis JEL classification: G24 L26 G11 M13 G30 A B S T R A C T
We use an experimental conjoint analysis to investigate the investment criteria of 749 private equity investors, distinguishing between family offices, business angels, venture capital funds, growth equity funds, and leveraged buyout funds. Our results indicate that revenue growth is the most important investment criterion, followed by the value-added of product/service, the management team's track record, and profitability. Regarding differences across investor types, we find that family offices, growth equity funds, and leveraged buyout funds place a higher value on profitability as compared to business angels and venture capital funds. Venture capital funds, in turn, pay more attention to companies' revenue growth, business models, and current in-vestors. With these results, our study contributes to the corporate finance literature by deepening our understanding of how different types of private equity investors make investment decisions.
1. Introduction
Prior research in corporate and entrepreneurial finance has comprehensively investigated the effects of private equity (PE) fi-nancing. PE investments are associated with improvements in operating performance (Kaplan and Strömberg, 2009) and oftentimes outperform investments in public equity markets (e.g.,Ang et al., 2018;Braun et al., 2017;Harris et al., 2014;Kaplan and Schoar,
2005;Kaplan and Sensoy, 2015;Phalippou and Gottschalg, 2009;Robinson and Sensoy, 2013). These findings are consistent across
the different types of PE investments, ranging from leveraged buyout investments (e.g.,Kaplan, 1989) to venture capital investments (e.g.,Chemmanur et al., 2011).
The increased performance of PE investments can be ascribed to both selection and treatment effects (Bengtsson and Sensoy,
2011;Bernstein et al., 2016;Chemmanur et al., 2011;Rin et al., 2013;Puri and Zarutskie, 2012). In contrast to stock markets or
debtholders, PE investors are active investors who provide their portfolio companies with bundles of value-added activities. The benefits can be direct, such as through coaching activities or network access, and indirect through certification effects to third parties (e.g., customers, skilled workers, alliance partners, and financial intermediaries) (e.g.,Bottazzi et al., 2008;Gompers and Lerner,
https://doi.org/10.1016/j.jcorpfin.2019.05.009
Received 8 October 2018; Received in revised form 28 March 2019; Accepted 19 May 2019
⁎Corresponding author at: Department of Management, Information and Production Engineering, University of Bergamo, viale Marconi 5, 24044 Dalmine (BG), Italy.
E-mail addresses:block@uni-trier.de(J. Block),cfisch@uni-trier.de(C. Fisch),silvio.vismara@unibg.it(S. Vismara),
rene.andres.trier@gmail.de(R. Andres).
Available online 21 May 2019
0929-1199/ © 2019 The Authors. Published by Elsevier B.V. This is an open access article under the CC BY-NC-ND license (http://creativecommons.org/licenses/BY-NC-ND/4.0/).
2001;Hellmann and Puri, 2002;Korteweg and Sørensen, 2017;Lerner, 1995). The skills of PE investors, however, do not only lie in nurturing portfolio companies. As recently documented in a survey byGompers et al. (2016a), PE investors place a heavy emphasis on both their ability to select promising companies as well as their capacity to add value through financial, governance, and op-erational engineering.
Despite the importance of the investment selection, however, only a few studies have yet assessed how PE investors actually select their investments and conduct investment decisions.1This is lamentable, considering that PE investors devote considerable resources to evaluating and screening investment opportunities (Kaplan and Strömberg, 2001;Gompers et al., 2016a). Their investment process starts with screening many businesses, although they ultimately only invest in a few companies.Gompers et al. (2016a), for instance, report that for every hundred opportunities considered, the average PE investor deeply investigates 15, signs an agreement with about eight, and closes fewer than four.
Although the decision making of PE investors is often debated (e.g.,Gompers and Lerner, 2001;Kaplan and Strömberg, 2004), this study is among the first to assess the investment criteria of PE investors. Empirical evidence on their investment criteria is indeed scarce, arguably due to the empirical challenges of isolating the effects of different company characteristics. This is not possible using observational data, as it would require assessing investors' preferences between two identical companies that only differ in pre-determined characteristics. The experiment byBernstein et al. (2017)uses correspondence testing methodology to randomize in-vestors' information sets about company characteristics in nearly 17,000 emails. They vary the characteristics revealed in emails and record when investors click and choose to learn more about the particular company. Similarly, in our study, we randomly vary investors' information sets in a tightly controlled information environment.
We compare decision-making across different investor types using a large-scale conjoint analysis of 19,474 screening decisions by 749 PE investors, which we obtained by contacting 15,600 investment professionals listed in Pitchbook. Conjoint analysis enables a more accurate representation of the actual decision behavior and the underlying preference structure of participants, relative to post hoc approaches such as questionnaires and interviews (e.g.,Shepherd and Zacharakis, 1999). Usually, PE investors assess companies holistically and evaluate multiple criteria simultaneously. In conjoint analysis, decision criteria are measured conjointly. For ample, investment decisions involve making trade-offs between criteria, which can be captured with conjoint analysis. This ex-perimental method requires participants to make a series of assessments based on a discrete set of company attributes. Specifically, the attributes used in our study are (1) profitability, (2) revenue growth, (3) track record of the management team, (4) reputation of current investors, (5) business model, (6) value-added of product/service, and (7) international scalability. Every participant in the experiment needed to evaluate multiple companies that differ only in the specifications of the above attributes (e.g., 20% revenue growth for company 1 versus 50% revenue growth for company 2) and decide in which company they would be more likely to invest. Then, a multilevel logistic regression model evaluates and compares the importance of the different investment criteria.
The conjoint experiment enables a better understanding of the investment criteria of investors and allows a comparison of these criteria across investor types. In fact, considerable differences in the decision-making of different investor types likely exist (Lerner
et al., 2007). While there is an established literature on the characteristics and behavior of specific types of investors, a broader
perspective is underdeveloped so far (Hellmann et al., 2017). A more fine-grained analysis is needed, as the supply side of en-trepreneurial finance ecosystems comprises a very diverse set of investor types. Since we aim to study decision-making across investor types in an encompassing way, we distinguish the following investor types. (1)Family offices (FOs)are organizations that manage the wealth of business families by taking actions (i.e., investments) to sustain and grow their wealth (Gilding, 2005; Gray, 2005). Prominent examples of FOs include Horizons Ventures, the Hong-Kong-based FO of the Kashing family, and Madrone Capital Partners, the US-based FO of the Walton family (Walmart). Despite their economic relevance and long history, accessing information about FOs is difficult for both researchers and market participants because FOs are not required to disclose information about their investments. Quantitative information on FOs is scarce, making them a particularly attractive investor type for our experiment-based research. (2)Business angels (BAs)are wealthy individuals that invest their own money. As such, they are an important pillar of entrepreneurial finance and have become an important source of funding in recent years (Kerr et al., 2014;Hellmann and Thiele, 2015). (3)Venture capital funds (VCs)are the best-researched investor type in entrepreneurial finance. Here, VCs serve as an im-portant benchmark in order to be able to understand and classify differences between VCs and other investor types. (4)Growth equity funds (GEFs)constitute an investor type that is particularly crucial in later-stage financing (Gompers et al., 2016a;Ritter, 2015). (5) Leveraged buyout funds (LBOs)constitute our final investor type (e.g.,Cumming et al., 2007). In a leveraged buyout, a company is acquired by an investment firm using a relatively small portion of equity and a relatively large portion of outside debt financing
(Kaplan and Strömberg, 2009).
We make the following contributions. First, we identify the relative importance of PE investors' investment criteria. Overall, the most important investment criteria are (1) revenue growth, (2) value-added of product/service, and (3) management team track record. International scalability, current profitability, business model, and the reputation of existing investors are relevant but of lower importance. The main aspect investigated by previous studies is, arguably, the importance placed on the management team (the “jockey”, inKaplan et al., 2009) relative to the business model (the “horse”). Although the team has been recognized as important in some studies about VC preferences (e.g.,Kaplan and Strömberg, 2004),Kaplan et al. (2009)argue that, in theory, VCs 1As PE deals involve at least two parties, selection effects pertain to both the PE investor and the entrepreneur sides of the market. Although the source of deal flow – and the related matching process – is a relevant aspect in the analysis of PE (Schwienbacher, 2007, 2013;Sørensen, 2007), we focus on PE investment criteria in this study. However, we acknowledge that these criteria might be influenced by entrepreneurial choices among different funding sources.
should place more weight on business models than on management teams since companies' business lines remain stable while management turnover is substantial. Recently,Gompers et al. (2016b)report that 95% of the VCs in their survey mention the management team as an important factor, 47% as the most important factor. Similarly, the experiment byBernstein et al. (2017) reveals that BAs are highly responsive to information about the founding team, whereas information about traction and current investors does not lead to significantly increased interest. Adding to this discussion, we find that the management team is an im-portant investment criterion for our participants. However, we also find that investors rate revenue growth and the value-added provided by the company's product or service to be more important than the management team's track record.
Second, we contribute to prior research by comparing the importance of the respective investment criteria across different in-vestor types. While previous literature has suggested that considerable differences in the decision-making of different inin-vestor types likely exist (Lerner et al., 2007), a systematic empirical assessment of these differences is absent. Further adding to this literature, we incorporate FOs as an investor type that prior corporate finance literature has largely neglected. Recent practitioners' reports show that while the fraction of investments by FOs in real estate has decreased over the last decade, direct equity investments have almost doubled (Bloomberg, 2014). Considering that the 50 largest FOs account for assets under management of approximately 1000 $b
(Bloomberg, 2014), research on the assessment of investments by FOs is both highly timely and relevant. Our study sheds light on the
investment criteria of FOs and finds that, relative to other PE investors, FOs attribute greater importance to the profitability of portfolio companies but less importance to revenue growth. An explanation is that by undertaking risky decisions, the managers of FOs risk losing family wealth and jeopardize the financial and social wellbeing of future family generations. They are therefore more concerned with the conservation of irreplaceable capital through investments in already profitable companies, rather than bearing the risk – and potentially high returns – of high-growth companies.
The remainder of the study proceeds as follows.Section 2presents the research design, including the sample, the descriptive statistics about the different types of investors considered in this study, and the conjoint analysis.Section 3discusses the results of the study.Section 4concludes the paper.
2. Research design 2.1. Data and sample
We identified investors and investment professionals in Pitchbook, which is one of the most comprehensive databases in en-trepreneurial finance and is regularly used for research in the field of PE investments (e.g.,Kaplan and Lerner, 2016;Paglia and
Harjoto, 2014). The information provided in Pitchbook is mainly based on disclosed information from limited partners, filings of
national regulators, and other available public information. The advantage of Pitchbook relative to alternative data sources is that it reports information on investors' teams as well as their (individual) contact details, in addition to information on the investment entity (Brown et al., 2015). We used this information to create our sample of investors and investment professionals, which we identified in 2016.
We first filtered Pitchbook by investor type (i.e., funds), selecting all investment entities classified as a VC fund, FO, buyout fund, or GEF, including multiple investor types. Second, we only considered investors that had done at least one equity deal in the last ten years (as of 2016) that was classified as series A, B, C, D (or later), or expansion. This was done to ensure that participants in the experiment actually had some experience with regard to PE investments. Third, we identified every investment professional in Pitchbook working for these investment entities and removed those who had missing values with regard to e-mail and/or location. This approach led to the identification of 15,600 investment professionals which we invited via email to participate in our research. We sent a total of three reminders over five months and collected 749 responses (response rate = 6.24%) in total. We asked participants about the type of investor they work for as Pitchbook's classification can contain multiple classifications per investor. For example, an investor could be classified as a VC and FO simultaneously. Out of the 749 respondents, 59 (7.9%) worked for FOs, 20 (2.7%) for or as BAs, 396 (52.9%) for VCs, 189 (25.2%) for GEFs, and 85 (11.3%) for LBOs. In line with previous studies (e.g.,
Graham and Harvey, 2001), the experiment was run as an anonymous survey as data collected about investment behavior is sensitive
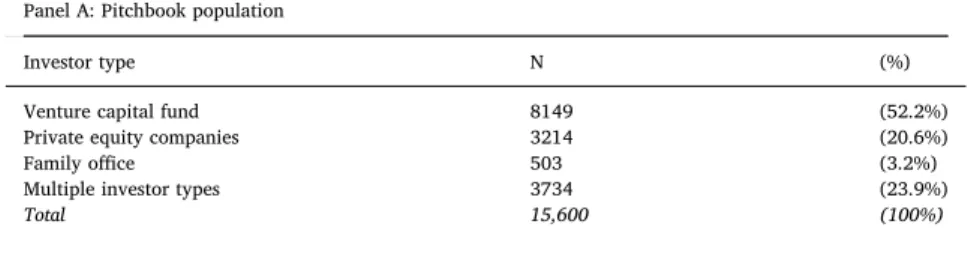
and anonymity is required to fully comply with the latest data security legislation (EU-GDPR/18 General Data Protection Regulation). To assess the representativeness of our sample, we first compare the participants in our experiment to the population of investors retrieved from Pitchbook. Overall, the representation of each investor type in our experiment is similar to the distribution of investor types in the full sample, as illustrated inTable 1.2
To assess the representativeness of our sample, we test for non-response bias by comparing participants to non-participants (e.g.,
Armstrong and Overton, 1977). The results are displayed inTable 2, which reports the mean values of the population retrieved from
Pitchbook (N = 15,600), our final sample (N = 749), and az-test for differences between these mean values. The difference between these mean values is in most cases not statistically significant. For example, most of our participants (87.8%) are male with a slightly higher percentage relative to the percentage of males in the initial Pitchbook population (85.8%). Minor differences exist with regard to the respondents' position in the company. In the initial population, 49.3% were partners or CEOs (51.8% in the final sample), 22.8% (19.6%) were directors or principals, 14.9% (16.5%) were investment managers, and 12.4% (12.0%) worked as analysts. 2The fractions obtained from Pitchbook are slightly biased downwards because 23.9% of the investors are coded as “multiple investor types”. In our survey, these individuals assigned themselves to the type that fit best. For example, the full population in Pitchbook contained 52.2% VCs, while our sample includes 52.9% VC.
Table 2also reports the geographical distribution, with a general consistency between the initial Pitchbook population and the sample of participants. While 57.1% of the individuals in the population are located in Europe, 60.7% of the final participants are Europeans. The percentage of African investment professionals is significantly higher in our sample as compared to the population. However, they constitute still a small proportion of the final sample (0.9%). We, therefore, conclude that a non-response bias should not influence our results in a major way (e.g.,Graham and Harvey, 2001).
Table 1
Sample selection and representativeness.
This table compares the composition of the population of 15,600 investors in Pitchbook with our sample of 749 participants that took part in our experiment. The initial population was first filtered from Pitchbook by investor type (i.e., funds). Investors needed to be classified as a venture capital fund, corporate venture capital fund, family office, buyout fund, or growth equity fund. As a second requirement, we considered only investors that had done at least one equity deal in the last ten years (as of 2016) that was classified as series A, B, C, D (or later), or expansion. Third, we identified every individual investor (= person) listed in Pitchbook working for these investors and removed those individuals who had missing values with regard to e-mail and/or location. This approach led to the identification of 15,600 individual investors which we invited via email to participate in our research. We sent a total of three reminders letters over five months. In total, we collected 749 responses (response rate = 6.24%). We asked participants about the type of investor they work for (self-se-lection) as Pitchbook's classifications can contain multiple classifications per investor. For example, an investor could be classified as a VC and FO simultaneously.
Panel A: Pitchbook population
Investor type N (%)
Venture capital fund 8149 (52.2%)
Private equity companies 3214 (20.6%)
Family office 503 (3.2%)
Multiple investor types 3734 (23.9%)
Total 15,600 (100%)
Panel B: Our sample of participants
Investor type N (%)
Venture capital fund 396 (52.9%)
Growth equity fund 189 (25.2%)
Leveraged buyout fund 85 (11.3%)
Family office 59 (7.9%)
Business angel 20 (2.7%)
Total 749 (100%)
Table 2
Assessment of a potential non-response bias.
To assess whether a non-response bias potentially influences our results, we compare our initial sample (N = 15,600) to our final sample (N = 749) along with several characteristics that were recorded in Pitchbook. The first column reports the mean values of the initial population. The second column reports the mean values of our final sample. The final column reports the difference between the mean values along with the significance of z-tests for proportions. Significant values indicate statistically significant differences. * < 0.10, ** p < 0.05, *** p < 0.01.
Variable (1) Initial population (N = 15,600) (2) Final sample (N = 749) (1) vs. (2)
Gender Male 0.858 0.878 0.020 Position in company Partner or CEO 0.493 0.518 0.025 Director or principal 0.228 0.196 −0.032* Investment manager 0.149 0.165 0.016 Analyst 0.124 0.120 −0.004
Location of investment company
Europe 0.571 0.607 0.036* Asia 0.079 0.098 0.019* Africa 0.004 0.009 0.005*** North America 0.280 0.246 −0.034* South America 0.033 0.020 −0.013* Oceania 0.031 0.018 −0.013*
We assess a potential late-response bias, which is present if early participants in the experiment show significantly different characteristics and behavior than late participants (Graham and Harvey, 2001). To assess this bias, we split the final sample into early participants (first half of the respondents, N = 375) and late participants (second half of the respondents, N = 374) and compare their mean values with regard to individual characteristics using at-test. The results are reported inTable 3. For example, the results show that 85.5% of the early participants were male, while 90.3% of the late participants were male. This indicates that females were slightly under-represented among late respondents. Also, early participants were slightly more experienced than late respondents. No significant differences exist with regard to the variables age, tenure, education, entrepreneurial experience, position in the company, or work experience. Thus, the results indicate that no major differences exist between early and late participants.
As in all studies, external validity might be a concern. Fortunately, previous research provides considerable evidence for the external validity of conjoint studies (e.g.Louviere, 1988;Shepherd and Zacharakis, 2018). These studies generally show that the estimated decision behavior with conjoint experiments strongly correlates with real observed behavior.Shepherd and Zacharakis
(2018)recommend that conjoint tasks should be representative of the participant's real tasks in order to ensure external validity. To
ensure this, we conducted a pretest with experienced PE investors, who confirmed that our selection of attributes and attribute levels is an appropriate portrayal of their actual investment decisions.
Among the different types of investors, FOs might be particularly prone to concerns of external validity, as they have received scant attention in previous research. To assess the external validity of our sample of FOs, we refer to theGlobal Family Office Report
(2018), which is one of the most established surveys on FOs to date. TheGlobal Family Office Report (2018)provides information
based on a sample of 311 FOs that can be used as a reference point for our sample. TheGlobal Family Office Report (2018)shows that the most prevalent stages in which FOs invest (PE funds and direct investments) are growth stages (72%) and venture stages (57%). These values are similar to our sample, in which 73% of the FOs indicate to invest in growth stages and 66% in early stages. A distinguishing feature is that FOs, compared to the other investor types in our sample, are smaller with regard to assets under management. This is somewhat surprising as reports frequently describe FOs as extremely wealthy investors, whose assets under management revolve around 1,000 $m on average (e.g.,Economist, 2018). The GFOR similarly reports a mean value of 808 $m, while most of the FOs in our sample report assets under management between 100 and 250 $m. However, these reports also acknowledge a large variety across FOs. Unfortunately, the distribution of assets under management is not reported in the GFOR so that it is difficult to conclude whether our sample is biased downwards. With regard to syndication, the GFOR indicates that FOs tend to make co-investments instead of investing alone. Similar, FOs in our sample express a strong preference for syndication. Finally, the GFOR indicates that 38% of the FOs are headquartered in Europe, 34% in North America, 28% in the rest of the world. This indicates that European FOs are overrepresented in our sample, constituting 60% of the participants (25% North America, 15% rest of the world).
2.2. Descriptive statistics
Each participant in the experiment was asked to fill out a questionnaire with questions on characteristics of the investment entity in which they work, characteristics of the portfolio companies, and their individual characteristics. The following subsections provide a descriptive overview of the sample and highlight the particularities of each investor type. First,Table 4provides the definition of the variables and descriptive statistics for the full sample. The average investment professional in our sample manages between 100 and 250 $m with a target internal rate of return between 10% and 20%. About one fourth of the participants invest alone, about one half invest with one or more other investors, while the remaining one fourth is indifferent to syndication. Most of the participants in Table 3
Assessment of a potential late-response bias.
To assess whether a late-response bias potentially influences our results, we compare the first half of our participants (N = 375) to the second half of our respondents (N = 374) along individual characteristics. The first column reports the mean values of the first half of the respondents. The second column reports the mean values of the second half of the participants. The final column reports the difference between the mean values along with the significance of t-tests. Significant values indicate statistically significant differences. All variables are defined inTable 4. * < 0.10, ** p < 0.05, *** p < 0.01.
Variable (1) First half (N = 375) (2) Second half (N = 374) (1) vs. (2)
Gender 0.858 0.903 −0.045* Age 3.333 3.211 0.122 Experience as investor 11.690 10.470 1.220* Tenure 7.152 6.796 0.355 Education: law 0.058 0.061 −0.002 Education: business/economics 0.776 0.794 −0.018
Education: natural sciences 0.114 0.098 0.015
Education: engineering 0.250 0.221 0.028
Entrepreneurial experience 0.512 0.502 0.009
Position in the company 1.850 1.925 −0.074
Work experience: startups/SMEs 0.245 0.288 −0.043
Work experience: large companies and startups/SMEs 0.389 0.382 0.006
Table 4 Descriptive statistics and definition of the variables. This table provides an overview of the full sample used in our analysis and displays descriptive statistics along with variable definitions. Panel A describes variables related to characteristics of the investment entity. Panel B describes variables related to characteristics of the portfolio companies. Panel C describes variables related to individual-level variables of the participants. The sample comprises 749 participants. Panel A: Characteristics of the investment entity Variable Mean S.D. Min. Max. Description Assets under management 3.96 1.50 1 6 Investor's assets under management in $m (categorical; 1 ≤ 10, 2 = 10–25; 3 = 26–100; 4 = 101–250; 5 = 251–1000, 6 ≥ 1000) Internal rate of return 3.73 0.99 1 6 Investor's internal rate of return in % (categorical; 1 ≤ 0, 2 = 1–10, 3 = 11–20, 4 = 21–30, 5 = 31–40, 6 ≥ 40) Cash-on-cash multiple < 1× 0.21 0.21 0 1 Investor's cash-cash-multiple: percentage of deals that returned invested capital < 1× Cash-on-cash multiple 1×–2× 0.27 0.21 0 1 Investor's cash-cash-multiple: percentage of deals that returned invested capital 1×–2× Cash-on-cash multiple 2×–5× 0.36 0.25 0 1 Investor's cash-cash-multiple: percentage of deals that returned invested capital 2×–5× Cash-on-cash multiple 5×–10× 0.11 0.13 0 1 Investor's cash-cash-multiple: percentage of deals that returned invested capital 5×–10× Cash-on-cash multiple > 10× 0.05 0.08 0 50 Investor's cash-cash-multiple: percentage of deals that returned invested capital > 10× Syndication: invest alone 0.24 – 0 1 Syndication: Investor prefers to invest alone (dummy; 1 = yes, 0 = no) Syndication: with one other investor 0.28 – 0 1 Syndication: Investor prefers to invest together with one other investor (dummy; 1 = yes, 0 = no) Syndication: with multiple other investors 0.24 – 0 1 Syndication: Investor prefers to invest together with multiple other investors (dummy; 1 = yes, 0 = no) Syndication: indifferent 0.24 – 0 1 Syndication: Investor is indifferent with regard to syndication (dummy; 1 = yes, 0 = no) (dummy; 1 = yes, 0 = no) Location: Europe 0.61 – 0 1 Investor's headquarter is located in Europe (dummy; 1 = yes, 0 = no) Location: North America 0.25 – 0 1 Investor's headquarter is located in North America (dummy; 1 = yes, 0 = no) Location: Rest of the world 0.14 – 0 1 Investor's headquarter is located in the rest of the world (i.e., not in Europe or North America) (dummy; 1 = yes, 0 = no) Company size 2.93 0.86 1 4 Number of investment professionals working for the investor (categorical; 1 = 1; 2 = 2–5, 3 = 6–10; 4 ≥ 10) Panel B: Characteristics of portfolio companies Variable Mean S.D. Min. Max. Description Seed-stage 0.32 – 0 1 Investor invests in portfolio companies in the seed-stage (dummy; 1 = yes, 0 = no) Early-stage 0.58 – 0 1 Investor invests in portfolio companies in the early-stage (dummy; 1 = yes, 0 = no) Growth‐/expansion-stage 0.62 – 0 1 Investor invests in portfolio companies in the growth−/expansion-stage (dummy; 1 = yes, 0 = no) Later-stage 0.24 – 0 1 Investor invests in portfolio companies in later stages (dummy; 1 = yes, 0 = no) Industry: Software and services 0.67 – 0 1 Investor invests in portfolio companies in software and services (dummy; 1 = yes, 0 = no) Industry: IT infrastructure/systems 0.40 – 0 1 Investor invests in portfolio companies in IT infrastructure/systems (dummy; 1 = yes, 0 = no) Industry: Financial services 0.34 – 0 1 Investor invests in portfolio companies in financial services (dummy; 1 = yes, 0 = no) Industry: E-Commerce 0.36 – 0 1 Investor invests in portfolio companies in e-commerce (dummy; 1 = yes, 0 = no) Industry: Biotechnology and healthcare 0.37 – 0 1 Investor invests in portfolio companies in biotechnology and healthcare (dummy; 1 = yes, 0 = no) Industry: Media and entertainment 0.28 – 0 1 Investor invests in portfolio companies in media and entertainment (dummy; 1 = yes, 0 = no) ( continued on next page )
Table 4 ( continued ) Panel B: Characteristics of portfolio companies Variable Mean S.D. Min. Max. Description Industry: Consumer products and services 0.42 – 0 1 Investor invests in portfolio companies in consumer products and services (dummy; 1 = yes, 0 = no) Industry: Industrials and industrial technology 0.40 – 0 1 Investor invests in portfolio companies in industrials and industrial technology (dummy; 1 = yes, 0 = no) Industry: Energy 0.18 – 0 1 Investor invests in portfolio companies in energy (dummy; 1 = yes, 0 = no) Industry: Other 0.08 – 0 1 Investor invests in portfolio companies in other industries than above (dummy; 1 = yes, 0 = no) Location: Europe 0.72 – 0 1 Investor invests in portfolio companies located in Europe (dummy; 1 = yes, 0 = no) Location: North America 0.43 – 0 1 Investor invests in portfolio companies located in North America (dummy; 1 = yes, 0 = no) Location: Rest of the world 0.34 – 0 1 Investor invests in portfolio companies located in the rest of the world (i.e., not in Europe or North America) (dummy; 1 = yes, 0 = no) Panel C: Characteristics of the individual investor Variable Mean S.D. Min. Max. Description Gender 0.88 – 0 1 Participant's gender (dummy; 1 = male, 0 = female) Age 3.27 1.16 1 6 Participant's age (categorical; 1 = < 25, 2 = 25–34, 3 = 35–44, 4 = 45–54, 5 = 55–64, 6 > 64) Experience as investor 11.08 8.25 1 48 Participant's years of experience as an investor (number of years) Tenure 6.99 6.38 1 40 Participant's tenure with their current investor (number of years) Education: law 0.06 – 0 1 Participant has an educational background in law (dummy; 1 = yes, 0 = no) Education: business/economics 0.79 – 0 1 Participant has an educational background in business or economics (dummy; 1 = yes, 0 = no) Education: natural sciences 0.11 – 0 1 Participant has an educational background in natural science (dummy; 1 = yes, 0 = no) Education: engineering 0.24 – 0 1 Participant has an educational background in engineering (dummy; 1 = yes, 0 = no) Entrepreneurial experience 0.51 – 0 1 Participant has experience as an entrepreneur (dummy; 1 = yes, 0 = no) Position in the company 1.89 1.07 1 4 Participant's current position (categorical; 1 = general partner or CxO, 2 = director or principal; 3 = investment manager, 4 = analyst) Work experience: startups/SMEs 0.27 – 0 1 Individual has work experience mostly in startups/SMEs (dummy; 1 = yes; 0 = no) Work experience: large companies and startups/SMEs 0.39 – 0 1 Individual has work experience mostly in large companies and startups/SMEs (dummy; 1 = yes; 0 = no) Work experience: large companies 0.35 – 0 1 Individual has work experience mostly in large companies (dummy; 1 = yes; 0 = no)
Table 5 Descriptive statistics across different types of investors. This table outlines differences in the mean values across the different investor types included in our sample. While the first column depicts the mean values of the full sample (N = 749 individuals), the following columns refer to family offices (FOs), business angels (BAs), venture capital funds (VCs), growth equity funds (GEFs), and leveraged buyout funds (LBOs). Panel A outlines differences across variables related to characteristics of the investment entity. Panel B outlines differences across variables related to characteristics of the portfolio companies, while panel C outlines differences across variables related to individual-level variables of the participants. The signs in brackets (+/−) indicate whether the respective mean value is significantly larger (+) or smaller (−) than the mean value of the remaining sample. A t-test is used to calculate the significance for each individual mean value. The final column reports the significance level obtained from an analysis of variance (ANOVA), indicating statistically significant differences across groups. All variables are defined in Table 2 .* < 0.10, ** p < 0.05, *** p < 0.01. Panel A: Characteristics of the investment entity Variable Full sample (N = 749) FOs (N = 59) BAs (N = 20) VCs (N = 396) GEFs (N = 189) LBFs (N = 85) ANOVA Assets under management 3.96 3.54 (−) 1.60 (−) 3.63 (−) 4.54 (+) 5.02 (+) *** Internal rate of return 3.73 3.68 4.00 3.74 3.73 3.68 Cash-on-cash multiple < 1× 0.21 0.22 0.25 0.28 (+) 0.12 (−) 0.08 (−) *** Cash-on-cash multiple 1×–2× 0.27 0.26 0.26 0.26 0.27 0.33 (+) Cash-on-cash multiple 2×–5× 0.36 0.33 0.26 0.28 (−) 0.48 (+) 0.52 (+) *** Cash-on-cash multiple 5×–10× 0.11 0.13 0.14 0.13 (+) 0.10 0.05 (−) *** Cash-on-cash multiple > 10× 0.05 0.06 0.08 (+) 0.06 (+) 0.03 (−) 0.01 (−) *** Syndication: invest alone 0.24 0.15 0.10 0.07 (−) 0.45 (+) 0.67 (+) *** Syndication: with one other investor 0.28 0.25 0.25 0.34 (+) 0.20 (−) 0.18 (−) *** Syndication: with multiple other investors 0.24 0.27 0.45 (+) 0.34 (+) 0.10 (−) 0.06 (−) *** Syndication: indifferent 0.24 0.32 0.20 0.25 0.25 0.09 (−) *** Location: Europe 0.60 0.66 0.55 0.60 0.52 (−) 0.76 (+) *** Location: North American 0.25 0.20 0.20 0.23 0.30 (+) 0.20 Location: Rest of the world 0.15 0.15 0.25 0.17 0.17 0.04 (−) ** Company size 2.93 2.42 (−) 1.90 (−) 2.78 3.23 (+) 3.53 (+) *** Panel B: Characteristics of portfolio companies Variable Full sample (N = 749) FOs (N = 59) BAs (N = 20) VCs (N = 396) GEFs (N = 189) LBFs (N = 85) ANOVA Seed-stage 0.32 0.31 0.70 (+) 0.50 (+) 0.04 (−) 0.00 (−) *** Early-stage 0.58 0.66 0.65 0.85 (+) 0.24 (−) 0.04 (−) *** Growth‐/expansion-stage 0.62 0.73 0.25 (−) 0.47 (−) 0.91 (+) 0.68 *** Later-stage 0.24 0.25 0.00 (−) 0.09 (−) 0.39 (+) 0.71 (+) *** Industry: Software and services 0.67 0.63 0.70 0.74 (+) 0.60 (−) 0.56 (−) *** Industry: IT infrastructure/systems 0.40 0.24 (−) 0.35 0.43 (+) 0.36 0.46 *** Industry: Financial services 0.34 0.44 0.15 0.34 0.38 0.25 ** Industry: E-Commerce 0.36 0.34 0.50 0.39 (+) 0.31 0.31 ** Industry: Biotechnology and healthcare 0.37 0.37 0.35 0.38 0.36 0.35 ( continued on next page )
Table 5 ( continued ) Panel B: Characteristics of portfolio companies Variable Full sample (N = 749) FOs (N = 59) BAs (N = 20) VCs (N = 396) GEFs (N = 189) LBFs (N = 85) ANOVA Industry: Media and entertainment 0.28 0.29 0.25 0.28 0.24 0.32 Industry: Consumer products and services 0.42 0.53 0.30 0.32 (−) 0.48 (+) 0.71 (+) *** Industry: Industrials and ind. technology 0.40 0.51 0.20 0.32 (−) 0.42 0.72 (+) *** Industry: Energy 0.18 0.22 0.10 0.17 0.18 0.21 Industry: Other 0.08 0.08 0.05 0.07 (−) 0.12 (+) 0.08 Location: Europe 0.72 0.75 0.55 0.69 (−) 0.69 0.93 (+) *** Location: North American 0.43 0.49 0.45 0.46 0.43 0.27 (−) *** Location: Rest of the world 0.34 0.36 0.35 0.37 0.37 0.16 (−) *** Panel C: Characteristics of the individual investment professional Variable Full sample (N = 749) FOs (N = 59) BAs (N = 20) VCs (N = 396) GEFs (N = 189) LBFs (N = 85) ANOVA Gender 0.88 0.90 0.85 0.87 0.90 0.89 Age 3.27 3.44 3.85 (+) 3.27 3.23 3.16 Experience as investor 11.08 13.47 (+) 13.05 10.03 (−) 11.59 12.76 *** Tenure 6.99 8.17 6.70 6.75 6.89 7.54 (+) Education: law 0.06 0.10 0.00 0.05 0.07 0.06 Education: business/economics 0.79 0.86 0.75 0.73 (−) 0.85 (+) 0.86 *** Education: natural science 0.11 0.08 0.05 0.15 (+) 0.06 (−) 0.04 (−) *** Education: engineering 0.24 0.17 0.20 0.29 (+) 0.21 0.11 (−) *** Entrepreneurial experience 0.51 0.51 0.90 (+) 0.56 (+) 0.41 (−) 0.39 (−) *** Position in the company 3.11 3.12 3.70 (+) 3.16 2.94 (−) 3.12 ** Work experience: startups/SMEs 0.27 0.39 (+) 0.45 0.31 (+) 0.19 (−) 0.13 (−) *** Work experience: large companies and startups/SMEs 0.39 0.24 (−) 0.35 0.38 0.47 (+) 0.34 *** Work experience: large companies 0.35 0.37 0.20 0.31 (−) 0.34 0.53 (+) ***
the experiment are based in Europe. Coherently, most of the investment companies in which they invest are European. The main industry of their portfolio companies is software and services. The average investment professional is male (88%), between 35 and 45 years old with 11 years of experience as investor. The educational background of most participants (79%) is business and eco-nomics.
Table 5provides an initial comparison of the investor types using the variables described inTable 4. Specifically,Table 5outlines
the differences in the mean values across the different investor types included in our sample. While the first column depicts the mean values of the full sample (N = 749 participants), the following columns refer to the respective investor types. The signs in brackets (+/−) indicate whether the respective mean value is significantly larger (+) or smaller (−) than the mean value of the remaining sample. At-test indicates whether the respective mean value differs from the mean value of the remaining sample. The final column reports the significance levels obtained from an analysis of variance (ANOVA), indicating statistically significant differences across the different investor groups. The results for each investor type are described in detail in the following subsections.
2.2.1. Family offices (FOs)
Our sample includes 59 FOs. Overall,Table 5illustrates that the FOs in our sample do not have many characteristics in which they significantly differ from the other investor types in our sample, making a nuanced profiling difficult. For example, the results show that FOs invest in portfolio companies of all stages: 31% of the sampled FOs invest in seed-stage portfolio companies, 66% in early-stage, 73% in growth−/expansion-early-stage, and 25% in later-stage portfolio companies. Further information on FO's investment portfolios is provided in the GFOR, which outlines that direct equity investments (in developed and developing markets) make up 28.0% of FO's portfolio and outlines that 50% of FOs intend to invest more in PE direct investments in the future.
A distinguishing feature is that FOs, compared to the other investor types in our sample, are smaller with regard to assets under management and company size as measured by their number of investment professionals. This is somewhat surprising: While em-pirical academic research on FOs is virtually non-existent, practice-oriented reports frequently describe FOs as extremely wealthy investors, whose assets under management revolve around 1,000 $m on average (e.g.,Economist, 2018). However, these reports also acknowledge a large variety across FOs.
Another distinguishing characteristic is that FOs' investment professionals tend to have more experience than those working for other investors, as they have, on average, worked as an investment professional for 13.5 years. Also, investment professionals from FOs have a comparatively high degree of work experience from working in startups or small and medium enterprises (SMEs). However, these investment professionals are not necessarily founders themselves as their own entrepreneurial experience is not significantly different from the remaining sample.
2.2.2. Business angels (BAs)
Our sample comprises 20 BAs, which is the least prevalent group of participants. BAs represent the smallest investor type with regard to assets under management and company size. This is due to the fact that BAs are often individual investors that invest their own money and frequently make smaller investments than other investor types (Lerner, 1998;Hellmann and Thiele, 2015). Also, our data reflects that BAs tend to invest in very early-stage companies: 70% of the sampled BAs invest in the seed stage, which is the highest value among all investor types. Simultaneously, BAs are less likely to invest in growth- or later-stage companies when compared with the other investor types (Hellmann and Thiele, 2015). Investing in very early stages involves a comparatively high degree of uncertainty. One way to reduce this uncertainty and to mitigate investment risk is to engage in syndication (Block et al.,
2019; Lerner, 1994). Compared to other participants, the sampled BAs have a strong preference to engage in syndication with
multiple other investors, which is in line with prior research (e.g.,Block et al., 2019;Manigart et al., 2006). Also, investing in very early stages can lead to potentially large payoffs, in a high-risk high-reward fashion. This risky investment strategy corresponds to the fact that BAs report to have achieved a significantly higher share of investments with cash-on-cash multiples larger than factor 10. With regard to individual characteristics, BAs are older than investment professionals in other investor types and more often have entrepreneurial experience. Again, these findings are in line with previous research which regularly describes BAs as experienced individuals that often possess substantial entrepreneurship experience (e.g.,Collewaert and Manigart, 2016). Often, previous en-trepreneurial activities are one of the sources of BAs funds.
2.2.3. Venture capital funds (VCs)
VCs represent the largest group of investors in our sample (N = 396). While VCs are larger than FOs and BAs with regard to assets under management and company size, they are significantly smaller than GEFs and LBOs. This is in line with prior research by
Gompers et al. (2016a), who point out that GEFs and LBOs are typically larger than VCs. Also, prior research indicates that VCs are
very risk-prone, which is reflected in (potentially) large and volatile returns (e.g.,Cochrane, 2005). This is reflected in our descriptive statistics: While VCs have a significantly higher share of investments that achieve low cash-on-cash multiples than the other investor types, they also report a significantly higher share of investments with very high cash multiples.
Our descriptive statistics confirm that VCs prefer to invest more in early stages and less in later stages than other investor types. For example, 85% of the participants indicated that they invest in early-stage companies while only 9% indicated that they (also) invest in later-stage companies. However, VCs do not have a preference for seed-stage investments that is as pronounced as for BAs. Like BAs, VCs have a general preference for syndication with one or multiple investors. Again, syndication is frequently used as a strategy to mitigate risk, especially in early-stage investments that contain a high degree of uncertainty (Gompers et al., 2016a).
With regard to individual characteristics of the investment professionals, participants working for VCs had less experience working as investors, less often had a business education, and more often had a background in natural sciences or engineering as
compared to the remaining sample. Also, participants working for VCs reported high levels of entrepreneurial experience (second only to BAs) and a high amount of work experience from startups or SMEs instead of large companies.
2.2.4. Growth equity funds (GEFs)
Our sample contains 189 participants from GEFs. With regard to both assets under management and number of investments professionals, GEFs are significantly larger than FOs, BAs, and VCs. This is in line with prior research byGompers et al. (2016a)and
Ritter (2015), who state that GEFs tend to be larger than most VCs but usually smaller than LBOs. GEFs constitute an investor type
that is particularly crucial in later-stage financing (Gompers et al., 2016a;Ritter, 2015). This is reflected in our descriptive statistics, which show that a significantly higher fraction of GEFs invests in later stages as compared to other investors. In particular, 91% stated that they invest in growth‐/expansion-stage portfolio companies.
Later-stage investments generally entail a lower investment risk (Gompers et al., 2016a;Ritter, 2015). This is because, at that stage, companies typically have a functioning product and business model and have experienced initial market success. Moreover, company performance measures are more readily available and can be used as investment criteria. The lower investment risk in later-stage deals corresponds to less volatility in investment returns (Cochrane, 2005). In contrast to other PE investors, GEFs achieve a significantly smaller fraction of investments with low cash-on-cash multiples and a significantly higher ratio of cash multiples be-tween 2 and 5 (48% of their investments). Also, since syndication is a means to reduce investment risk, GEFs tend to engage less in syndication and more often invest alone as compared to the other investor types.
GEFs primarily invest in growth- and expansion-stage companies. This specialization is also reflected in individual-level statistics. For example, own entrepreneurial experience of the investment professional may be less important when investing in later-stage companies compared to investing in early-stage ventures. Compared to the early-stage investor types in our sample, individuals working in GEFs indeed have less often own entrepreneurial experience and work experience from working in startups or SMEs versus work experience from large companies. Finally, they more often have a business education, which may be useful when it comes to scaling instead of developing business models.
2.2.5. Leveraged buyout funds (LBOs)
Our sample contains 85 participants from LBOs, which represent the largest investor type in terms of assets under management and number of investment professionals. This is in line with prior research, which frequently highlights LBOs as an important asset class being substantially larger than other types of PE investors (Kaplan and Schoar, 2005;Metrick and Yasuda, 2010).
Typically, LBOs invest in mature companies. This is different from investors like VCs and BAs, which typically invest in young or emerging companies (e.g.,Kaplan and Strömberg, 2009;Metrick and Yasuda, 2010). Indeed, our descriptive statistics show that the share of seed- and early-stage investments is significantly smaller with LBOs than with other investor types, whereas the fraction of investments in later-stage companies is significantly larger. For investments in mature companies investment uncertainty is lower. Our results reflect this, as LBOs tend to engage in syndication less often than other investors; 67% of LBOs prefer to invest alone. The lower likelihood of syndication may also be related to LBO's large size, which makes syndication less necessary in order to raise large funding volumes.Cochrane (2005)finds that later-stage deals have less volatility than early-stage deals with regard to returns. This is reflected in LBOs' investment success: With regard to cash-on-cash multiples, LBOs have significantly lower ratios of very low and very high multiples and report significantly more often multiples of average size. 85% of their investments achieve multiples between 1 and 5.
Finally, prior studies acknowledge that LBOs create value through significant managerial improvements (Kaplan and Strömberg,
2009;Rigamonti et al., 2016). However, more mature companies already possess management skills so that LBOs are required to
provide a different set of supporting activities than VCs do.Metrick and Yasuda (2010)find that LBO investors build on their prior experience by increasing the size of their funds faster than VCs do. They also describe that LBO investors add value to extremely large companies, whereas VC'scan add value primarily to small companies. This has implications for individuals working for LBOs. As reflected in our descriptive statistics, individual's working for LBOs have less entrepreneurial experience and have more often gained work experience in larger companies as compared to individuals working for other investor types. This set of experiences makes them well suited to developing large companies.
2.3. Experimental design of the conjoint analysis
As the main part of our study, we conduct an experimental conjoint analysis to elicit the decision-making behavior of PE investors. This technique requires participants to make a series of assessments based on a fixed set of attributes. With this approach, decision criteria can be measured conjointly in a multivariate way, allowing a more accurate representation of the actual decision behavior and the underlying preference structure. This approach is frequently used in the context of investor decision-making due to the limitations of post hoc approaches such as questionnaires and interviews (e.g.,Shepherd and Zacharakis, 1999). For example, in-formation is collected as the decision is being made, whereas post-hoc methods collect data about a decision after the decision has been made. Therefore, conjoint studies overcome limitations that affect post hoc approaches, such as a self-reporting or recall bias. Relatedly, conjoint experiments come closer to the investor's actual decision-making scenario. Usually, PE investors assess companies holistically and evaluate multiple criteria simultaneously. This involves making trade-offs between different criteria. These tradeoffs can be captured with conjoint approaches. Recently,Bernstein et al. (2017)used a similar experimental approach to assess the importance of startup characteristics to investors in early-stage companies. In contrast toBernstein et al. (2017), we are particularly interested in how the importance of investment criteria varies across different investor types.
We use a choice-based conjoint analysis (CBC) in which objects (here: companies) that consist of several attributes (here: revenue growth, profitability, reputation of current investors, etc.) are evaluated by participants (here: investment professionals). Participants are asked to make a deterministic investment decision between several hypothetical portfolio companies that differ only in the specifications of the company attributes (e.g., 20% revenue growth for company 1 versus 50% revenue growth for company 2). Before asking the participants to make a series of decisions on such hypothetical entrepreneurial companies, participants were provided with information on the study and the decision tasks that they were going to face. An important advantage of our experimental setting is that we were able to provide respondents with a very detailed description of the (hypothetical) companies they were going to assess in the conjoint experiment. To ensure that the participants in our experiment were thinking about similar (or the same) company when making their investment decision, we included an introductory slide outlining our understanding of the hypothetical com-panies. They were told that they would be confronted with two different companies that are in a stage of early growth or expansion and we clarified that companies have market traction, a validated business model, multiple paying customers, growth in sales and customers, and multiple employees. To avoid conflicts with the generic screening criteria of investors, the presented companies were said to match the geographical, industrial and investment size preferences of the participants (Franke et al., 2008).
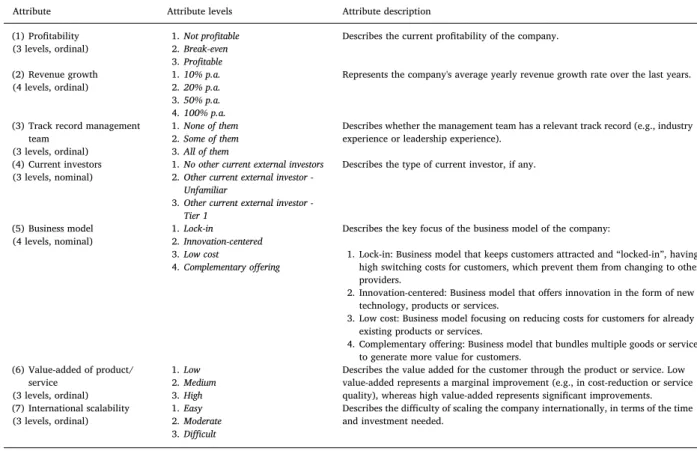
To identify a list of typical screening criteria used by PE investors, we proceeded in two steps. First, we derived a list of possible criteria from prior research (e.g.,Bernstein et al., 2017;Franke et al., 2008;Puri and Zarutskie, 2012). Second, we conducted 19 expert interviews with PE investors from Europe and the US to identify the most relevant criteria used by different investor types. These experts represent several investor types (e.g., VCs, FOs, GEFs). The interviews were transcribed and coded by two researchers to identify the most relevant criteria, which formed the basis of the conjoint study.3Based on this procedure, we derived a list of company attributes and attribute levels. The identified attributes are (1) profitability, (2) revenue growth, (3) track record of the management team, (4) reputation of current investors, (5) business model, (6) value-added of product/service, and (7) international scalability. These attributes or investment criteria are in line with and extend criteria mentioned in previous research, such as
Bernstein et al. (2017). Our business model measure is based on the work ofAmit and Zott (2001).Table 6provides a detailed
description of our operationalization of these criteria as well as their respective levels. In addition to the attributes,Table 6also outlines the respective attribute levels and their descriptions. For example, the attribute “revenue growth” comprised the attribute levels “10% p.a.”, “20% p.a.”, “50% p.a.”, and “100% p.a”. All descriptions outlined inTable 6were also shown to the participants in our conjoint experiment.
Since PE investors assess potential investments holistically, we employ a full-profile CBC, which means that all attributes from
Table 6are presented to investors at once. CBC is used in conjunction with a reduced conjoint design (Chrzan and Orme, 2000), as
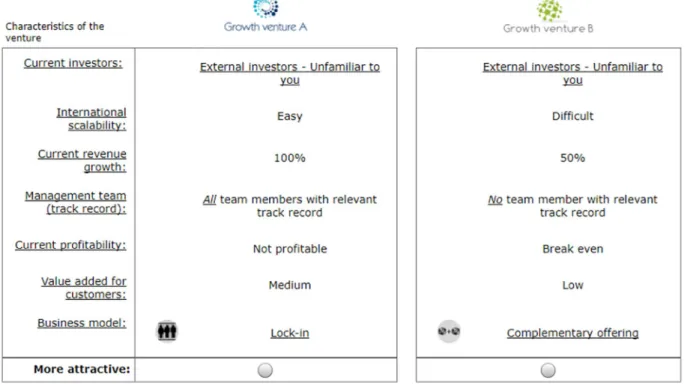
participants would be exposed to too many decision tasks if combinations between all possible variations of attribute levels were presented. Furthermore, the experimental design is asymmetric because the number of attribute levels across attributes is not equal.4 We created 800 different experimental designs, with each presenting a different sequence of choice tasks with different combinations of attribute levels. Each design consists of the 7 attributes outlined inTable 6whose levels were randomly assigned to two investment opportunities. Each participant was asked to select one of the two alternatives in 15 choice tasks. While 13 of these tasks were randomly assigned, 2 were the same for all participants. These “fixed” tasks were used to determine the test-retest reliability of the participants' choices in the study.Fig. 1provides an illustration of a choice task that each participant faced 15 times with varying attribute levels. On average, each choice task took the participants 21 s to complete, which is in line with other research (Johnson and
Orme, 1996).
CBC studies can suffer from three types of order effects (Chrzan, 1994), which we account for: (1) the order of choice tasks, (2) the order of options in a choice task, and (3) the order of attributes within a choice task. To circumvent the effect of the choice task order, we created 800 different experimental designs with the choice tasks within each design being randomly ordered. To avoid the effect of the order of options in a given choice task, the two options within the 800 different experimental designs were randomly ordered within the respective choice tasks. To circumvent the effect of the order of attributes within a choice task, the order presented to participants is randomized across participants but kept stable within one participant. In addition, the participants are randomly allocated to one of the 800 experimental designs. Also, we conducted a pre-test with four experienced investors and four researchers who had previously conducted research on investor decision-making to confirm the face validity of both the attributes as well as the complexity and number of the choice tasks. The two fixed tasks were used to check the test-retest reliability of the participants' choices in the study. By assessing the utilities from the 13 random choice tasks to predict the two fixed choice tasks, a proxy for test-retest reliability can be estimated.5In our study, this method leads to an 80% accuracy of correct classification.
Finally, to explore the importance attached to the different investment criteria, we performed multilevel logistic regression models. The investment decision made by the investment professionals serves as the binary dependent variable (1 if the investor chose the respective portfolio company; 0 if he did not), while the different attribute levels constitute our independent variables. We use a multilevel regression because our observations of investment decisions are nested and effects on multiple levels (particularly cross-level interactions) are evaluated at the same time. Two levels exist within our data: multiple decisions (level one) are nested within each individual (level two) and cannot be viewed as independent from each other.
3We triangulated the findings from the interviews with archival data such as the investor's websites and with informal expert interviews. 4The experimental design is a balanced-overlapping approach with a fractional asymmetric design, which is a frequently employed design strategy for CBC studies (e.g.,Chrzan and Orme, 2000).
5The utility estimates from the 12 random choice task are computed with a hierarchical Bayesian model and then used as covariates in a logit regression on the holdout task choices.
3. Results
In this section, we present the results of our analysis in three steps. First, we show and discuss the relative importance of the different investment criteria. Then, we compare the importance of the decision criteria across investor types. Last, we apply a propensity score methodology as a robustness check.
3.1. Relative importance of investment criteria
Table 7reports the results of the regression analysis. Model 1 uses the full sample while Models 2–6 consider each investor type
separately. The coefficients indicate the importance investors attach to each criterion.
Model 1 shows that all included attribute levels significantly influence the decision of the investor (p < 0.001) with the ex-ception of the attribute levelcurrent investors – unfamiliar. Participants were found to be indifferent between the absence of current investors and the presence of current investors that are unfamiliar to them. However, investors significantly favor the presence of reputable investorsover their lack of presence.
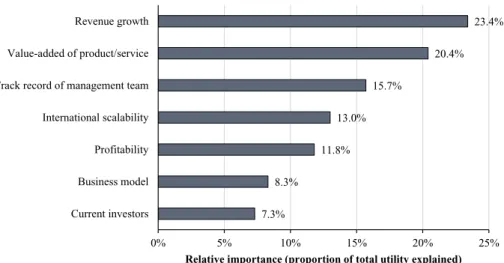
The results displayed inTable 7also indicate which criteria are considered as most important by participants in their investment decisions. The effect sizes of the attribute levels forrevenue growthare particularly high. Companies with a revenue growth rate of 100% p.a. have an odds-ratio (OR) of 4.86, indicating that these companies have a 4.86 times higher chance of a positive screening decision (selection) by an investor relative to companies with a 10% growth rate. Overall,revenue growthis the most important investment criterion for the participants in our sample. The second most important criterion is a highvalue-added of the product/ service(OR of 4.25) and the third most important criterion is thetrack record of the management teamwhere the odds-ratio of all team members having a relevant track record is estimated at 3.27, indicating a 3.27 times higher chance of a positive screening decision of the investors relative to companies with a management team without relevant track record.
To further illustrate the weight attached to each criterion, we estimate the relative importance of each attribute followingFranke
et al. (2008). The values displayed inFig. 2allow an assessment of how strong a change in an attribute's level does affect the total
Table 6
Attributes and attribute levels used in our conjoint analysis.
This table describes and defines the attributes and attribute levels presented to participants in our conjoint analysis. We use a choice-based-conjoint (CBC) analysis, in which the participants are presented with investment opportunities and are asked to select the one company that better matches their preferences. The two companies are only described in terms of the attributes displayed in this table (“attributes”) and only differ from each other in the respective specification of these criteria (“attribute levels”).
Attribute Attribute levels Attribute description
(1) Profitability
(3 levels, ordinal) 1.2.Not profitableBreak-even
3.Profitable
Describes the current profitability of the company. (2) Revenue growth
(4 levels, ordinal) 1.2.10% p.a.20% p.a.
3.50% p.a. 4.100% p.a.
Represents the company's average yearly revenue growth rate over the last years.
(3) Track record management team
(3 levels, ordinal)
1.None of them 2.Some of them 3.All of them
Describes whether the management team has a relevant track record (e.g., industry experience or leadership experience).
(4) Current investors
(3 levels, nominal) 1.2.No other current external investorsOther current external investor
-Unfamiliar
3.Other current external investor -Tier 1
Describes the type of current investor, if any.
(5) Business model
(4 levels, nominal) 1.2.Lock-inInnovation-centered
3.Low cost
4.Complementary offering
Describes the key focus of the business model of the company:
1. Lock-in: Business model that keeps customers attracted and “locked-in”, having high switching costs for customers, which prevent them from changing to other providers.
2. Innovation-centered: Business model that offers innovation in the form of new technology, products or services.
3. Low cost: Business model focusing on reducing costs for customers for already existing products or services.
4. Complementary offering: Business model that bundles multiple goods or services to generate more value for customers.
(6) Value-added of product/ service (3 levels, ordinal) 1.Low 2.Medium 3.High
Describes the value added for the customer through the product or service. Low value-added represents a marginal improvement (e.g., in cost-reduction or service quality), whereas high value-added represents significant improvements. (7) International scalability
(3 levels, ordinal) 1.2.EasyModerate
3.Difficult
Describes the difficulty of scaling the company internationally, in terms of the time and investment needed.
utility of a proposed company. The higher the value, the higher the contribution of the respective attribute to the company's total utility value. To enable a better comparison, the values are normalized so that the sum of all importance values yields 100. Overall, the chance of a positive screening decision is strongly affected by high values in the attributes of (1) revenue growth, (2) value-added of product/service, and (3) management track record; the design of the business model and the type of existing investors are relevant but are of lower importance. The same is true for the ease of scaling the company internationally and profitability.
3.2. Differences across investor types
Table 7also includes a dedicated model for each investor type in which we perform a subsample analysis (Models 2–6). The odds
ratios enable an initial comparison of the investment criteria's importance for each investor type and provide insights on the re-levance of each attribute. For example, the OR of 7.071 for participants from LBOs with regard to profitability is considerably higher than the OR of 2.460 for the whole sample. This indicates that being profitable is a much more important criterion for LBOs than for other investor types. However, a comparison of the ORs does not shed light on whether these differences across investor types are statistically significant.
To address this issue,Table 8estimates separate regressions where the importance of investment criteria for each investor type is tested against the rest of the sample. For example, Model 1 ofTable 8compares the effect of FOs against the combined group of BAs, VCs, GEFs, and LBOs. As such, the coefficients displayed are interaction effects that enable a statement on whether the importance of each criterion differs significantly from the rest of the sample, enabling statements as to where each investor type stands out from the other investors. The following paragraphs refer to the respective models for each investor type.
3.2.1. Investment criteria of family offices (FOs)
Model 1 ofTable 8compares FO's investment criteria to the investment criteria of the other investor types. The results show that FOs differ with regard to the importance attached to profitability and revenue growth. In particular, FOs consider profitability significantly more important than other investor types and attach significantly less importance to high levels of revenue growth. No significant differences emerge regarding the remaining investment criteria.
Fig. 1.Exemplary choice task presented to participants. In this choice task, every participant was asked to select the company that presents a more
attractive investment opportunity for him. Each participant was presented with 15 different choice tasks. While the seven attributes of the com-panies were fixed throughout these choice tasks (e.g., “current investors”, “international scalability”), the attribute levels (e.g., “external investors – unfamiliar to you”, “easy”) were varied across choice tasks in a random manner (we performed a choice-based conjoint analysis with a reduced design). All attributes and attribute levels are described inTable 6.
Table 7 Results of the conjoint analysis: main effects. This table shows the results of a clustered logistic regression with random intercepts and random slopes. The dependent variable is the preference of the decision maker and the independent variables are the attribute levels described in Table 4 .Odds Ratios and standard errors (clustered at the decision maker level) are displayed. Model 1 uses the full sample and shows that all attribute levels significantly influence the decision of the investor (p < 0.001) with the exception of "Current investor: external investors – unfamiliar". The coefficients indicate the importance investors attach to each criterion. For example, the effect sizes of the attribute levels for revenue growth are particularly high. Companies with a revenue growth rate of 100% p.a. have an odds-ratio of 4.86, indicating that these companies have a 4.86 times higher chance of a positive screening decision (selection) by an investor relative to companies with a 10% growth rate. In contrast, the effect sizes for profitability are comparatively low. With an odds ratio of 2.46, profitable companies have a 2.46 higher chance of being selected by a decision maker than unprofitable companies. Models 2–6 consider each investor type separately and enable an initial comparison of the investment criteria's importance for each investor type. We consider family offices (FOs), business angels (BAs), venture capital funds (VCs), growth equity funds (GEFs), and leveraged buyout funds (LBOs). For example, the OR of 7.071 for LBOs with regard to profitability is considerably higher than the OR of 2.460 for the whole sample. This indicates that being profitable is a much more important criterion for LBOs then for other investor types. * < 0.10, ** p < 0.05, *** p < 0.01. Model (1) (2) (3) (4) (5) (6) Sample Full sample FOs BAs VCs GEFs LBOs Variables OR (SE) OR (SE) OR (SE) OR (SE) OR (SE) OR (SE) Profitability: break even 1.764 (0.086)*** 2.311 (0.399)*** 1.118 (0.379) 1.422 (0.090)*** 2.069 (0.203)*** 3.228 (0.500)*** Profitability: profitable 2.460 (0.139)*** 4.213 (0.799)*** 0.954 (0.331) 1.697 (0.116)*** 3.303 (0.403)*** 7.071 (1.218)*** ( reference group: not profitable ) Revenue growth: 20% 1.627 (0.080)*** 1.440 (0.257)** 1.442 (0.425) 1.536 (0.105)*** 1.895 (0.187)*** 1.704 (0.255)*** Revenue growth: 50% 2.924 (0.164)*** 1.805 (0.420)** 2.618 (0.953)*** 3.080 (0.241)*** 3.649 (0.390)*** 2.324 (0.369)*** Revenue growth: 100% 4.863 (0.295)*** 3.331 (0.706)*** 5.150 (2.217)*** 5.743 (0.493)*** 4.909 (0.575)*** 3.347 (0.581)*** (reference group: 10%) Management team: some team members 2.288 (0.110)*** 2.480 (0.437)*** 3.058 (1.043)*** 2.177 (0.142)*** 2.506 (0.251)*** 0.914 (0.122) Management team: all team members 3.268 (0.177)*** 3.095 (0.537)*** 4.401 (1.825)*** 3.325 (0.240)*** 3.898 (0.443)*** 1.117 (0.167) (reference group: no team member) Current investor: ext. investors -unfamiliar 1.038 (0.047) 0.887 (0.144) 0.778 (0.214) 1.042 (0.065) 1.153 (0.110) 2.349 (0.322)*** Current investor: ext. investors -tier 1 1.515 (0.077)*** 1.243 (0.217) 0.990 (0.255) 1.828 (0.127)*** 1.320 (0.143)** 2.178 (0.385)*** (reference group: no external investor) Business model: innovation-centered 1.687 (0.093)*** 2.172 (0.438)*** 1.669 (0.576) 2.079 (0.160)*** 1.279 (0.140)** 1.037 (0.165) Business model: lock-in 1.719 (0.094)*** 1.634 (0.289)*** 0.631 (0.227) 1.964 (0.142)*** 1.576 (0.185)*** 1.685 (0.276)*** Business model: complementary offering 1.271 (0.066)*** 1.427 (0.267)* 0.663 (0.226) 1.354 (0.098)*** 1.230 (0.132)* 1.179 (0.174) (reference group: low cost) Value-added of product/service: medium 2.395 (0.116)*** 2.659 (0.473)*** 1.573 (0.444) 2.526 (0.167)*** 2.054 (0.193)*** 2.924 (0.474)*** Value-added of product/service: high 4.245 (0.233)*** 4.795 (0.929)*** 3.046 (0.776)*** 4.713 (0.374)*** 3.488 (0.357)*** 4.696 (0.767)*** (reference group: low) International scalability: moderate 1.817 (0.083)*** 1.395 (0.229)** 2.178 (0.384)*** 1.833 (0.120)*** 1.827 (0.163)*** 2.133 (0.329)*** International scalability: easy 2.697 (0.138)*** 2.186 (0.411)*** 3.511 (1.214)*** 2.891 (0.204)*** 2.433 (0.239)*** 3.167 (0.518)*** (reference group: difficult) N (decisions) 19,474 1534 520 10,296 4914 2210 N (decision makers) 749 59 20 396 189 85