AAMJAF, Vol. 11, No. 2, 57–82, 2015 of ACCOUNTING and FINANCE
OWNERSHIP STRUCTURE, BOARD STRUCTURE AND
PERFORMANCE IN THE TUNISIAN BANKING INDUSTRY
Khadija Mnasri
Department of Accounting and Finance, High Institute of Management, University of Tunis, Tunisia
E-mail: khadijamnasri2010@gmail.com
ABSTRACT
The 2011 Tunisian revolution has played a role in bringing the corporate governance agenda to the forefront. This political change in Tunisia has revealed persistent governance problems in its banking industry. This paper presents the results of research conducted on how different aspects of corporate governance can influence bank performance. The sample comprises 10 Tunisian commercial banks for the period from 1997 to 2010. The performance-governance relationship is estimated using a range of econometric techniques. The findings reveal strong support for a negative association between blockholder ownership and performance. Our results show that the bank board size is related to directors' ability to monitor and advise management. Additionally, CEO duality is positively associated with performance. Further analysis suggests that the presence of government officials on banks' board of directors decreases bank performance. Taken together, our findings offer recommendations to regulators, especially for the on-going financial reform of corporate boards.
Keywords: endogeneity, commercial banks, corporate governance, agency theory, internal control mechanisms, performance, dynamic panel, GMM estimator
INTRODUCTION
The subprime crisis of 2007–2008 highlighted how little was known about bank governance. Since the crisis, the literature on corporate governance has exploded and revealed how little sound evidence there is on what constitutes a good corporate governance system and what type of management, ownership and board structures can lead to strong bank performance (Yin-Hua, Chung, & Liu, 2011; Peni & Vähämaa, 2012; Sullivan & Spong, 2007; Adams & Mehran, 2012). Countries have responded to these difficulties by enacting laws and regulations aimed at improving governance practices. The implementation of these new rules and procedures, however, has not come without costs to firms and their shareholders. These responses have thus raised the question of whether such changes in governance are reflected in improvements in firm valuation.
Previous empirical research has examined factors that influence the structure of different governance mechanisms, especially internal governance features, as well as the effectiveness of these mechanisms in limiting managers' discretion. Indeed, a growing body of recent studies suggests that there is a trend towards an increase in the relative importance of internal governance compared to the discipline from the market for corporate control. This trend reflects an important change over the past several decades in the means through which the market disciplines corporate behaviour. For more details, see Rose (2009), Bauguess, Moeller, Schlingemann and Zutter. (2009), Robinson (2009), Wruck and Wu (2009), and Pathan, Skully and Wickrama-nayake (2008). Much of this also applies to banks. It is true that banking firms have shown significant differences with respect to corporations in other economic sectors, which justifies special interest in their governance problems (Prowse, 1997; Adams & Mehran, 2012). Small deposits are insured and banks are regulated to avoid bank runs; however, this practice increases the moral hazard problem, as shown in the Savings and Loan crisis in the US. Whether regulation substitutes or complements traditional governance mechanisms and controls is a subject of debate. However, it is generally agreed that the external controls from takeovers and product market competition were weaker in banks than in other firms (Prowse, 1997). Good governance relies more on the workings of internal mechanisms, such as the supervision and the control exercised by the board of directors, along with regulatory constraints. Accordingly, Crespí, Garcia-Cestona and Salas (2004) argued that the internal governance mechanism via the board of directors works well for banks subject to regulatory constraints. Except in strong market-based economies, such as the US and the UK, external governance mechanisms such as mergers and takeover markets may not exert effective control and monitoring of corporate firms; this is particularly true for banks. Therefore, internal governance mechanisms should be closely related to bank performance.
Limited to emerging markets, much of the bank corporate governance research narrowly focuses on either the broad relationship between ownership and financial performance (e.g., Sarkar, Sarkar, & Bhaumik, 1998) or the agency aspect of ownership, i.e., the impact of the separation between management and ownership on the performance of banks (e.g., Gorton & Schmid, 1999; Hirshey, 1999). The focus on the relationship between ownership and the financial performance of banks in emerging markets stems from concerns about both the possibility of inefficient allocation of scarce financial resources in the presence of dominant public sector banks and the possible fiscal impact of the banking sector's fragility in an environment where directed credit, political patronage and severe moral hazard on the part of the public sector's bank officials can lead to the significant accumulation of non-performing assets (NPAs)1.
In this paper, the view that useful insights are adopted into the extent of the resolution of the shareholder-manager conflict are obtained by examining multiple control mechanisms. The focus is very much related to the internal workings of banks. Therefore, the impact of ownership and board structures on the performance of the banking industry in Tunisia has been investigated to better understand the structure of Tunisian bank governance and on identifying implications for future research.
TUNISIAN CORPORATE GOVERNANCE GUIDELINES
The corporate governance codes and principles in Tunisia, which was the first Mediterranean country to sign an Association Agreement with the European Union and to enter a free trade area has been reviewed to provide background for the investigation. Tunisia established several reforms of its financial system during the 1990s in order to respond to the technological and economic mutations the country experienced. Three management systems were invoked: the market-oriented system (the Anglo-Saxon model), the network-market-oriented system (the German Nippon model) and the intermediary system (the French-Italian model). The management system adopted by Tunisia was an intermediary system, which is a combination of the Anglo-Saxon model and the French-Italian model. This system was introduced in the new Commercial code in November 2000, which was promulgated according to the law 2000-93 of 3 November 2000. The fundamental principles of this code are protection of shareholders' rights, the equitable treatment of shareholders, and the transparency and diffusion of information.
Since its implementation, the Commercial code has undergone major amendments. It now includes more protections for minority shareholders and requires greater disclosure of financial information. Despite these successive institutional reforms, corporate governance practices in Tunisia remain less than mature. Even though the lack of international exposure has resulted in a limited impact of the global financial crisis on the Tunisian corporate sector, it is a key factor behind the under-developed corporate governance practices in Tunisia. Most companies in Tunisia are involved in significant related-party transactions, where disclosure remains limited, internal control procedures remain inefficient compared to Western peers, and the concept of board independence has yet to be widely accepted.
Notably, after the Revolution of 14 January 2011, good bank governance became the focus of attention. One of the weaknesses of the Tunisian banking sector is its lack of the application of good governance practices in spite of
considerable efforts towards successful modernisation. This is largely attributed to the former political regime's intervention.
In this changing context, the Tunisian Central Bank (TCB), guided by its own new governance, published a new circular to credit institutions in May 2011. This circular defined a set of governance rules. It aimed to establish sound and prudent management to ensure the sustainability of the banking system while preserving the interests of shareholders, creditors, depositors and employees. In the Circular 2011-06, the TCB confirmed the requirement of sound governance. It presented essential statutory regulations for the management and supervision (governance) of Tunisian banks and contained internationally and nationally recognised standards for good and responsible governance. Thus, the separation of ownership and executives is recommended, risk management is prioritised, prudential management is required, and the relevance of financial reporting is advocated as part of this new regulation.
THE SAMPLE, VARIABLES, MODELS AND METHODOLOGY The Sample
A dataset of 10 Tunisian commercial banks covering a period of 14 successive years ranging from fiscal 1997 through fiscal 2010 are used in this empirical work. Thus, this dataset contains 140 observations. The sample has been limited to a single industry because the costs and benefits of different governance mechanisms may vary systematically across industries. Additionally because production technologies in banking firms are fairly homogenous and because banks are required to disclose financial information to regulators in a uniform way, the banking industry may be particularly suitable for identifying the effect of governance on performance2. The data were collected with reference
to the financial statements published by these banks and stock information delivered by the board of the financial market. The choice of this study timeframe coincides with the beginning of the electronic quotation system, which was put in place in October 1996.
Variables
Performanced measures
Two main measures of the bank profitability have been used: ROA (an accounting-based measure) and Tobin's Q (a market-based measure). These indicators are calculated as follows:
Net operatingprofit after taxes ROA =
Book valueof totalassets
Following Chung and Pruitt (1994), Tobin's Q was determined by
book value of total assets book value of common equity + market value of common equity Tobin'sQ =
book value of total assets −
Setting the Tobin's Q measure at this stage ensures that the market is recognisable among the mechanisms, with the knowledge that the mechanisms might take time to be better reflected in the given value. This partially prevents endogeneity problems related to measuring the set of variables in a contemporaneous fashion3.
Two other measures of bank performance specific to commercial banks (i.e., the interest margin and intermediation margin) are used to test the robustness of the analysis.
Interest income Interest expense Interest Margin = DEF it it it it −
Interest margin NetCFI
Intermediation Margin = DEF it it it it − where
Net CFI = Net commission and fee income, and
DEF = Deflator, which is equal to the bank's book value of total assets.
The index i denotes the bank under consideration (i = 1,…, 10), whereas the index t denotes the year under consideration (t = 1997,…, 2010).
Bank governance variables
Banks' board characteristics
Certain characteristics of bank boards (composition, size and CEO/Chair duality) reflect the motivations and abilities of a board in its supervisory and advisory duties.
The composition of the board of directors is measured by using the proportion of outside directors (OUTDIR), which we define as the number of non-executive directors of the total number of directors.
In addition, the board size (BSIZE) is measured as the number of directors serving on the board. Furthermore, the board leadership structure (DUAL) is considered to define a dummy variable that takes the value of one when the CEO and the Chairman of the Board are the same person, and zero otherwise.
Bank ownership structure
The Management Stock Ownership (MSO) is defined as the aggregate percentage of shares held by all officers and directors of the bank to be consistent with prior studies (e.g., Saunders, Strock, & Travlos, 1990; Anderson & Fraser, 2000).
This ownership measure is the year-end holdings of officers and directors4. The blockholder ownership, BLOCK, is also been introduced,
measured as the percentage of equity owned by persons and institutions that hold 5% or more of the company's equity5, including the state, a publicly owned institution, a Tunisian or foreign private institutional investor, or any other Tunisian or foreign individual investor.
Control variables
Two control variables are included to help explain the factors potentially affecting bank performance. The Equity-to-Asset ratio (E/A) is included to control for banks' financial leverage. The size variable (lnA) is introduced to capture potential scale economies or diseconomies in the banking sector.
Empirical Models
The following regression model has been estimated using the panel data technique:
0 1 2 3 4 5 6
7 8
Y = + MSO + BLOCK + OUTDIR + DUAL + BSIZE + EA +
+ ln A D +t it it it it it it it it it γ γ γ γ γ γ γ γ +γ ε (11) where:
Yit : one of the two performance measures (ROA and Tobin's Q)
MSO : the percentage of stock owned by officers and directors BLOCK : the fraction of outstanding shares owned by blockholders OUTDIR : the fraction of outside directors
DUAL : an indicator variable equal to one if the CEO also holds the position of chairman of the board, and zero otherwise
BSIZE : The number of directors serving on the board (E/A) : the equity-to-asset ratio
InA : the log of the total assets
Dt : year dummies
ɛ : the error term.
In this model, the index i denotes the bank (i = 1,…, 10), whereas the index (t) denotes the year under consideration (t = 1997,…, 2010).
All variables employed in this study are described in Table 1.
The average (median) managerial ownership amounts to 51% (55.3%), with a maximum of 83.9%. The average block ownership amounts to 53.21%, which is slightly higher than the average managerial ownership. The results are not consistent with the argument that wealth constraints are more binding for individuals than for (large) institutional block holders.
The Board Size variable shows that on average, the board of directors is composed of 11 members. As Hayes, Mehran and Schaefer (2005) documented, financial firms have larger boards than manufacturing firms on average.
The variable OUTDIR indicates that on average, 28% of administrators are external. Booth, Cornett and Tehranian (2002) indicated that industrial firms contain a significantly smaller percentage of outside (non-executive) directors on their boards of directors.
Moreover, for approximately 65% of the boards, the CEO is also the chairman. This is a high percentage, although 8 of the 10 banks had separated the two functions of CEO/Chair for at least 2 or 3 years of the period under study9. Three of them even monitored the board with a directory for a few years
(BIAT from 2000 to 2006, STB from 2001 to 2004, and BNA from 2001 to 2004).
Table 1
Descriptive statistics (1997–2010)
Variables Mean Median S.D. Minimum Maximum
Performance variables ROA 0.0089 0.0090 0.0096 –0.0813 0.0318 ROE 0.0836 0.0978 0.1660 –1.7647 0.2976 Interest Margin 0.337 0.312 0.166 0.063 1.027 Intermediation Margin 0.461 0.419 0.229 0.124 1.429 Tobin's Q 1.0165 1.003 0.0726 0.7186 1.2142 Governance variables BLOCK 0.5321 0.544 0.1581 0.1085 0.8592 MSO 0.5100 0.5530 0.1710 0.0040 0.8390 BSIZE 11.1654 12.000 1.5769 6.000 14.000 OUTDIR 0.2805 0.2727 0.1820 0.000 0.750 DUAL 0.6546 1.000 0.4771 0.000 1.000 Bank-specific variables lnA 7.7211 7.6788 0.5536 6.6041 8.8178 Book value of total assets 2620.546 2162.042 1457.674 738.161 6753.589 EA 0.0991 0.0900 0.0371 0.0340 0.3394
Concerning the performance measures during the 1997–2010 period, our sample includes both low- and high-performing banks, as indicated by the range of performance measures. By examining the accounting return rate (ROA) of the banks, the average value is positive, but low. The traditional income indicator for banks (interest margin) is 0.337 on average, which indicates that banks receive much more income from the interest-generating activities than from other non-financial activities. Descriptive statistics also emphasize that the average Tobin's Q is slightly superior to 1 (1.165).
The banks' average size is 2,620.546 million Dinars. Therefore, these banks are the smallest among European commercial banks. For example, in France, the average total assets of the 15 largest commercial banks calculated from 1997 to 2002 amounts to approximately 199.213780 billion Euros7.
Finally, the E/A ratio is low, equalling 9.91% on average. A lower E/A ratio signifies a higher degree of leverage. This is explained by the significant financing role of the economy played by Tunisian banks. For example, the banking shares among the total volume of loans granted by the financial
system ranged from 90.8% in 2003 to 93 % in 2004 8. In fact, in order to grant
loans to the economic agents with financial need, banks facilitated massive recourse debt. This confirms banks' vulnerability and, consequently, their governance specificity.
The correlations between the variables are shown in Table 2. Table 2 presents the Pearson correlation matrix. There are very few significant correlations between the variables. Only the BLOCK ratio shows a significant correlation with the MSO variable. The VIF test (Variance-Inflation Factor) shows that there is no multi-collinearity problem.
Table 2
Pearson correlation matrix (Panel with 140 observations of 10 Tunisian commercial banks, for the 1997–2010 period)
MSO BLOCK OUTDIR DUAL BSIZE EA lnA
MSO 1 BLOCK 0.707* (0.000) 1 OUTDIR –0.247* (0.000) –0.189 (0.079) 1 DUAL 0.1661 (0.448) –0.023 (0.823) –0.135 (0.179) 1 BSIZE –0.1006 (0.091) –0.124 (0.219) –0.129 (0.199) –0.286* (0.004) 1 EA –0.2576 (0.383) –0.275* (0.006) 0.137 (0.174) 0.223* (0.025) –0.272* (0.006) 1 lnA –0.1274 (0.090) –0.443* (0.000) 0.276* (0.006) 0.133 (0.186) –0.124 (0.218) 0.246* (0.014) 1 The p-values are reported in parentheses. * Statistically significant at 5%.
Econometric Modelling
The unobservable heterogeneity that may be presented in the corporate governance and performance relationship must be taken into account to address panel data. For our regressions, homogeneity tests confirm the existence of fixed individual-specific effects. In this case, the best linear unbiased estimator is the within estimator. Nevertheless, in the presence of simultaneity and dynamic endogeneity, this estimator produces biased parameter estimates. Therefore, according to Wintoki, Linck and Netter (2012) and Schultz, Tan and Walsh (2010), the Dynamic Generalised Method of Moments (GMM) estimator developed by Arellano and Bond (1991) and Blundell and Bond (1998) can
solve problems raised by simultaneity and dynamic endogeneity and produce consistent and unbiased estimates by employing valid internal instruments (Z) during the estimation. The validity of the instruments used is checked using the Hansen-Sargan test of over-identifying restrictions; H0: E (Z, ε) = 0.
Table 3
Regressions of bank performance measures (ROA and Tobin's Q) on ownership structure, board characteristics and controls
ROA Tobin's Q Pooled OLS Fixed effects System GMM Pooled OLS Fixed effects System GMM Number of observations 140 140 140 140 140 140 Constant 0.0422* (0.013) –0.02760 (0.489) 0.0497** (0.009) 2.0450** (0.000) 1.6570** (0.000) 1.0938** (0.000) MSO 0.0001 (0.313) 0.0002* (0.044) 0.0001 (0.302) 0.0004 (0.509) 0.0002 (0.604) 0.0001 (0.673) BLOCK – 0.0142* (0.011) –0.0182* (0.033) –0.0147* (0.013) –0.1475** (0.000) –0.0172 (0.593) –0.0703* (0.011) OUTDIR –0.0015 (0.713) –0.0032 (0.501) –0.0005 (0.892) –0.0696** (0.003) –0.0323 (0.101) –0.0218 (0.315) DUAL 0.0031 (0.095) 0.0044 (0.042)* 0.0024 (0.209) –0.0082 (0.394) –0.0113 (0.192) –0.0050 (0.551) BSIZE –0.0003 (0.565) –0.0006 (0.411) –0.0005 (0.369) –0.0129** (0.000) –0.0104** (0.001) –0.0086** (0.002) EA 0.0623** (0.007) 0.0409 (0.078) 0.0371 (0.102) –0.4470** (0.000) –0.6342** (0.000) –0.3111* (0.016) lnA –0.0041 (0.042)* 0.0064 (0.259) –0.0037 (0.062) –0.1053** (0.000) –0.0472** (0.006) –0.0526** (0.000) ROAt–1 0.2016* (0.021) Tobin's Qt–1 0.5482** (0.000) R2 0.3345 0.1624 0.6729 0.5147 Hausman Test Statistics 23.36* (0.0015) 22.03** (0.0025) Wald chi2 statistics Prob > chi2 44.85** (0.001) *** 114.27** (0.000) (continued on next page)
Table 3 (continued) ROA Tobin's Q Pooled OLS Fixed effects System GMM Pooled OLS Fixed effects System GMM AR(1) test (p-value) 0.000 0.000 AR(2) test (p-value) 0.984 0.111 Hansen test of over- identification (p-value) 0.63 0.10
The p-values are reported in parentheses; * Statistically significant at 5%; ** Statistically significant at 1%. Note: The GMM model includes one lag of the dependent variable. Year dummies, included in all specifications, are unreported. ROA: return on assets, Tobin's Q: market value of equity preferred Stock and Liabilities to total assets, MSO: the percentage of stock owned by officers and directors, BLOCK: the fraction of outstanding shares owned by blockholders, OUTDIR: the fraction of outside directors, DUAL: an indicator variable equal to one if the CEO also holds the position of chairman of the board and zero otherwise, BSIZE: The number of directors serving on the board, EA : The equity to asset ratio, lnA : The natural log of the book value of total assets.
To verify the need to apply the dynamic GMM estimations, the Hausman specification test for endogeneity (H0: Regressors are exogenous) is applied to the
corporate governance variables. The results reveal that endogeneity is a major concern, confirming the fact that the fixed effects coefficient estimates are unreliable and biased.
Therefore, all the models will be estimated using the pooled OLS method, in spite of the method's strict exogeneity assumptions, given its extensive employ in the corporate governance literature. Thus, a within estimator for static fixed effects is employed. Furthermore, the dynamic models are considered using the Blundel and Bond (1998) GMM estimation. This estimation is based on equations in levels and in first differences, to estimate the governance/performance relation by taking into account both dynamic aspects and time-invariant unobservable heterogeneity.
EMPIRICAL RESULTS
In this section, the relation between governance structures and bank performance are estimated. Following Wintoki et al. (2012), the OLS, fixed effects and dynamic fixed effects (system GMM) models are estimated in order to compare them to past research and to understand biases that arise from ignoring different aspects of endogeneity.
Table 3 reports the results when ROA (an accounting-based measure) and Tobin's Q (a market-based measure) are used as performance measures. We include one lag of performance in the dynamic model. This makes historical performance and historical corporate governance variables for one period or more available for use as instruments.
The results of the static OLS estimations are reported in columns 2 and 5 of Table 3 and suggest a significant relation between governance mechanisms and bank performance. Particularly, the results suggest a significant negative relationship between the Blockholder ownership and the two performance measures at the 5% level of significance. The coefficients do not confirm the effect expected by the agency theory, i.e., the effect of dominant shareholders on banking performance. Instead of a positive effect, the estimated coefficients present a negative association. This opens up the possibility for an explanation in terms of a private appropriation of benefits. Indeed, given that some shareholders represent some of the internal directors of Tunisian banks (directly or via representatives), the true problem is that these banks do not necessarily experience a conflict between shareholders and managers, but rather a conflict between controlling shareholders and minority shareholders.
The static OLS estimates using only Tobin's Q suggest a negative and significant relation between board independence, board size and bank performance. Thus, increasingly larger and independent boards destroy value.
The static fixed effects model is then estimated to correct for unobservable heterogeneity that may be present in the bank governance and performance relation. The results are presented in columns 3 and 6 of Table 3. The coefficient on MSO is positive and significant when using only ROA as a dependent variable, providing evidence that bank performance increases when managerial stock ownership is significant. Our result supports Jensen and Meckling (1976), who argued that managerial share ownership can reduce managerial incentives to consume perquisites, expropriate shareholders' wealth and engage in other non-maximising behaviour and thereby help in aligning the interests between management and shareholders. This is the "convergence-of-interest" hypothesis. Overall, the results corroborate Mehran (1995), who found a positive relation between the capital share of the CEO and bank performance (measured by ROA).
In fixed effects estimates using only ROA as a dependent variable, the association between the function of the president of the board and the role of the manager positively influences bank performance. This result indicates that a dual leadership structure allows a good knowledge of bank activities and internal and external environments. Additionally, it reinforces managers'
engagement in improving bank performance. Moreover, managers become motivated to develop a good reputation in the market (Cannella & Lubatkin, 1993; Brickley, Coles, & Jarrell, 1997). Nevertheless, this result contradicts the literature, which denounces this form of leadership due to its power abuse. Some authors such as Fama and Jensen (1983) and Jensen (1993) stipulate that dual leadership accentuates agency costs and weakens board effectiveness, thus reducing performance. More recently, Godard and Schatt (2004) find that French companies that have chosen a dual leadership structure are more profitable in the long run, confirming the paramount role played by the duality to create value.
However, the fixed effects estimation only accounts for unobservable heterogeneity. Therefore, its estimates may be biased in the presence of dynamic endogeneity and simultaneity. Given the presence of endogeneity in the corporate governance and bank performance relation, as proven by Hausman endogeneity tests for the corporate governance variables, we apply the dynamic system in addition to the OLS and fixed effects estimations.
The dynamic system GMM estimation are presented in columns 4 and 7 of Table 3. When it moves to a dynamic GMM model that includes lagged performance, the negative relation between blockholder ownership and bank performance remains true. It is important to note that these large capital stakes protect their holders from hostile takeovers and thus become entrenched. Then, they will be encouraged to extract private benefits of control at the expense of minority shareholders, thus imposing high agency costs on the latter shareholders (Shleifer & Vishny, 1997; Bebchuk, Kraakam, & Triantis, 2000). Additionally, bank loans' opacity facilitates wealth expropriation compared to that of other companies. This result is consistent w i t h Haw, Ho, Hu, and Wu (2007), Strahan (2004) and McConnell and Servaes (1990), who did not allot the first role of active control to large blockholders. This result means that smaller block ownership leads to a better accounting performance, not the opposite, i.e., weak performance leads large shareholders to reduce their participation in the bank. Additionally, the coefficient on BSIZE remains negative and statically significant at the 5% level. In fact, as size increases, the board becomes less effective in monitoring managers because of free rider problems and the increased time spent on decision-making (Jensen, 1993). These results are similar to those obtained by Wintoki et al. (2012) using static OLS and fixed effects estimates, and they are also consistent with the empirical evidence in the corporate governance literature: Large boards encounter problems of coordination, control, and decision-making. The significant and negative coefficient on BSIZE imposes an efficient limit to the appointment of too many directors.
Lastly, the coefficient on EA is negative in dynamic estimates using only Tobin's Q as a dependent variable; performance increases when banking leverage is significant. This is explained by the governance role played by depositors who can force managers to not use banks' funds on non-profitable investments (Jensen, 1993). Finally, there is evidence that as the size of the bank increases, its profitability decreases, as evidenced by the negative and statistically significant coefficient on the lnA variable shown in most specifications.
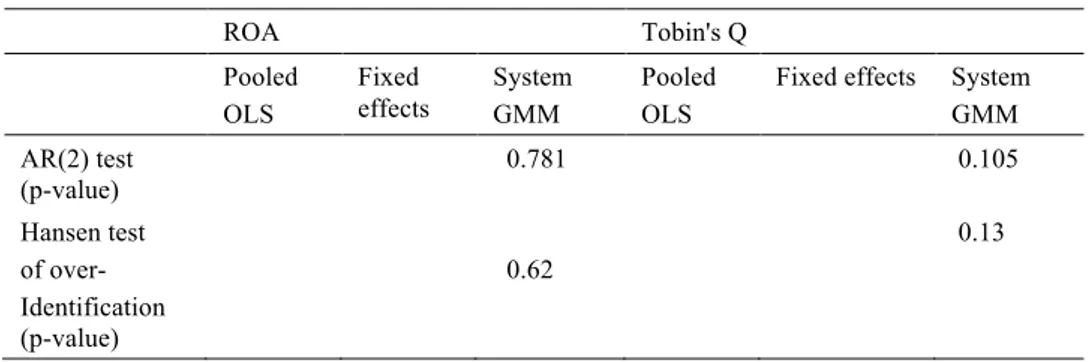
In Table 3, the results of the specification tests are reported: The Arellano-Bond second- order serial correlation tests and the Hansen-Sargan test of over-identifying restrictions. The Hansen-Sargan test indicates that hypothesis cannot be rejected to which our instruments are valid. Moreover, the Arellano-Bond test statistics indicate that there exists no autocorrelations among the errors for all specifications. Hence, the GMM-specifications are well specified based on the Hansen-Sargan test of over-identifying restrictions and the Arellano-Bond test of autocorrelation. These results are consistent for all bank performance measures.
TESTING THE ROBUSTNESS OF THE RESULTS Additional Performance Variables
Following previous governance papers (e.g., Adams & Mehran, 2012), the relation between other accounting measures of performance specific to commercial banks (i.e., interest margin and intermediation margin) and ownership structure, board size and composition has been investigated as a robustness check of the previous results. This allows to determine the sensitivity of the results to different specifications of the dependent variable. As stated by Demsetz and Lehn (1985), stock market returns adjust interest divergences between managers and owners, while accounting measures do not. Smith (1996) and Weisbach (1988) make similar claims, stating a preference for using accounting profits to identify the effects of active governance. Moreover, stock market valuations reflect the market's present valuation of long-run returns, while accounting returns reflect the immediate effect of shareholder oversight (Kim, Lee & Rhee et al., 2007).
Table 4
Regressions of bank performance measures (interest margin and intermediation margin) on ownership structure, board characteristics and controls
Interest margin Intermediation margin
Pooled OLS
Fixed effects System GMM Pooled OLS Fixed effects System GMM Number of observations 140 140 140 140 140 140 Constant 0.1112** (0.000) 0.1354** (0.000) 0.0622** (0.000) 0.1624** (0.000) 0.1674** (0.000) 0.0952** (0.000) MSO 0.00005 (0.582) 4.56e-06 (0.958) 0.00002 (0.741) 0.00006 (0.405) 0.00004 (0.357) 0.00003 (0.405) BLOCK –0.024** (0.000) –0.0191** (0.001) –0.012** (0.002) –0.0272** (0.000) –0.0120** (0.004) –0.0104** (0.000) OUTDIR 0.0066* (0.051) 0.0084* (0.019) 0.0015 (0.565) –0.0036 (0.223) 0.0002 (0.916) –0.0015 (0.389) DUAL 0.0049** (0.002) 0.0025 (0.105) 0.0018 (0.140) 0.0024* (0.053) 0.0028** (0.007) 0.0014 (0.092) BSIZE –0.0003 (0.501) –0.0005 (0.321) –0.0001 (0.612) 0.00004 (0.919) –0.0004 (0.210) –0.00007 (0.795) EA –0.0068 (0.724) –0.0033 (0.852) –0.0149 (0.298) 0.0146 (0.347) 0.0147 (0.195) –0.0021 (0.830) lnA –0.009** (0.000) –0.0115* (0.000) –0.005** (0.000) –0.014** (0.000) –0.0155 (0.000) –0.007** (0.000) Interest margin t–1 0.5637** (0.000) Intermediation margin t–1 0.4643** (0.000) R2 0.3631 0.4173 0.6016 0.5180 Hausman Test statistics 147.51** (0.0000) 103.74** (0.0000) Wald chi2 statistics Prob > chi2 43.58** (0.001) 104.23** (0.0000) AR(1) test (p-value) 0.000 0.000 AR(2) test (p-value) 0.063 0.731 Hansen test of over- identification (p-value) 0.61 0.96
The p-values are reported in parentheses; *Statistically significant at 5 %; **Statistically significant at 1%. Note: The GMM models include one lag of the dependent variable. Year dummies, included in all
In this case, the results partially reinforce conclusions for the ROA and Tobin's Q. Mainly, the results for the blockholder ownership variable corroborate the previous results. The coefficient on the board independence variable becomes positive and statistically significant at the 5% level in the static OLS and fixed effects models (except for the Intermediation Margin model). As already mentioned in the literature review, outside (non-executive) directors have a more objective view of the firm and are usually better capable of fulfilling the supervisory function. This result supports the argument that adding outside directors to the board improves management supervision and reduces the conflict of interest among stakeholders, as predicted by theory. Moreover, if a bank appoints a new outside director with advisory capabilities, strategic decisions should improve performance because the counselling skills of the directors complement those of the CEO. The enhanced bank performance should be expected. This finding is similar to those obtained by a number of prior studies, including Byrd and Hickman (1992), Rosenstein and Wyatt (1990) and Staikouras, Staikouras and Agoraki (2007), who observed that increased representation by outside (non-executive) directors on the Board of Directors is positively associated with firm performance and shareholder wealth. Moreover, the coefficient on the DUAL variable remains positive and significant at 5% in most static OLS and fixed effects estimations.
Blockholder ownership remains significantly and negatively related to bank performance in a dynamic model. Moreover, the results show that when we include fixed effects in a dynamic model and conduct GMM estimations, the coefficient on board independence is insignificant. This is in sharp contrast to the results from the static fixed effects model, for which the coefficient on board independence is significantly positive. However, the positive bias in the fixed effects coefficient estimate is consistent with the bias expected if the dynamic relation between current corporate governance and past performance is ignored: if board independence is positively related to past performance, then fixed effects estimates of the relation between board independence and firm performance will be positively biased. Moreover, the positive and significant coefficient on the DUAL variable disappears.
The coefficient on lnA is negative and significant at the 1% level in all models, corroborating the results of Spong, DeYoung and Sullivan (1996) and Berger and Bonaccorsi di Patti (2006).
The Presence of Government Officials on Banks' Boards of Directors
Given the central place of state ownership in the Tunisian banks' capital, we are motivated to control for government ownership, which is argued to affect principal-agent relationships (Levine, 2003) and to be associated with poorly
developed banks (Barth, Caprio, & Levine, 2001).
At this level, it is important to note that the Tunisian bank corporate governance system is characterised by government intervention, strong regulation and limited market discipline. Indeed, state intervention in the Tunisian banking system is marked mainly by the strong prudential banking regulations described above, strict supervision provided by the monetary authorities (the Central bank of Tunisia and the Ministry of Finance), through reforms completed or initiated and restructuring and modernisation programs, and by holding significant capital shares in the banks directly or through institutions it controls (see the IMF Report No. 04/359).
Importantly, note that the presence of retired high-ranking officials of the Ministry of Finance and the Central Bank of Tunisia on banks' boards of directors is also linked to the state ownership of banks' capital. Direct Tunisian state ownership is currently 9.85% of banks' shares on average, while the indirect control of the public establishment was 16.11% on average. The Tunisian National Social Security Fund (CNSS) and the Tunisian National Oil company (ETAP) are the main public enterprises that are shareholders of the Tunisian banking system. Thus, any eventual inefficiency of banks' governance is largely due to the absence of external pressures on managers, especially when the state is both a shareholder and supervisor. In this way, internal corporate governance mechanisms, notably, the board of directors, are of central importance to Tunisian banks. Hence, we choose to test the effect of the presence of retired high-ranking officials of the Ministry of Finance and the Central Bank of Tunisia on banks' performance.
The impact of the presence of government officials on the board of directors is proxied by including the following variable:
State directors: A dummy variable that takes the value one if a
government official(s) from the Ministry of Finance and/or the Central Bank of Tunisia belongs to a bank's boards of directors, and zero otherwise.
As shown in Tables 5 and 6, the inclusion of the state director variable changes the results slightly. Most regressions report consistent roles of ownership and board variables in explaining bank performance. In all regressions, evidence is found of the importance of blockholder ownership, duality and board size for bank performance.
Table 5
Regressions of bank performance measures (ROA and Tobin's Q) on ownership structure, board characteristics, the presence of government officials on banks' board of directors and controls
ROA Tobin's Q
Pooled OLS
Fixed
effects System GMM Pooled OLS effects Fixed System GMM Number of observations 140 140 140 140 140 140 Constant –0.0113 (0.779) –0.0113 (0.779) (0.292) 0.0250 (0.000) 1.7935** 1.2448** (0.000) (0.000) 1.0576** MSO 0.0001 (0.325) (0.018) 0.0002* (0.280) 0.0001 (0.530) 0.0003 (0.495) 0.0003 (0.719) 0.0001 BLOCK –0.0131* (0.019) –0.0144* (0.051) –0.0125* (0.035) –0.1335** (0.000) (0.780) 0.0094 –0.0645* (0.013) OUTDIR –0.0017 (0.677) –0.0009 (0.847) –0.00007 (0.985) –0.0721** (0.001) (0.213) –0.0243 –0.0312 (0.125) DUAL 0.0045* (0.023) 0.0022 (0.360) 0.0045* (0.030) 0.0097 (0.308) –0.0213* (0.027) 0.0070 (0.414) BSIZE 0.0004 (0.397) –0.0008 (0.283) –0.0007* (0.0186) –0.0149** (0.000) –0.0095** (0.002) –0.0120** (0.000) State directors 0.0041 (0.057) 0.0079* (0.047) –0.0038 (0.094) –0.0519** (0.000) 0.0265 (0.118) –0.0372** (0.000) EA 0.0562* (0.014) (0.130) 0.0350 (0.152) 0.0315 –0.5246* (0.000) –0.7052** (0.000) –0.3160* (0.012) lnA –0.0011 (0.669) (0.495) 0.0039 –0.0006 (0.813) –0.0654 (0.000) (0.739) –0.0075 –0.0299** (0.009) ROA t–1 0.1753* (0.043) Tobin's Q t–1 0.4415** (0.000) R2 0.3548 0.0637 0.6822 0.1434 Hausman Test Statistics 71.88* (0.0315) 87.78** (0.0000) Wald chi2 statistics Prob > chi2 50.42** (0.000) 143.74 ** (0.000) AR(1) test (p-value) 0.000 0.000
Table 5: (continued) ROA Tobin's Q Pooled OLS Fixed
effects System GMM Pooled OLS Fixed effects System GMM AR(2) test (p-value) 0.781 0.105 Hansen test of over- Identification (p-value) 0.62 0.13
The p-values are reported in parentheses; * Statistically significant at 5 %; ** Statistically significant at 1%.
Importantly, the static OLS estimate suggests a negative and significant relation between the board participation of government officers and bank performance (except for ROA and the interest margin). Interestingly, when we estimate this relation in static fixed effects models, the sign flips to positive and significant. This implies that an OLS regression that ignores the unobservable heterogeneity of managerial behaviour may find a negative relation between performance and the presence of government officials on banks' boards of directors.
However, in the dynamic GMM model, the relation between the presence of government officials on banks' boards of directors and performance is significant and negative when using Tobin's Q as a dependent variable. The intuition behind the sign reversal with respect to the effect of the board participation of government officers on performance is an interesting one and illustrates the bias that may arise from ignoring both unobservable heterogeneity and the dynamic relation between corporate governance and past performance. This result is similar to those reported in a number of prior studies including Bolbol, Fatheldin and Omran (2004), who use data on financial institutions and industrial firms in Tunisia and three other Arab countries. This result may be explained by the observation that the most effective managers are less monitored by the government and therefore have fewer state directors. Of course, these banks will exhibit enhanced performance. These are expected results for an emerging economy such as Tunisia's, for which the performance may be influenced by alternative governance mechanisms and the presence of state directors rather than external governance mechanisms considered deficient, i.e., the weakness of investor protection and the absence of well-developed markets for corporate control.
Table 6
Regression of bank performance measures (Interest margin and Intermediation margin) on ownership structure, board characteristics, the presence of government officials on banks' board of directors and controls
Interest Margin Intermediation Margin Pooled OLS Fixed effects System GMM Pooled OLS Fixed effects System GMM Number of observations 140 140 140 140 140 140 Constant 0.1059** (0.000) (0.000) 0.1873** (0.000) 0.0664** (0.000) 0.1410** (0.000) 0.1918** (0.000) 0.0947** MSO 0.00005 (0.590) (0.614) 0.00004 (0.733) 0.00002 (0.422) 0.00006 (0.117) 0.00008 (0.407) 0.00003 BLOCK –0.024** (0.000) –0.0131* (0.020) –0.012** (0.002) –0.026** (0.000) –0.0101** (0.010) –0.010** (0.001) OUTDIR 0.0065 (0.081) (0.001) 0.0112** (0.592) 0.0014 –0.0038 (0.184) (0.474) 0.0016 –0.0016 (0.387) DUAL 0.0053** (0.002) –0.0005 (0.750) 0.0015 (0.272) 0.0040** (0.003) 0.0011 (0.287) 0.0015 (0.128) BSIZE –0.0003 (0.455) –0.0005 (0.272) –0.0001 (0.630) –0.0001 (0.743) –0.0006 (0.086) –0.00007 (0.791) State directors –0.0011 (0.555) 0.0089** (0.001) 0.0007 (0.673) –0.004** (0.003) 0.0058** (0.002) –0.0001 (0.913) EA –0.0058 (0.772) –0.0059 (0.724) –0.0143 (0.328) 0.0080 (0.595) 0.01052 (0.325) –0.0021 (0.827) lnA –0.008** (0.000) –0.0183** (0.000) –0.005** (0.003) –0.011** (0.000) –0.0169** (0.000) –0.007** (0.000) Interest Margin t–1 0.5674** (0.000) Intermediation Margint–1 0.4622** (0.000) R2 0.4564 0.2744 0.6309 0.3813 Hausman Test Statistics 60.50** (0.0000) 70.35* (0.0311) Wald chi2 statistics
Prob > chi2
43.66*
(0.002) 104.24** (0.000)
AR (1) test
(p-value) 0.000 0.000
Table 6 (continued)
Interest margin Intermediation margin Pooled OLS Fixed effects System GMM Pooled OLS Fixed effects System GMM AR (2) test (p-value) 0.068 0.736
hansen test of over- identification (p-value)
0.58 0.75
The p-values are reported in parentheses; * Statistically significant at 5 %; ** Statistically significant at 1%.
CONCLUSION
Corporate governance is a young academic field characterised by partial theories, limited access to high-quality data, inconsistent empirics, and unresolved methodological problems. This paper has attempted to improve empirical insight into the relationship between internal corporate governance, particularly ownership and board characteristics, and performance by analysing this relationship in a different way a n d in an improved empirical setting using various econometric techniques. Specifically, taking endogeneity sources into account, the GMM technique is applied to estimate the effect of governance on performance for a panel of 10 Tunisian banks from 1997 to 2010. A negative and significant impact of blockholder ownership on bank performance is observed. This finding indicates that for banks with controlling owners, the entrenchment effect acts as the predominant force shaping bank operations. According to Haw et al. (2007), this detrimental effect is concentrated in countries with poor legal protection, heavy government intervention and weak private monitoring. Additionally, board size and performance are negatively related, which confirms the widespread belief that small boards are more efficient. CEO duality seems to be effective at mitigating agency conflicts in Tunisian banking firms.
Many of these results hold after the controls for the measure of performance and the presence of government officials on banks' boards of directors. Mainly, t h e empirical evidence is obtained that the advisability of state directors does not perform monitoring and advising functions in an efficient manner. These directors should be a minority on the board. The number of state directors at the expense of other ones is decreased accordingly. Additionally, banks, as complex units, benefit from smaller boards. Moreover, it is preferable to cumulate the function of the manager and that of the president of the board. Finally, the presence of the largest shareholders should be avoided to ensure more stability.
Given the stable corporate governance structure in Tunisia, the results are to be expected, i.e., the governance characteristics are crucial for Tunisian bank performance.
Although more research needs to be conducted on the role of the sound governance of banks, the analysis suggests that banking is unique in its performance-governance relation. This should be taken into consideration by Tunisian shareholders and boards of directors when making important strategic decisions.
These insights have far-reaching policy implications, as they indicate that the regulations and guiding principles for good corporate governance should be reviewed.
Importantly, the events of the Arab uprisings have planted the governance debate firmly within the public discourse in the region. In Tunisia, the confiscation of private ownership stakes has required a reflection on how enterprises should be governed. Accordingly, just a few months after the revolution, the transitional government introduced new guidelines for the corporate governance of banks. The Arab uprisings may have been detrimental to the performance of capital markets in the region in the short term. However, perhaps we should remember that there is nothing more effective than a crisis in drawing out an opportunity. This opportunity is to leverage the corporate governance debate to raise international interest in the Arab markets and to attract more stable investment in the region. Liquidity and listings, the two preoccupations of stock exchanges and securities regulators in the region, will follow.
NOTES
1. See Bhaumik and Piesse (2008) for more details.
2. It is possible to view the regulatory oversight of the banking industry as a substitute for corporate governance. However, there are few specific regulations concerning banking firm boards and governance. In addition, the presence of a regulator should affect all banking firms with the same regulator, as in the case of our sample. 3. Dybvig and Warachka (2010) stated recent endogeneity concerns when Tobin's Q is
used as a measure of firm performance.
4. Note that managers hold smaller capital stakes in their banks. For examples, according to the leaflets on the capital increase, for the BIAT, 3 of the 4 members of the directory held 0.17% of the capital on 30 June 2004; for the UIB, the CEO and the Chairman of the Board held 20 shares on 26 August 2004.
5. According to the law No 2006-19 of 10 May 2006, a blockholder is defined as a shareholder who holds more than 5% of a firm's outstanding shares.
6. The Arab Tunisian Bank adopted this separation during the 14 years of the study (from 1997 to 2010).
7. Standard and Poor's Ratings Services (2002). Comparative statistics: French bank. The McGraw-Hill Companies, October.
8. Annual report of the Tunisian Central Bank in 2004.
REFERENCES
Adams, R., & Mehran, H. (2012). Bank board structure and performance: Evidence for large bank holding companies. Journal of Financial Intermediation, 21, 243– 267.
Anderson, R. C., & Fraser, R. D. (2000). Corporate control, bank risk taking, and the health of the banking industry. Journal of Banking and Finance, 24, 1383– 1398.
Arellano, M., & Bond, S. (1991). Some tests of specification for panel data: Monte Carlo evidence and an application to employment equations. Review of Economic Studies, 58, 277–297.
Barth, J. R., Caprio, G., & Levine, R. (2001). Banking system around the globe: Do regulation and ownership affect performance and stability? In F. Mishkin (Ed.), Prudential supervision: What works and what doesn't (pp. 31–96). Chicago: University of Chicago Press.
Bauguess, S., Moeller, S., Schlingemann, F., & Zutter, C. (2009). Ownership structure and target returns. Journal of Corporate Finance, 15, 48–65.
Bebchuk, L. A., Kraakam, R., & Triantis, G. (2000). Stock pyramids, cross-ownership and dual class equity: The creation and agency costs of separating control from cash flow rights. In R. K. Morck (Ed.), Concentrated corporate ownership (pp. 295–318). Chicago: National Bureau of Economic Research.
Berger, A. N., & Bonaccorsi di Patti, E. (2006). Capital structure and firm performance: A new approach to testing agency theory and an application to the banking industry. Journal of Banking and Finance, 30, 1065–1102.
Bhaumik, S. K., & Piesse, J. (2008). Does lending behaviour of banks in emerging economies vary by ownership? Evidence from the Indian banking sector. Economic Systems, 32, 177–196.
Blundell, R., & Bond, S. (1998). Initial conditions and moment restrictions in dynamic panel data models. Journal of Econometrics, 87, 115–143.
Bolbol, A., Fatheldin, A., & Omran, M. M. (2005). Ownership structure, firm performance, and corporate governance: Evidence from selected Arab countries. Journal of Finance, 42, 823–837.
Booth, J., Cornett M. M., & Tehranian, H. (2002). Boards of directors, ownership, and regulation. Journal of Banking and Finance, 26, 1973–1996.
Brickley, J. A., Coles, J. L., & Jarrell, G. (1997). Leadership structure: Separating the CEO and chairman of the board. Journal of Corporate Finance, 3, 189–220. Byrd, J. J., & Hickman, K. A. (1992). Do outside directors monitor managers? Journal
Cannella, A. A., & Lubatkin, M. (1993). Succession as a socio-political process: Internal impediments to outsider selection. Academy of Management Journal, 36, 763– 793.
Chung, K. H., & Pruitt, S. W. (1994). A simple approximation of Tobin's Q. Financial Management, 23, 70–74.
Crespi, R., Garcia-Cestona, M.A., & Salas, V. (2004). Governance mechanisms in Spanish bank: Does ownership matter? Journal of Banking and Finance, 28, 2311–2330.
Demsetz, H., & Lehn, K. (1985). The structure of corporate ownership: Causes and consequences. Journal of Political Economy, 93, 1155–1177.
Dybvig, P. H., & Warachka, M. (2010). Tobin's Q does not measure performance: Theory, empirics, and alternative measures. Retrieved from http://ssrn.com/abstract=1562444
Fama, E., & Jensen, M. (1983). Agency problem and residual claims. Journal of Law and Economics, 26, 327–349.
Godard, L., & Schatt, A. (2004). Caractéristiques et fonctionnement des conseils d'administration français: Un état des lieux [Characteristic and functioning of French board of directors: An inventory]. Cahier du FARGO N° 1040201, Université de Franche-Comté, Février.
Gorton, G., & Schmid, F. (1999). Universal banking and the performance of German firms. Philadelphia: University of Pennsylvania.
Hayes, R., Mehran, H., & Schaefer, S. (2005). Board committee structures, ownership and firm performance (Working paper). Federal Reserve Bank of New York and University of Chicago.
Haw, I-M., Ho, S. S. M., Hu, B., & Wu, D. (2007). Concentrated control, institutions and banking sector: An international study. SSRN working paper. Doi: 10.1016/j.jbankfin.2009.08.013
Pathan, S., Skully, M., & Wickramanayake, J. (2008). Reforms in Thai Bank Governance: The aftermath of the Asian Financial Crisis. International Review of Financial Analysis, 17, 345–362.
Jensen, M. C. (1993). The modern industrial revolution, exit, and the failure of internal control systems. Journal of Finance, 48, 831–880.
Jensen, M. C., & Meckling, H. M. (1976). The theory of the firm: Managerial behaviour, agency costs, and capital structure. Journal of Financial Economics, 3, 305–390.
Kim, K. A., Lee, S. H., & Rhee, G. S. (2007). Large shareholder monitoring and regulation: The Japanese banking experience. Journal of Economics and Business, 59, 466–486.
Levine, R. (2003). Bank supervision, corporate finance, and economic d evelopment. NBER Working paper. Retrieved from http://www.nber.org/papers/w9620 McConnell, J. J., & Serveas, H. (1990). Additional evidence on equity ownership
and corporate value. Journal of Financial Economics, 27, 595–612.
Mehran, H. (1995). Executive compensation structure, ownership, and firm performance. Journal of Financial Economics, 38,163–184.
Pathan, S., Skully, M., & Wickramanayake, J. (2008). Reforms in Thai bank governance: The aftermath of the Asian financial crisis. International Review of Financial
Analysis, 17, 345–362.
Peni, E., & Vähämaa, S. (2012). Did good corporate governance improve bank performance during the financial crisis? Journal of Financial Services Research, 41, 19–35.
Prowse, S. (1997). The corporate governance system in banking: What do we know? Banca del Lavoro Quarterly Review, March, 11–40.
Robinson, D. (2009). Size, ownership, and the market for corporate control. Journal of Corporate Finance, 15, 80–84.
Rose, M. J. (2009). Heterogeneous impacts of staggered boards by ownership concentration. Journal of Corporate Finance, 15, 113–128.
Rosenstein, S., & Wyatt, J. (1990). Outside directors, board independence and shareholders wealth. Journal of Financial Economics, 26, 175–191.
Sarkar, S., Sarkar, J. S., & Bhaumik, S. K. (1998). Does ownership always matter? Evidence from Indian banking industry. Journal of Comparative Economics, 26, 262–281.
Saunders, A., Strock, E., & Travlos, N. (1990). Ownership structure, deregulation, and bank risk taking. Journal of Finance, 45, 643–654.
Shleifer, A., & Vishny, R. W. (1997). A survey of corporate governance. Journal of Finance, 52, 737–783.
Smith, M. P. (1996). Shareholder activism by institutional investors: Evidence from CalPERS. Journal of Finance, 51, 227–252.
Spong, K., DeYoung, R., & Sullivan, R. J. (1995). What makes a bank efficient?– A look at financial characteristics and bank management and ownership structure. Financial Industry Perspectives, December, 1–19.
Staikouras, P. K., Staikouras, C. K., & Agoraki, M. E. K. (2007). The effect of board size and composition on European bank performance. European Journal of Law and Economics, 23, 1–27.
Strahan, P. E. (2004). Commentary: Ownership structure and bank performance. FRBNY Economic Policy Review, September, 109–113.
Sullivan, R. J., & Spong, K. R. (2007). Manager wealth concentration, ownership structure, and risk in commercial banks. Journal of Financial Intermediation, 16, 229–248.
Wintoki, M. B., Linck, J. S., & Netter, J. M. (2012). Endogeneity and the dynamics of internal corporate governance. Journal of Financial Economics, 105, 581–606. Schultz, E. L., Tan, D. T., & Walsh, K. D. (2010). Endogeneity and the corporate
governance-performance relation. Australian Journal of Management, 35, 145– 163.
Weisbach, M. (1988). Outside directors and CEO turnover. Journal of Financial Economics, 20, 431–460.
Wruck, K. H., & Wu, Y. (2009). Relationships, corporate governance, and performance: evidence from private placements of common stock. Journal of Corporate Finance, 15, 30–47.
Yin-Hua, Y., Chung, H. & L i u , C . L . (2011). Committee independence and financial institution performance during the 2007–08 credit crunch: Evidence from a multi-country study. Corporate Governance: An International Review, 19, 437–458.