Volume 1 Number 2 (2018): 9-16
Article citation: Olabode, O. E., Okakwu, I. K., Ade-Ikuesan, O. O., & Fajuke, I. D. (2018). Performance Evaluation of Medium-Term Load Forecasting Approaches: A Case Study of Ogun State, Nigeria. Journal of Advances in Science and Engineering, 1(2): 9-16. https://doi.org/10.37121/jase.v1i2.24
Journal of Advances in Science and Engineering
(JASE)
Performance Evaluation of Medium-Term Load Forecasting
Approaches: A Case Study of Ogun State, Nigeria
1
Olabode, O. E.,
2,*Okakwu, I. K.,
3Ade-Ikuesan, O. O., &
4Fajuke, I. D.
1,4 Department of Electronic/Electrical Engineering, Ladoke Akintola University of Technology, Ogbomoso, Nigeria; 2Department of Electrical/Electronic Engineering, University of Benin, Benin City, Nigeria; 3Department of Computer and Electrical Engineering, Olabisi Onabanjo University, Ago Iwoye, Nigeria.
*Corresponding author’s e-mail:[email protected]
Abstract Keywords
The place of electrical energy in enhancement of this computer age cannot be over-emphasised. Its forecast plays a significant functions in energy industry, helps the government and private sectors in making the precise decision regarding energy management practices. This paper presents performance evaluation of medium-term load forecasting techniques: a case study of Ogun State, Nigeria. Two different approaches were used using the previous load consumption in 2017 for the forecast. Least square approach compared with regression exponential approaches gave the least value of Mean Average Percentage Error (MAPE) and Root Mean Square Error (RMSE), which are 1.8212% and 0.004472 respectively. The anticipated percentage load growth for the months of July-December, 2018 forecasted with least square approach were 34.06%, 33.54%, 36.10%, 31.10%, 32.23% and 30.15% respectively, acute gas supply caused by pipeline vandalisation and theft of distribution/sub-station materials could be held responsible for low load growth in the month of December. The results of this analysis will assist the Regional Headquarters, Ibadan Electricity Distribution Company (IBEDC), Abeokuta, Ogun State in making effective planning, operation and management of energy across the state.
Received 16 August 2018; Revised 3 Sept. 2018; Accepted 6 Sept. 2018; Available online 7 Sept. 2018.
Least square model; Load forecast; MAPE;
Monthly load growth; Regression exponential model;
RMSE.
Copyright © 2018 The Authors. This is an open access article under the CC BY-NC-ND license (http://creativecommons.org/licenses/by-nc-nd/4.0/)
1. Introduction
Electrical energy is ranked as one of the most essential resources needed to pivot developmental activities of any community or country (Okundamiya et al., 2014). The amount of electrical energy available largely dictates the extent of growth that would occur both at industrial and domestic level (Eneje et al., 2012; Minaye & Matewose, 2013; Saab et al., 2000). The demand for this electrical energy is a direct function of weather variables, human social activities, industrial activities as well as community developmental involvement (Cheepati & Prasad, 2016). The exponential growth in demand for power does not commensurate with the growth in supply of power hence; a serious challenge is created by this energy-demand gap for power system engineers in power utilities companies (Amlabu et al., 2013; Volkan & Husevin, 2001). The need for efficient/precise prediction of what energy demand will be on hourly, weekly, monthly or annually basis has to be adequately forestalled and one of such scheme for doing this task is load forecasting.
Load forecasting is a tool for predicting the hourly, daily, weekly, monthly and yearly values of the system load, peak system load and system energy demand (Gross & Galiana, 1987). It encompasses the precise forecast of both the magnitudes and geographical location of electric load over the diverse periods of planning horizon (Amlabu et al., 2013). Accurate load forecasting not only helps users in the choice of more appropriate electricity consumption scheme and reduction of expenditure on electric energy but also a conducive means of optimising power systems resources with a view to improving electric power supply capability and ultimate realization of conservation of energy and emission reduction objectives (Hu et al., 2017; Jianwei et al., 2018; Li et al., 2014).
Olabode et al./Journal of Advances in Science and Engineering. Volume 1 Number 2 (2018): 9-16
10 | P a g e I S S N : 2 6 3 6 - 6 0 7 X
Load forecasting enhances efficient planning, operation and management of the electricity industry and electric power systems as a whole. If a precise forecast is made, substantial savings in operation and maintenance costs, increased reliability of power supply and delivery system, and correct decisions for future development can be achieved (Minaye & Matewose, 2013). It is of immense benefit to electric utility as it provides important guide in making informed decisions as per purchasing and generating electric power, load switching, and infrastructure development (Yuansheng et al., 2016). Based on the length of time involved, load forecasting can be classified as short-term (STLF), medium-term (MTLF), and long-term load forecast (LTLF) (Singh et al., 2012).
Medium- term load forecast (MTLF) is of interest in this paper, it refers to forecast within a time frame of one month to one year (Chandra & Satyanaravana, 2013; Sadowruk & Barbosa, 1999). MTLF finds application in planning of fuel procurement, scheduling unit maintenance, energy training and revenue appraisal. Miscellaneous uses of MTLF entails decisions on capital repairs, inventory control of coal and liquid fuels, the purchase of fuel quantities and the assessment of revenue impacts due to changes in electricity tariffs (Cullen, 1999). Several researchers have proposed and implemented different load forecasting techniques, which can be classified into two major classes; the classical prediction methods and novel prediction method based on artificial intelligence techniques (Brodowski et al., 2017; Germi et al., 2014; Jianwei et al., 2018; Wang et al., 2016). Classical methods among others include regression analysis, time series method, grey prediction method while artificial intelligence techniques includes artificial neural network, genetic algorithm, particle swarm optimization and bacterial foraging optimisation (Ei et al., 2001; Jianwei et al., 2018; Lu & Zhou, 2009; Yang & Li, 2006). Peculiar techniques applicable to MTLF found in literatures so far are trend analysis, end-use models, econometric models statistical model based learning, artificial neutral network and support vector machine (Papaioannou et al., 2016).
This paper presents performance evaluation of medium-term load forecasting approaches: a case study of Ogun State, Nigeria. The rest of this paper is organised as follows: Section 2 presents the materials and method. Section 3, presents the discussion of results while section 4 presents conclusion.
2. Materials and Methods
2.1. Description of Study Area
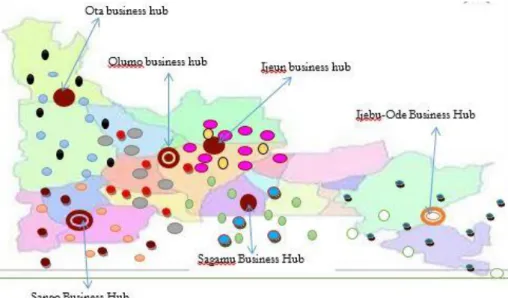
The study location is Ogun State, Nigeria found between longitude and latitude 6.9075°N, 3.5813°E respectively. Abeokuta serves as the capital of the state which houses the regional office of Ibadan electricity distribution company (IBEDC). The state population as at 2016 census stood at 5,217,700 and total surface area is 16,762𝑘𝑚2while her population density was estimated to be 311.3/km. IBEDC regional office in Abeokuta controls six business hubs (BHs) namely Ijeun, Olumo, Sagamu, Ijebu-ode, Ota, and Sango, its operating voltage level is 132/33/11/0.415 kV. These transmission stations feed 33 kV feeders and 27 injection substations owned by IBEDC, which inter-supply electricity to 47 number of 11 kV feeders across the entire state. Figure 1 shows the location of six business hubs across the study area.
I S S N : 2 6 3 6 - 6 0 7 X 11 | P a g e 2.2. Acquisition of Field Data and Implementation Tool
The monthly energy consumption in megawatt hour (MWh) in Ogun State from January 2017 to December, 2017 was collected for the analysis. The monthly energy consumption in megawatt (MW) was derived from the data collected and was used in the analysis. The collected data over a period of 12 months is shown in Table A (Appendix).
A comparative performance evaluation of regression exponential and least square techniques on medium-term load forecasting was done using MAPE and RMSE as performance metric. The MAPE and RMSE are commonly used indicators for comparing error terms of models (Okundamiya & Okpamen, 2013; Okundamiya et al., 2016).Micro-Soft Excel was used for the computational analysis in this research.
2.3. Mathematical Modelling of Techniques Used For the Load Forecasting
2.3.1 Least Square Approach:This is one of the effective techniques of obtaining a good fit to a given data. The detailed mathematical derivation of the least square technique is given by Wang et al. (2016). Given a straight line in its simplest form as:
𝑦 = 𝑎0+ 𝑎1𝑥, (1)
where, y is the dependent variable, x is the independent variable aois the intercept on y-axis and a1is the gradient
of the line.
Applying the least square approach, the values of 𝑎0 and 𝑎1 can be obtained thus:
𝑆𝑢𝑚 = 𝑆 = ∑𝑛𝑖=1(𝑒𝑖2) (2)
= ∑[(𝑂𝑏𝑠𝑒𝑟𝑣𝑒𝑑 𝑉𝑎𝑙𝑢𝑒𝑠) + (𝑃𝑟𝑒𝑑𝑖𝑐𝑡𝑒𝑑 𝑣𝑎𝑙𝑢𝑒𝑠)]2 (3)
= ∑𝑛𝑖=1[𝑦𝑖− (𝑎0+ 𝑎1𝑥 )]2 (4)
Opening up (4) and differentiating the resulting equation with respect to 𝑎0 and 𝑎1 then:
𝑛𝑎0+ 𝑎1∑ 𝑥𝑖= ∑ 𝑦𝑖 (5)
𝑎0∑ 𝑥𝑖+ 𝑎0∑ 𝑥𝑖2= ∑ 𝑥𝑖𝑦𝑖 (6)
Solving (5) and (6) simultaneously; the values of 𝑎0 and 𝑎1 is obtained thus: 𝑎1= 𝑛 ∑ 𝑥𝑖𝑦𝑖−∑ 𝑥𝑖∑ 𝑦𝑖 𝑛 ∑ 𝑥𝑖2−(∑ 𝑥𝑖)2 (7) 𝑎0= ∑ 𝑦𝑖−𝑎1∑ 𝑥𝑖 𝑛 (8)
2.3.2 Regression Exponential Approach:The detailed mathematical modelling of this approach is given by Wang et al. (2016), important formulas are thus given here. The relationship between the base load and yearly growth rate is given as:
𝑌 = 𝐴𝑒𝐵𝑥 (9)
Taken the natural logarithm of both sides of (9) the following equation is obtained:
𝑙𝑛𝑌 = 𝑙𝑛𝐴 + 𝐵𝑥. (10)
∑ 𝑙𝑛𝑌 = ∑ 𝑙𝑛𝐴 + 𝐵 ∑ 𝑋 (11)
∑ 𝑋𝑙𝑛𝑌 = 𝑛 𝑙𝑛𝐴 ∑ 𝑋 + 𝐵 ∑ 𝑋2 (12)
Solving (11) and (12) simultaneously, the coefficients 𝑎 and 𝑏 are obtained thus: 𝑙𝑛𝐴 = 𝑎 =∑ 𝑙𝑛𝑦 ∑ 𝑥2−∑ 𝑥𝑙𝑛𝑦 ∑ 𝑥
𝑛(∑ 𝑥2)−(∑ 𝑥)2 (13)
𝐵 =𝑛 ∑(𝑥𝑙𝑛𝑦)−∑ 𝑥(∑ 𝑙𝑛𝑦)
𝑛(∑ 𝑥2)−(∑ 𝑥)2 (14)
2.3.4 Performance Metrics: The performance metrics used in this analysis are Mean Average Percentage Error (MAPE) and Root Mean Square Error (RMSE). These indices are expressed by (15) and (16) respectively.
𝑀𝐴𝑃𝐸 =𝑛1∑ |𝐴𝑐𝑡𝑢𝑎𝑙𝐿𝑜𝑎𝑑−𝐹𝑜𝑟𝑒𝑐𝑎𝑠𝑡𝑒𝑑𝐿𝑜𝑎𝑑| 𝐴𝑐𝑡𝑢𝑎𝑙𝐿𝑜𝑎𝑑 𝑛 𝑖=1 × 100% (15) RMSE=√∑𝑛𝑖=1(𝑦̂𝑡−𝑦𝑡)2 𝑛 (16)
Where, 𝑦̂𝑡 is the forecasted load (MW) and 𝑦𝑡 is the actual load (MW).
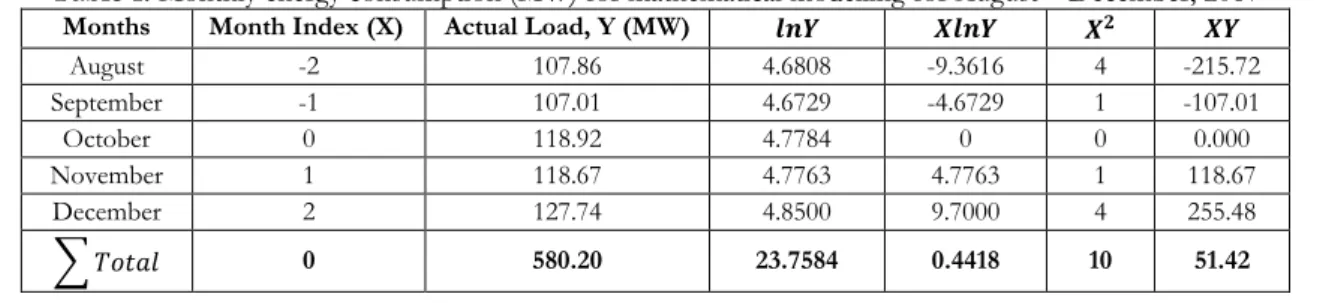
Least value of MAPE and RMSE gives optimal performance. To carry out load forecasting using least square and regression exponential techniques, Table 1 is formulated from the data collected.
Table 1. Monthly energy consumption (MW) for mathematical modelling for August – December, 2017
Months Month Index (X) Actual Load, Y (MW) 𝒍𝒏𝒀 𝑿𝒍𝒏𝒀 𝑿𝟐 𝑿𝒀
August -2 107.86 4.6808 -9.3616 4 -215.72 September -1 107.01 4.6729 -4.6729 1 -107.01 October 0 118.92 4.7784 0 0 0.000 November 1 118.67 4.7763 4.7763 1 118.67 December 2 127.74 4.8500 9.7000 4 255.48 ∑ 𝑇𝑜𝑡𝑎𝑙 0 580.20 23.7584 0.4418 10 51.42
Olabode et al./Journal of Advances in Science and Engineering. Volume 1 Number 2 (2018): 9-16
12 | P a g e I S S N : 2 6 3 6 - 6 0 7 X
3. Results and Discussion
The actual monthly energy consumption (MW) for the month of August-December, 2017 is shown in Table 2. The modelled equation obtained for Least Square technique after substituting for each term in (7) and (8) using the values presented in Table 1 is given by the equation:
𝑌 = 116.04 + 5.142𝑋 (17)
Substituting for the assigned value of X corresponding to each month in Table 1, that is August (𝑋 = −2), September (𝑋 = −1) etc., the forecasted load with this approach is as shown in Table 3.
A graphical comparison of the forecasted load obtained using least square approach with the actual monthly energy consumption alongside the error gap between the forecasted load and the actual load for the months of August to December, 2017 is as shown in Figure 2. It is observed that the forecasted load with this approach gave a result that is almost the same in value with the actual load consumed in the months under consideration, this reflects that the proposed approach is adequate to predict what load consumption will be in the state.
Table 2. Actual monthly energy consumption (MW)
Months (2017) Actual Load (MW)
August 107.86 September 107.01 October 118.92 November 118.67 December 127.74
Table 3. Forecasted load with least square approach (MW)
Months (2017) Forecasted Load (MW) Error Gap (MW)
August 105.76 2.10 September 110.89 3.88 October 116.04 2.88 November 121.18 2.51 December 126.74 1.42
Figure 2. Comparison of Forecasted Load, Actual Load and Error Gap
The modelled equation for the regression exponential model after substituting for each term in (13) and (14), gives:
𝑌 = 115.78 + 10.7𝑋 (18)
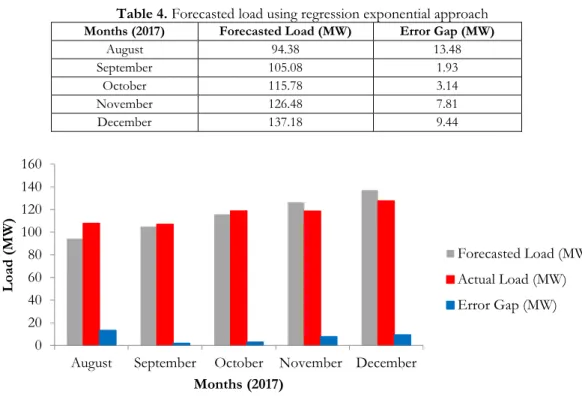
Substituting for X, say August (X= -2), September (X= -1) etc., the forecasted load with this approach is as presented in Table 4. A graphical comparison of the forecasted load obtained using least square approach with the actual monthly energy consumption alongside the error gap between the forecasted load and the actual load for the months of August to December, 2017 is shown in Figure 3. An appreciable gap error was observed in the months of August, November and December while the forecasted load and the actual load in the month of September and October is fairly the same.
0 20 40 60 80 100 120 140
August September October November December
L oad (MW ) Months (2017) Forecasted Load (MW) Actual Load (MW) Error Gap
I S S N : 2 6 3 6 - 6 0 7 X 13 | P a g e
Table 4. Forecasted load using regression exponential approach
Months (2017) Forecasted Load (MW) Error Gap (MW)
August 94.38 13.48 September 105.08 1.93 October 115.78 3.14 November 126.48 7.81 December 137.18 9.44
Figure 3. Comparison of forecasted load, actual load and error gap
The MAPE and RMSE computed for all the two approaches is as shown in Table 5, the approach with the least optimal values of MAPE and RMSE has the optimal solution. From the analysis, it is shown that least square approach (LSR) has the least values of MAPE and RMSE. The approach with the least value of MAPE and RMSE is best suited to make forecast. Linear regression approach is therefore employed for the forecast. The forecast for the months of July- December, 2018 is as shown in the Table 6.
Table 5. A comparison of MAPE and RMSE values for the LSA and REA
Techniques MAPE (%) RMSE
Least Square Model 1.8212 0.004472
Regression Exponential Model 6.1820 0.5769
Table 6. Load forecasted for the months of July-December, 2018 using LSA
Months (2018) No of Days 𝑿 Load Forecasted
𝒀(MW) Load forecasted (MWh) July 31 8 157.18 116,941.92 August 31 9 162.32 120,766.08 September 30 10 167.46 120,571.20 October 30 11 172.60 124,272.00 November 30 12 177.74 127,972.80 December 31 13 182.89 136,070.16
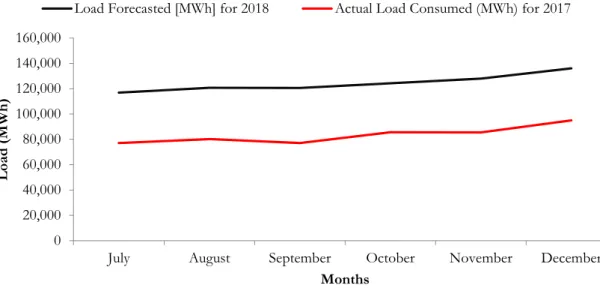
A substantial increase in load is anticipated based on the model used to forecast the expected load consumption in the state for the months of July-December, 2018 as compared with the monthly load consumption for 2017. Figure 4 presents a comparison of forecasted load for months under consideration in 2018 and the actual load consumed in 2017. The estimated percentage monthly load growth based on the least square approach used is as shown in the Figure 5.
0 20 40 60 80 100 120 140 160
August September October November December
L oad (MW ) Months (2017) Forecasted Load (MW) Actual Load (MW) Error Gap (MW)
Olabode et al./Journal of Advances in Science and Engineering. Volume 1 Number 2 (2018): 9-16
14 | P a g e I S S N : 2 6 3 6 - 6 0 7 X
Figure 4. A comparison forecast load for 2018 and actual load consumed in 2017
Figure 5. Percentage load growth (MW)
4. Conclusion
Performance evaluation of regression exponential and least square techniques on medium-term load forecasting: a case study of Ogun State, Nigeria was presented in this paper. Two different models were used to predict the expected load consumption for the entire state. Based on the results of the analysis, least square approach (LSA) gave the least value of MAPE and RMSE when compared with regression exponential approach. Having established the approach with least value of MAPE and RMSE, it was then employed to predict load consumption for months of July-December, 2018.
LSA used for the forecast revealed a significant load growth for each month, the percentage load growth was estimated to be 34.06%, 33.54%, 36.10%, 31.10%, 32.23% and 30.15% for the months of July-December respectively. The low percentage load growth in the month of December can be attributed to acute shortage in
gas supply caused by pipeline vandalisation and theft ofdistribution/sub-station materials. The results of this
research will in no small measure assist IBEDC, Ogun Region in making informed decision(s) concerning energy consumption pattern expected across the state for months under consideration.
Conflict of Interests
The authors declare that there is no conflict of interests regarding the publication of this paper. 0 20,000 40,000 60,000 80,000 100,000 120,000 140,000 160,000
July August September October November December
L
oad
(MW
h)
Months
Load Forecasted [MWh] for 2018 Actual Load Consumed (MWh) for 2017
26 28 30 32 34 36 38
July August September October November December
% L oad gr owth (MW ) Months
I S S N : 2 6 3 6 - 6 0 7 X 15 | P a g e Appendix
Table A. The monthly energy consumption in Ogun region grid in the year 2017
Ibadan Electricity Distribution Company:Ogun Region Year Grid 2017 Energy
Year 2017 Ijeun BH Olumo BH Ijebu Ode BH Sagagmu BH Ota BH Sango BH Total
January 5,624.13 7,356.30 7,073.00 11,241.70 17,392.57 12,039.00 60,726.70 February 6,302.97 7,549.87 6,742.00 14,666.30 17,949.95 10,966.80 64,177.89 March 5,736.42 6,852.44 6,673.00 13,851.30 16,386.00 8,619.90 58,119.06 April 7,189.02 7,027.60 8,241.00 11,520.60 18,241.73 11,943.80 64,163.75 May 7,985.02 8,965.36 7,787.00 14,078.80 19,348.91 13,254.80 71,419.89 June 9,749.24 9,364.32 7,824.00 12,837.10 18,768.55 14,459.10 73,002.31 July 9,649.95 9,631.27 8,805.00 18,169.60 17,691.58 13,204.10 77,151.50 August 8,189.82 9,183.75 8,839.00 22,389.60 18,963.74 12,684.90 80,250.81 September 8,267.31 8,975.48 11,167.00 16,137.70 19,613.15 12,888.60 77,049.24 October 7,677.64 8,967.76 10,319.00 25,527.40 19,132.61 13,998.90 85,623.31 November 8,037.68 9,046.83 11,778.00 19,692.85 20,833.14 16,057.60 85,446.10 December 9,745.67 11,155.85 9,081.00 25,918.28 22,621.59 16,518.00 95,040.39 Total 892,170.95 References
Amlabu, C.A., Agber, J. U., Onah, C. O., & Mohammed, S. Y. (2013). Electric load forecasting: a case study of the Nigerian power sector. International Journal of Engineering and Innovative Technology, 2(10): 23-27.
Brodowski, S., Bielecki, A. & Filocha, M. (2017). A hybrid system for forecasting 24-h power load profile for Polish electric grid.
Applied Soft Computing, 58, 527–539.
Chandra, S. H., & Satyanarayana, R. V. S (2013). Intelligent methods in load forecasting. International Journal of Electrical and Electronics Engineering Research and Development, 3(1):55-62.
Cheepati, K. R, & Prasad, T. N (2016). Performance comparison of short term load forecasting techniques. International Journal of Grid and Distributed Computing, 9(4): 287-302.
Cullen, K. A (1999). Forecasting electricity demand using regression and Monte Carlo simulation under conditions of insufficient data. Thesis submitted to the College of Agriculture, Forestry, and Consumer Sciences at West Virginia University, 1-137.
El, D. A, Aggarwal, R., Elkateb, M., & Li, F. (2001). Advanced hybrid genetic algorithm for short-term generation scheduling.
IEEE Proceedings Generation, Transmission and Distribution, 148 (6): 511-517.
Eneje, I. S., Fadare D. A., Simolowo O. E. & Falana, A. (2012). Modelling and forecasting periodic electric load for a metropolitan city in Nigeria. An International Multidisciplinary Journal, Ethiopia, 6(1): 101-115.
Germi, M. B., Mirjavadi, M., Namin, A. S. S. & Baziar, A. (2014). A hybrid model for daily peak load power forecasting based on SAMBA and neural network. Journal of Intelligent & Fuzzy Systems: Applications in Engineering and Technology, 27(2): 913–920. Gross, G. & Galiana, F. D. (1987). Short-term load forecasting, proceedings of the IEEE, 75, 1558-1573
Hu, R., Wen, S., Zeng, Z. & Huang, T (2017). A short-term power load forecasting model based on the generalized regression neural network with decreasing step fruitfly optimization algorithm. Neuro-computing, 221, 24–31.
Jianwei, M., Libin, F, Xuechao, D., & Yuanying, Q. (2018). Short-term power load forecasting method based on improved exponential smoothing grey model. Mathematical Problems in Engineering, 2018: 1-11
Li, H., Cui, L., & Guo, S. (2014). A hybrid short-term power load forecasting model based on the singular spectrum analysis and autoregressive model. Advances in Electrical Engineering, Vol. 2014, Article ID 424781, 1-7.
Lu, N. & Zhou, J. (2009). Particle swarm optimization-based RBF neural network load forecasting model, Power and Energy Engineering Conference, APPEEC 2009, 27-31 March 2009. Asia-Pacific, p.1-4
Minaye, E., & Matewose, M. (2013). Long term load forecasting of Jimma town for sustainable energy supply. International Journal of Science and Research, 5(2), 1500-1504
Okundamiya, M. S., & Okpamen, I. E. (2013). A linear regression model for global solar radiation on horizontal surfaces at Warri, Nigeria. International Journal of Renewable Energy Development, 2(3):121-126.
Okundamiya, M. S., Emagbetere J. O., & Ogujor, E. A. (2014). Assessment of renewable energy technology and a case of sustainable energy in mobile telecommunication sector. The Scientific World Journal 2014, Article ID 947281, 1-13.
Okundamiya, M. S., Emagbetere, J. O., & Ogujor E. A. (2016). Evaluation of various global solar radiation models for Nigeria.
International Journal of Green Energy, 13(5): 502-512.
Papaioannou, G. P., Dikaiakos, C., Dramountanis, A., & Papaioannou, P. G. (2016). Load forecasting using a hybrid manifold learning principal component model and comparison with classical statistical models (SARIMAX, exponential smoothing) and artificial intelligence models (ANN, SVM): the case of Greek electricity market. Energies, 9, 635-675.
Saab, S., Elie, B., & George, N (2000). Univariate modelling and forecasting of energy consumption: the case of electricity in Lebanon. Lebanese American University, Byblos, Lebanon.
Olabode et al./Journal of Advances in Science and Engineering. Volume 1 Number 2 (2018): 9-16
16 | P a g e I S S N : 2 6 3 6 - 6 0 7 X
Sadowruk, R., & Barbosa, E. (1999). Short-term forecasting of industrial electricity consumption in Brazil. International Journal of Forecast, 18, 215-224.
Singh, A. K., Ibraheem, Khatoon, S., Muazzam, M. D., & Chaturvedi, D. K. (2012). Load forecasting techniques and methodologies: a review. 2nd International Conference on Power, Control and Embedded Systems, 631-640
Volkan, S. E., & Huseyin, T. (2001). Forecasting the primary energy demand in Turkey and analysis of cyclic patterns, Hacettepe University, Ankara, Turkey.
Wang, B., Wang, D., & Zhang, S. (2016). Short-term distributed power load forecasting algorithm based on spark and IPPSO LSSVM. Electric Power Automation Equipment, 36(1): 117–122.
Yang, S. D., & Li, X. (2006). A new ANN optimised by improved PSO algorithm combined with chaos and its application in short-term load forecasting. International Conference on Computational Intelligence and Security, 945 – 948.
Yuansheng, H., Shenhai, H., & Jiayin, S. (2016). A novel hybrid method for short-term power load forecasting. Journal of Electrical and Computer Engineering, 2016-2020, Article ID2165324.