PPR592
Smartphone use while driving –
a simulator study
D Basacik, N Reed and R Robbins
Creating
the future of transport
PUBLISHED PROJECT REPORT PPR592
Smartphone use while driving
A simulator study
D. Basacik, N. Reed and R. Robbins
Prepared for: IAM (the Institute of Advanced Motorists)
Project Ref: 11111660 Quality approved: Dan Basacik (Project Manager) Nick Reed (Technical Referee)
This report has been produced by the Transport Research Laboratory under a contract with IAM. Any views expressed in this report are not necessarily those of IAM.
The information contained herein is the property of TRL Limited and does not necessarily reflect the views or policies of the customer for whom this report was prepared. Whilst every effort has been made to ensure that the matter presented in this report is relevant, accurate and up-to-date, TRL Limited cannot accept any liability for any error or omission, or reliance on part or all of the content in another context.
When purchased in hard copy, this publication is printed on paper that is FSC (Forest Stewardship Council) and TCF (Totally Chlorine Free) registered.
Contact details
TRLCrowthorne House Nine Mile Ride Wokingham Berkshire RG40 3GA Tel: +44 (0)1344 773131 Fax: +44 (0)1344 770356 Email: [email protected]
The Institute of Advanced Motorists
IAM House
510 Chiswick High Road LONDON
W4 5RG
Tel: +44 (0) 20 8996 9600 Fax: +44 (0) 20 8996 9601 Email: [email protected]
Chief Executive’s Foreword
Over the last few years mobile phones have become significantly more developed, allowing people to access social networking sites, browse the internet, use maps and play music. Complex applications can now be used on the move anywhere in the world, and as technology advances further we need to understand how it impacts on driver behaviour.
We know that driver errors contribute to the vast majority of road accidents, with in-car distractions such as mobile phones increasing the risks of careless driving. Evidence on in-car distractions needs to stay up to date with advances in technology, and research on the multiple uses of smartphones is now needed.
The IAM has commissioned this timely report from TRL (Transport Research Laboratory) to understand the risks of using smartphones to access social networking sites whilst driving. As the UK’s largest independent road safety charity, we are committed to original research, and this report provides clear and decisive results which we hope will contribute to the future of road safety.
The ban on using handheld mobile phones in 2003 was met with a mixed response, and enforcement continues to be an issue. However, this report clearly shows that using a smartphone to access social networking sites creates risks to drivers as serious as drink driving by repeatedly drawing a driver’s vision and attention away from the road.
All drivers should be aware of the risks they are taking when using any mobile whilst driving. Even drivers who refrain from making calls may be tempted to use a smartphone to check a message, map, update their status, or look for traffic updates. More needs to be done to educate drivers, and encourage safe behaviour.
Government and road safety organisations need to work together to highlight the issue of smartphones and challenge perceptions. Phone manufacturers and social network providers also have a key role to play in spreading the message. Attitudes to seatbelts and drink driving have changed dramatically over the last thirty years, and, with the right information, the use of smartphones could become a similar success story.
I would like to thank TRL for their sound and in-depth analysis in this report, and for their hard work in collating the results. I believe that this report is a valuable addition to the body of research on in-car distractions, helping to keep road safety analysis up to date with technological advances.
Simon Best Chief Executive IAM
1 Introduction 2
2 Literature review 3
2.1 Why worry about distracted driving? 3
2.2 Does mobile phone use while driving increase accident risk? 3 2.3 How does using a mobile phone affect driving? 3 2.4 What is known about smartphone use or social networking while
driving? 4 2.5 Research hypotheses 5 3 Method 6 3.1 Participants 6 3.2 Equipment 6 3.3 Familiarisation 7 3.4 Study design 7 3.5 Participant instructions 7 3.6 Route design 8 3.7 Smartphone task 10 3.8 Overall design 14 3.9 Trial procedure 15
3.10 Recorded simulator data 15
3.11 Visual behaviour 16
3.12 Questionnaire 16
3.13 Calculation 16
4 Results 17
4.1 Participants 17
4.2 Reaction time (RT) tasks 17
4.3 Analyses of driving performance while using a smartphone 18
4.4 Visual behaviour 23
4.5 Effects of driving on smartphone use 26
4.6 Subjective effects of smartphone use on driving performance 27
4.7 Patterns of mobile phone use 29
4.8 Perceptions of legality 33
4.9 Perceptions of relative risks of driving behaviours 35
5 Discussion 36
Executive Summary
A substantial body of research has shown that use of a mobile phone while driving leads to poorer driving performance. Previous research has covered different elements of telephone use, including hand-held and hands-free use while making a call and the reading and writing of text messages.
Mobile phones have recently undergone a substantial change and ‘smartphones’ have gained popularity. These devices allow users to take part in a much broader range of activities than traditional mobile phones, including browsing the web, emailing, social networking, and browsing and playing personal media. With ‘smartphones’ now becoming common in the commercial marketplace, more and more drivers are able to engage in a broad range of possible activities on their phone. There is a clear potential for motorists to be tempted to conduct these activities whilst driving a vehicle.
This study set out to investigate whether there was an effect of social networking using a smartphone on driving performance. Twenty-eight young male and female participants took part in the study and drove a driving simulator through the same test scenario twice: once while using a smartphone to interact with a social networking site, and once without this distraction. This experimental approach allowed potentially hazardous road situations to be designed and experienced twice, in complete safety.
The results of the experiment clearly show that participants’ driving performance was impaired by the concurrent smartphone task, and the smartphone task was also affected by driving. When compared with their driving performance without a smartphone:
• Participants were more likely to miss the reaction time stimuli while using their phone.
• When they did respond, reaction times to visual and auditory stimuli were found to increase by approximately 30% when using a smartphone to send and receive messages on a social networking site.
• They were unable to maintain a central lane position and this resulted in an increased number of unintentional lane departures.
• They were unable to respond as quickly to a lead vehicle gradually changing speed, thus driving at a more variable time headway.
• They spent between 40% and 60% of the time looking down while using a smartphone to write or read messages, compared with about 10% of the time looking down in the same sections of the control drive.
These results suggest that participants’ driving was impaired when they were using a smartphone to send and receive messages on a social networking site. The results of this study indicate that this reduction in driving performance is likely to have been a result of three different types of distraction: having to concentrate on the smartphone task (cognitive), holding the phone (physical), and the significant increase in time spent looking at the phone (visual) in order to interact with it. Although participants did reduce their speed, this was not enough to compensate for the poorer driving performance; even though they were driving more slowly, they were still unable to control the vehicle as well as they did when they were not using their smartphone.
1
Introduction
There is a substantial body of research that has shown the potential distraction posed to a driver by the use of a mobile phone. This research has covered different elements of telephone use, including hand-held and hands-free use while making a call (Burns et al., 2002, Strayer et al., 2006, Parkes et al., 2007) and the reading and writing of text messages (Reed and Robbins, 2008).
In recent years, however, mobile phones have undergone a substantial change and so-called ‘smartphones’ have gained popularity. Aside from making phone calls and sending text messages, these devices enable users to send and receive emails, connect to the internet to browse web pages, browse and play music and videos, social network and carry out a broad range of other activities. According to Ofcom, smartphone sales accounted for 48% of all mobile phone sales in the UK in the first quarter of 2011 (Ofcom, 2011). With ‘smartphones’ now becoming common in the commercial marketplace, more and more drivers are now able to engage in a broad range of possible activities on their phone. There is a clear potential for motorists to be tempted to conduct these activities whilst driving a vehicle.
Furthermore, even for the more traditional calling and texting functions of a phone, smartphone interfaces are significantly different to mobile phone interfaces from five to ten years ago. For example, many smartphones have touchscreens rather than keypads (Canalys, 2010), and with increasing functionality come the issues of device and menu complexity. Such interface issues are likely to change how people use the device and therefore how distracting it is to use the device while driving.
From the findings of research looking at more traditional aspects of mobile phone use in a vehicle, it is likely that smartphone use in a vehicle would pose a distraction and lead to a detriment in driving performance. What is not clear is the extent to which performance would be expected to decrease.
This report describes a study that has investigated the effects of using a smartphone for social networking while driving using a high-fidelity driving simulator. Chapter 2 presents a review of the literature on the use of mobile phones while driving and gives some background to the study, whilst Chapters 3 through 5 present the method, results and findings of the driving simulator study.
2
Literature review
2.1
Why worry about distracted driving?
In recent decades driver distraction has been a popular research topic and continues to receive significant attention. Two main factors are likely to be driving ongoing research. Firstly on-road studies are showing just how salient a factor distraction is in crashes. In NHTSA’s 100-Car Naturalistic Driving Study, participants were given an instrumented vehicle to drive instead of their own vehicle. The resulting dataset included 43,000 hours of driving (approximately 2 million vehicle miles) and showed that engagement in a secondary task contributed to more than 22% of all crashes and near-crashes that were recorded in the study period (Klauer et al., 2006).
The second reason is that the potential for drivers to be distracted is increasing as technology develops. More recent sources of distraction outside of the vehicle include motion picture advertising billboards (Chattington et al., 2010), while smart phones and systems built into the vehicle give the driver the opportunity to engage with email, social networking sites, music collections and to conduct a range of other activities.
Thus, an improved understanding of distraction as a contributory factor to crashes, and an awareness of the increasing potential for drivers to be distracted by technology are driving research efforts in this area.
2.2
Does mobile phone use while driving increase accident risk?
Data from the 100-car study (Klauer et al., 2006) shows that distraction is associated with accidents but does not distinguish between different distractors.
An earlier study examining the mobile telephone records belonging to 699 drivers involved in car accidents (with property damage only) showed that the risk of collision increased fourfold with mobile phone use (Redelmeier and Tibshirani, 1997). Relative risk of collision was 1.3 times higher if calls were made up to 15 minutes before the collision and this figure rose to 4.8 times higher if a call was placed within 5 minutes of the collision (Redelmeier and Tibshirani, 1997). Interestingly this study found no difference in accident risk between those having hand-held and hands-free mobile phone conversations, suggesting that the risk of collision isn’t related to holding the phone. The results of this study indicate that having a mobile phone conversation while driving increases crash risk.
2.3
How does using a mobile phone affect driving?
Studies conducted on-road or in laboratory settings have looked closely at the particular effects that mobile phone use has on the performance of activities required for driving. They have concluded that mobile phone use is associated with:
• Increased ratings of mental workload (Parkes et al., 2007; Lesch & Hancock, 2004; Harbluk et al., 2002; Burns et al., 2002; Parkes et al., 1993)
• A reduction in people’s perceptual visual fields by up to 10% (Maples et al., 2008)
• Longer glances ahead, at the expense of other monitoring behaviours such as checking the mirrors and vehicle instruments (Parkes et al., 2007; Harbluk et al., 2002)
• Poorer awareness of and response to the traffic situation (Parkes et al., 2007, Parkes and Hooijmeijer, 2000) despite longer glances ahead
• Slower detection of and responses to hazards (Caird et al., 2008)
• A reduction in speed in an attempt to compensate for the perceived impairment caused by using a phone (Reed and Robbins, 2008; Burns et al., 2002)
This list shows how driving performance can suffer when people are given the additional task of using a mobile phone.
Interestingly, driving simulator studies have also shown that for some performance measures, hands-free mobile phone conversations can reduce driving performance as much as hand-held mobile phone conversations. For example, Parkes et al. (2007) concluded that mobile phone use delayed reaction times when compared with a control condition, and also when compared with a condition in which participants were at the UK legal limit for drink-driving, yet there was no statistically significant difference between the hand-held and hands-free mobile phone conditions.
When taken together with the studies described in Section 2.2, a clear conclusion is that having a mobile phone conversation while driving impairs driving performance.
2.4
What is known about smartphone use or social networking while
driving?
This review has not found research looking at the effects of smartphone use for social networking on driving. However, it is possible to make high-level predictions based on studies which have looked at other devices or tasks that are in some ways similar. Reading a message received through a social networking application on a smartphone may be similar to reading a text message received on an ordinary mobile phone. Reed and Robbins (2008) investigated the effects of reading and writing text messages on driving performance. When reading a text message, participants took longer to respond to stimuli, and were less able to keep to the centre of their lane or at a fixed distance behind a lead vehicle. Similar findings are also reported by Cooper et al. (2011) who studied driving performance while texting. Their experiment was carried out on a test track and the authors report significantly slower responses, more missed response events, reductions in speed, poor lane keeping and fewer glances ahead while texting. Writing a message on a social networking site could be comparable with writing a text message. The studies carried out by Reed and Robbins (2008) and Cooper et al. (2011) found that writing a text message on a mobile phone had an even greater effect on driving performance than reading a message. All of the participants used mobile phones with ordinary push-button keypads in the former study, and although a wider variety of phone interfaces were used in the latter, no analysis of these differences is presented. Owens et al. (2010) examined driving performance while text messaging using handheld and in-vehicle systems. Participants used either a phone with a standard keypad or a touch screen but differences between groups were not reported.
Johnson (2011) highlights perceptual issues which affect how efficiently people can use touchscreens for data entry. He argues that while it is possible for people to learn to touch type without looking at a keyboard, the smooth surfaces of touch screens prevent people from being able to feel the location of keys, and therefore interactions require visual input. Sears (1991) found that participants in his study were able to type on
average 58 words per minute on a standard keyboard, but only 25 words per minute on a touchscreen keyboard with the same layout.
Keyboard and key size have a significant effect on typing speed. An experiment by Sears et al. (1993) has shown that both novice and experienced participants were able to type more quickly on a larger touchscreen keyboard with larger keys, than a smaller keyboard with smaller keys. The keyboards used in this study ranged from 6.8 to 24.6cm wide. Tsimhoni et al. (2002) gave participants of their study the task of entering an address into a satellite navigation system while driving. Participants used three methods to enter the address; two of these used speech recognition and one used a touch screen keyboard on a 7 inch screen (this, compared with the 3.5 inch screen on the iPhone 4, not all of which is taken up by a keyboard). Keys were 12.7mm high by 12mm wide, and spaced 0.7mm apart. The study showed that the speech recognition systems were clearly favourable; people were able to complete address entry much more quickly and were able to keep closer to the centre of their lane, suggesting that manual text entry on the touch screen was a distracting task.
In summary, the literature seems to suggest that reading text on a mobile phone leads to poorer driving performance. One would expect this to hold true when using a smartphone for social networking. There is also evidence to suggest that text entry on a mobile phone distracts from the driving task. Furthermore, there are suggestions that use of touch screens for text entry brings with it issues that could exacerbate the problem.
2.5
Research hypotheses
Based on this literature it is possible to come up with some predictions about driving performance while using a smartphone for social networking. These predictions form the research hypotheses to be investigated during the driving simulator study:
• Participants will drive more slowly when they are using a smartphone
• Participants’ reaction times will be slower when using a smartphone
• Participants’ lane position will vary more while using a smartphone
• Participants will spend more time looking inside the vehicle while using a smartphone
• Participants will report that their driving was worse while using a smartphone The method used during this study is described in Chapter 3. It is based heavily on that used by Reed and Robbins (2008), which itself is based Burns et al. (2002), enabling comparison of the extent of driver impairment with previous studies.
3
Method
3.1
Participants
Twenty-eight participants were recruited from the TRL participant database to take part in the study, with an approximately even split between males and females. They met the following criteria in order to be included in the study:
• Participants described themselves as regular users of Facebook on smartphones
• Participants had the Facebook app on their smartphone
• Participants were current owners of a touchscreen smartphone (iPhone or Android)
• Participants were aged between 18 and 25
• Participants drove more than 5000 miles per year
• Participants had experience of driving on a motorway
• Participants had driven the simulator before
• Participants successfully completed a familiarisation drive in the simulator Participants were required to use their own phones for the study.
3.2
Equipment
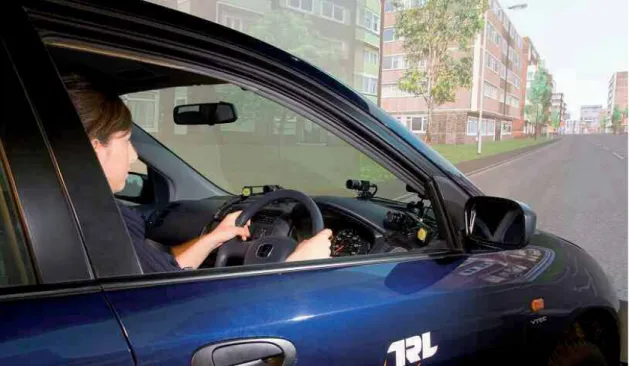
The TRL Driving Simulator (DigiCar) consists of a medium sized family hatchback (Honda Civic) surrounded by four 3 × 4 metre projection screens giving 210º front vision and 60º rear vision, enabling the normal use of the vehicle’s driving and wing mirrors. The road images are generated by four PCs running SCANeR II software (manufactured by Oktal) and are projected onto the screens by five Digital Light Processing (DLP) projectors. Images are refreshed at a rate of 60Hz (every 16.7msec) whilst data is sampled at a rate of 20Hz (every 50msec).
Electric motors supply motion with 3 degrees of freedom (heave, pitch and roll) whilst engine noise, external road noise, and the sounds of passing traffic are provided by a stereo sound system.
Two studies have demonstrated the validity of the TRL simulator (Duncan, 1995; Sexton, 1997) and Diels et al. (in press) confirm that the current simulator system is at least as accurate as that used in the Duncan and Sexton studies.
3.3
Familiarisation
Participants were required to complete a ten minute familiarisation drive on a benign motorway environment prior to completing any of the test drives. This was to help participants to become comfortable with controlling the simulator vehicle and driving in the virtual environment. The drive included a car following task in which participants were required to drive at a safe and constant distance behind a lead vehicle. During this task, white chevrons were included on the motorway (as used on some sections of UK motorways) helping the participant to judge a safe distance to the lead vehicle.
3.4
Study design
After familiarisation, participants carried out two drives:
• A smartphone drive in which they had to read and write messages and update their status using a social networking application
• A control drive along the same route, but without having to use a smartphone To counterbalance any learning effects caused by driving the same route twice, the order of these two drives was alternated between participants.
3.5
Participant instructions
Before the smartphone drive, participants were also instructed:
If participants asked whether they should put their phone in a specific place in the vehicle, they were advised that they should keep it wherever they normally would while they were driving.
3.6
Route design
The simulator route driven by participants consisted of four sections with smooth naturalistic transitions between each section. These are shown in Table 1.
During this drive you will be asked to send and receive private messages on Facebook and update your Facebook status. Your contact for all of the private messages is Daniel Boyd, who we added as your Facebook friend earlier. Please only
send and read messages when you are asked to. Please write messages as you normally would, ie using short words and predictive text.
Please adjust the seat position and secure the safety belt. The car controls work in the same manner as any normal car and it operates with a manual gearbox. You need to make sure the car is in neutral when you start it and it needs plenty
of revs, otherwise it has a tendency to stall.
It is important that you drive as you would normally. We don’t want you to drive as if you are on a driving test nor as if the simulation is a computer game. We are
not here to judge your driving, so please do not feel anxious.
A red bar like the one you can see on the screen now will appear during your drive. There is also a buzzing noise that will sound during the drive. When you hear the buzzing noise, or see the red bar please press the clutch pedal as quickly
as you possibly can. You will hear the buzzing sound about 20 seconds into this drive as a practice to help you recognise it.
The drive will start on the motorway with normal traffic. After a while, the motorway will end and you will reach a series of bends. You should try to keep to
40 mph through this section and the simulator will assess your ability to keep to the centre of your lane through the bends.
After the series of bends, you will drive on the motorway again. After a period of time you will see a vehicle in front of you. Please pull up behind this vehicle and
follow it, doing your best to keep at a safe and constant distance behind it. A voice instruction will let you know when the car following task has finished.
Table 1: The road sections used for the simulator trial
Section Description Length Configuration
1 Motorway 1 17.5 miles 3 lane motorway plus hard shoulder in each direction. Light traffic present
2 Two loops 4.6miles
Each loop is a two-lane ‘figure 8’ with a long left turn and long right turn separated by a short straight
3 Car following 8.1 miles
3 lane motorway plus hard shoulder in each direction. One vehicle present that the participant is required to follow at a steady distance
4 Motorway 2 7.3 miles 3 lane motorway plus hard shoulder in each direction. Light traffic present
Total 37.5 miles
In the loops section, participants were instructed to try to stay in the centre of their lane and to drive at 40mph.
In the car following section, participants were instructed to follow the lead vehicle at safe and constant distance (as they would have experienced in the familiarisation drive). The lead vehicle smoothly and repetitively increased and decreased its speed between 43.8mph (70kph) and 68.8mph (110kph) over a period of 20 seconds.
3.6.1 Reaction time events
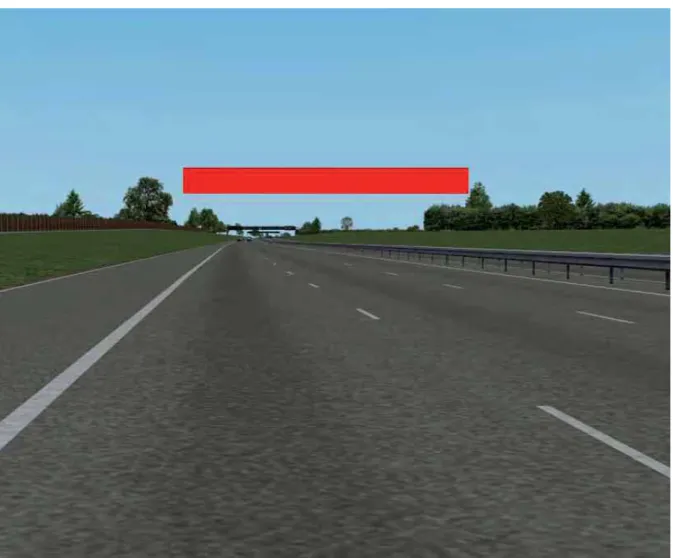
During both the smartphone and control drives, participants were required to respond to trigger stimuli on four occasions in order to test their reaction times. In three of the reaction events, the trigger stimulus was a short auditory tone (60dB; 0.45 seconds duration; 333Hz). The fourth reaction time trigger event was the presentation of a red bar stimulus above the carriageway and ahead of the driven vehicle across all motorway lanes. This is shown in Figure 2.
Figure 2: Red bar stimulus
Participants were instructed to respond by depressing the clutch pedal as quickly as possible. Clutch depression is measured from 0 (foot off clutch) to 1 (clutch fully depressed). The threshold for clutch activation was 0.1 (10% clutch depression). If clutch depression was greater than 10% at the time of the reaction time trigger, the event would have been ignored but this did not occur in any of the trials. If participants failed to respond within 10 seconds, this was treated as a missed event.
3.7
Smartphone task
The research brief was to use a social networking task. This would serve the purpose of straying beyond the functionality of a standard mobile phone whilst still requiring participants to take part in written communication, as one would when sending and receiving text messages.
3.7.1 Choice of social networking application
A plethora of applications are available which allow users to access many websites via their smartphones. For the current study, we conducted market research to identify a widely used social networking application. This was to ensure the secondary task used in the experiment was representative of real-world usage.
Table 2 shows which mobile applications were most widely visited by UK mobile consumers in April 2011. The data show that nearly 8.8 million UK mobile owners used
an app that connected to the internet during April 2011, with Google Maps ranking as the most accessed app with 6.4 million unique users. It can be seen that the social networking application ‘Facebook’ was ranked as the third most often used application. Other popular social networking applications such as ‘LinkedIn’ or ‘Twitter’ did not feature in the top 10.
Table 2: Connected Mobile Applications Ranked by Unique Visitors (from Comscore, 2011)
Rank Mobile app Total unique visitors
1 Google Maps 6,419,503 2 Yahoo! Weather 3,567,047 3 Facebook 3,456,442 4 Google Mobile 2,554,329 5 YouTube 2,438,348 6 eBay 1,195,496
7 Sky Sports Live Football Score Centre 1,004,085
8 Yahoo! Stocks 959,289
9 WhatsApp Messenger 798,656
10 Sky News 732,374
Total connected app users: 8,735,197
Figure 3 shows the demographics of Facebook users. It can be seen that for all age categories, there tends to be approximately an equal split between male and female users with slightly more female users. Furthermore, the figure shows that Facebook use is biased towards the younger age categories. In the context of the current study, it is of relevance to point out that motorists under 24 years of age are overrepresented in the accident statistics (DfT, 2011). Hence, the issue of smartphone use by younger drivers is of particular relevance.
On the basis of the above information, ‘Facebook’ was chosen as an appropriate application to be used in the experimental study.
Figure 3: UK Facebook users split by age and gender (Sources: Facebook, Alexa, June 2010)
Age
(yea
rs)
3.7.2 Choice of smartp
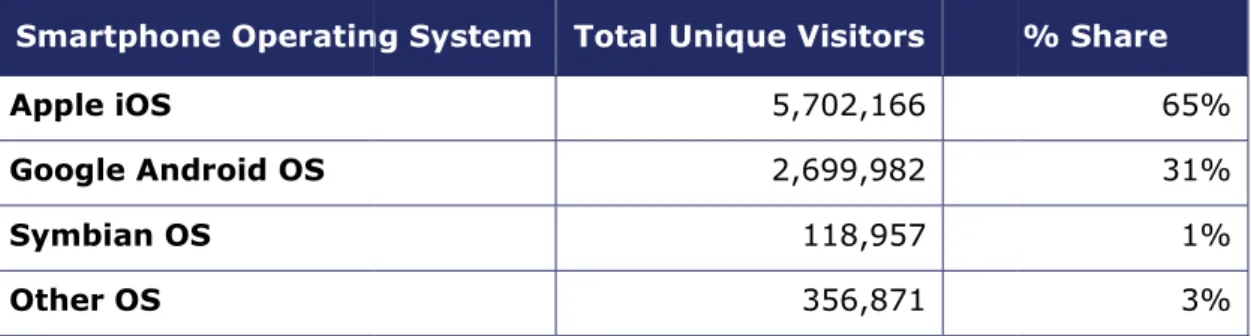
Table 3 shows the percentag Apple and Google Android similarity in both functional Apple and Android, the exp operating systems (OS).
Table 3: Share (%) of Co S Smartphone Operatin Apple iOS Google Android OS Symbian OS Other OS
Figure 4 shows the Faceboo operating systems. It can be Apple OS provides slightly m homepage. In selecting the those related to these three
Figure 4: Sample screen An
phone operating system
ge of users for the different smartphone o account for 96% of the market share ity and user interface of the Facebook ap periment allowed participants to partake
onnected Application Users by Smartph System (from Comscore, 2011)
ng System Total Unique Visitors
5,702,166 2,699,982 118,957 356,871
k home page on the Apple (left) and Goog e seen that the application is similar on bot more functions (“Chats” “Groups” “Places”) e tasks to be completed by participants
functionalities were excluded.
nshot of the Facebook home page on A droid (right) operating systems
operating systems. . Because of the pplication on both with either of the
hone Operating % Share 65% 31% 1% 3%
gle Android (right) th OS whereby the ) on the Facebook during the study,
3.7.3 Facebook tasks whilst driving
Through the course of the drive participants were required to perform a succession of different tasks using the Facebook application. Participants were asked to become Facebook ‘friends’ with a ‘Daniel Boyd’, whose account was used by experimenters to send messages to participants and receive messages from them during the smartphone drive.
3.7.3.1 Writing messages
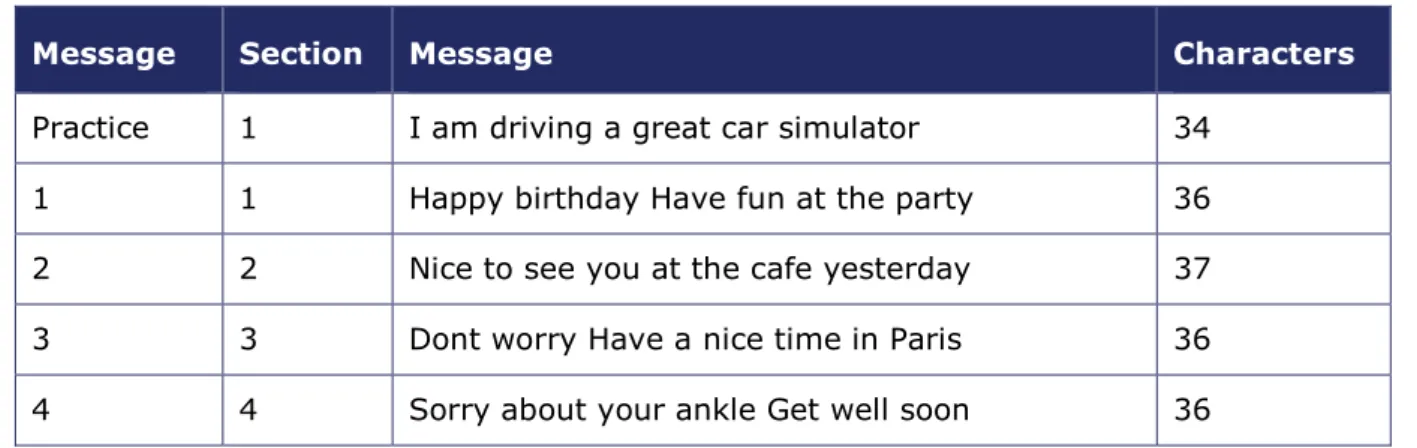
Participants had to write five messages in the drive. All comprised an approximately similar number of characters. The instructions as to what to write and the message recipient were delivered as automated verbal messages in the simulation. Participants were instructed to compose the text in their own usual style. This included using predictive text, autocorrect and applying SMS language. The first message was included as practice to ensure participants were comfortable what was required of them.
Table 4 shows the messages that participants were required to compose.
Table 4: Messages composed by participants whilst driving
Message Section Message Characters
Practice 1 I am driving a great car simulator 34 1 1 Happy birthday Have fun at the party 36 2 2 Nice to see you at the cafe yesterday 37 3 3 Dont worry Have a nice time in Paris 36 4 4 Sorry about your ankle Get well soon 36
3.7.3.2 Reading messages
Participants were sent two messages over the course of their drive. Participants were informed by an automated voice instruction that they were about to receive a message and that they would need to read the message in order to be able to answer the questionnaire at the end of the drive. Table 5 shows the messages that participants received.
Table 5: Messages received by participants whilst driving
Message Section Message
1 1 Edward has forgotten his BOWTIE for the wedding 2 2 Fiona won the SILVER medal in the 100m sprint
3.7.3.3 Updating Facebook status
In addition to writing and reading messages, participants were also asked to update their Facebook status. Table 6 shows the section and text for the status update.
Section Text
3 I am near
3.7.3.4 Control message To compare how quickly pa participants were timed com they were not driving. These
Table 7: Timed message
Message
Best of luck for your driving Well done Looking forward to Please can you bring red win Where did you get those new
3.8
Overall design
Figure 5 shows the incidence the smartphone drive. Note drive with the exception that
Figure 5: Schematic timel
Table 6: Status update text
Ch
r the end of the virtual world 38
es
rticipants could write short messages on mposing some comparable text on their e were as follows:
es composed by participants without d driving)
test today o the wedding ne tonight w trousers
e of social networking tasks and reaction ti that the control drive is exactly the same a t participants were not required to interact
ine of events in the drive
haracters 8 their smartphone, smartphone when distraction (i.e. Characters 40 40 37 36 ime (RT) events in as the smartphone
3.9
Trial procedure
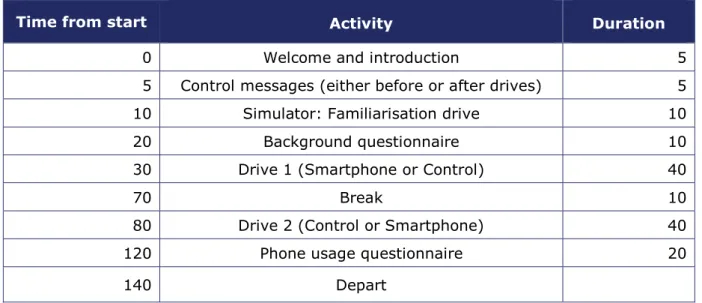
The trial proceeded as shown in Table 8.
Table 8: Trial procedure and schedule
Time from start Activity Duration
0 Welcome and introduction 5
5 Control messages (either before or after drives) 5 10 Simulator: Familiarisation drive 10
20 Background questionnaire 10
30 Drive 1 (Smartphone or Control) 40
70 Break 10
80 Drive 2 (Control or Smartphone) 40
120 Phone usage questionnaire 20
140 Depart
3.10
Recorded simulator data
Table 9 shows the data recorded by the simulator. All data was recorded at 20Hz.
Table 9: Data recorded by the simulator
Data Notes
Time Time elapsed since the start of the trial
X position of interactive vehicle The X position of the interactive vehicle within the map of the simulated environment.
Y position of interactive vehicle The Y position of the interactive vehicle within the map of the simulated environment.
Z position of interactive vehicle The Z position of the interactive vehicle within the map of the simulated environment.
Speed Current speed of the interactive vehicle
Distance through trial Distance travelled by participant relative to the start of the virtual road
Lateral distance from centre of road
The distance of the centre of the interactive vehicle from the centre of the road
Headway The distance headway between the interactive vehicle and the back of any vehicle ahead.
Time Headway The time headway between the interactive vehicle and the back of any vehicle ahead.
Accelerator pedal Current proportion of accelerator pedal depression. Brake pedal Current proportion of brake pedal depression. Clutch pedal Current proportion of clutch pedal depression. Steering wheel Current angle of steering wheel rotation
3.11
Visual behaviour
In addition to the simulator data, a video of participants’ faces was recorded during the drive in order to analyse visual behaviour. Videos coding took place as follows.
The coders skipped to the points in each smartphone drive where the automated voice instruction ended. From there, they watched the video at (at least) half speed, using a stopwatch to record:
• Total time spent looking down (this does not distinguish between looking at the phone or other parts of the in-vehicle environment)
• Total time spent looking up (ie at the road, mirrors, etc)
• Duration of interaction with phone (sum of the above)
Smartphone interaction was assumed to finish if the participant looked ‘up’ for at least five consecutive seconds.
The same locations of each participant’s control drive were also coded.
3.12
Questionnaire
A post-trial questionnaire was also administered in order to record participants’ perceptions of their riving performance and opinions about mobile phone use while driving.
3.13
Calculation
Data processing was conducted using Microsoft Excel 2007 and statistical analysis took place using SPSS 19.0. In all statistical tests p values of less than 0.05 were taken to be significant. Where shown, error bars indicate the 95% confidence interval of the mean.
4
Results
4.1
Participants
Twenty-eight participants took part in the study. Twelve were female and sixteen were male. Participants were aged between 18 and 26 years (M=22.4, SD = 2.32). Only participants who used Apple or Android phones with touchscreen keypads and who described themselves as being regular users of the Facebook application on their smartphone were selected.
4.2
Reaction time (RT) tasks
During each drive in the simulator, participants were asked to respond to three auditory tones and a red bar visual stimulus by pressing the clutch pedal as quickly as possible. In the smartphone drive these stimuli coincided with social networking tasks:
• Auditory reaction time task 1 coincided with Read message 1 in section 1
• Auditory reaction time task 2 coincided with Write message 2 in section 2
• Auditory reaction time task 3 coincided with Update status in section 3
• Visual reaction time task coincided with Write message 4 in section 4
In the control drive, participants were given no social networking tasks to coincide with the reaction time tasks. Thus, a comparison between the two drives was possible.
4.2.1 Response rate
Data for 220 reaction time tests were collected; 112 from participants’ control drives and 108 from their smartphone drives. Participants failed to respond to three of these tests during the control drive, and 10 of the tests during the smartphone drive. These differences are statistically significant (Fisher’s exact; p=.047) suggesting that participants were more likely to fail to respond to reaction time stimuli while using their smartphone. In real driving scenarios this has implications for drivers’ responses to hazardous situations, and suggests that drivers may miss warnings or hazards.
4.2.2 Reaction times
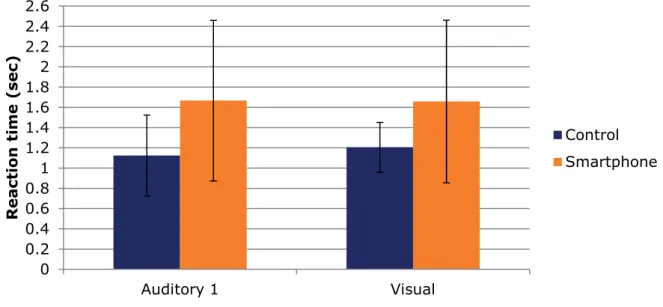
On occasions where participants did respond to the auditory or visual stimuli, their reaction times tended to be slower during the smartphone drives. Auditory 1 was triggered during a read message task, Auditory 2 during a write message task, Auditory 3 during a status update task and the Visual stimulus during a write message task.
Figure 6: Mean reaction times
Paired samples t-test comparisons show that differences were statistically significant for two pairs of the reaction time tests: Auditory 1 (t(24) = -2.242, p=.035) and Visual (t(22) = -3.478, p-.002). Figure 6 illustrates these differences. These results suggest that using a smartphone for social networking while driving can slow drivers’ responses to events taking place on the road. The differences in reaction times between the two drives were not statistically significant for Auditory 2 or 3.
4.3
Analyses of driving performance while using a smartphone
Participants were asked to interact with their phone on seven separate occasions during their social networking drive. On four occasions they were asked to write a pre-defined message, they were instructed to read messages on two occasions and they were also asked to update their Facebook status.
As participants drove the same route in their control drives, it was possible to compare driving performance in the sections where participants were interacting with their smartphone, with driving performance at the exact same locations in the control drive. Four key measures of driving performance were taken:
• Mean speed
• Standard deviation of speed (an indication of how variable speed was)
• Standard deviation of lane position (an indication of variability of lateral position)
• Maximum speed
For one section of the route, in which participants wrote their third message while following a lead vehicle, the time headway between the driven vehicle and the lead vehicle was also calculated.
The instructions to interact with their smartphone were pre-recorded and played at exactly the same point along the route for each participant. As it was difficult to ascertain the precise point at which participants started and finished using their phone, the following assumptions were made to define the sections for analysis:
0 0.2 0.4 0.6 0.8 1 1.2 1.4 1.6 1.8 2 2.2 2.4 2.6 Auditory 1 Visual Rea cti on ti me (sec) Control Smartphone
• Smartphone interaction was assumed to start at the moment the pre-recorded instruction ended
• Smartphone interaction was assumed to end if participants looked up at the road for an uninterrupted duration of at least 5 seconds
Statistically significant differences in driving performance are described below.
4.3.1 Mean speeds
Participants were instructed to write their first and fourth messages while driving in light traffic along a motorway, their second message while following a series of curves at 40mph and their third message while following a lead vehicle at a constant distance. Figure 7 shows participants’ mean speeds during these smartphone episodes.
Figure 7: Mean speeds during smartphone episodes
On average participants drove more slowly when writing messages on their smartphone while driving (Write 1: t(23)=2.238, p=.035; Write 2: t(22)=2.626, p=.015; Write 3: t(26)=2.134, p=.042; Write 4: t(25)=2.057, p=.05). This is consistent with previous research which suggests that participants slow down in order to compensate for the perceived impairment of using a phone while driving (see Chapter 2).
The difference in mean speeds for the two drives were not statistically significant for the message reading or status update tasks.
4.3.2 Standard deviation of speed
Participants’ speed varied more in two sections of the smartphone drive when compared with the control drive. These were while writing their fourth message (on a motorway in light traffic) and updating their Facebook status (while following a lead vehicle whose speed varied). Figure 8 shows these differences.
10 20 30 40 50 60 70 80 90
1st written 2nd written 3rd written 4th written
Mean
speed
(mph)
Control Smartphone
Figure 8: Standard deviation of speed during smartphone episodes
Paired samples t-tests confirmed that these results were statistically significant (Write 4: t(25)=-2.305, p=.03; Update status: t(26)=-2.736, p=.011), suggesting that participants were slowing down and speeding up more while using a smartphone.
4.3.3 Standard deviation of lane position
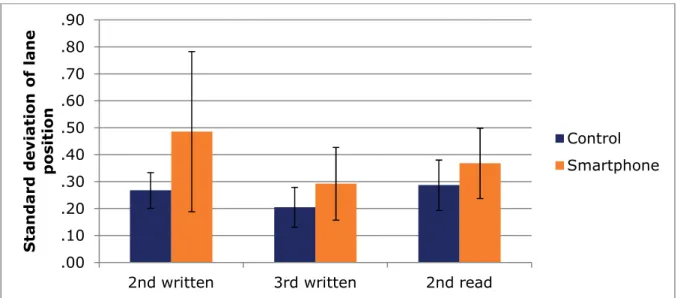
Participants were asked to write their second message and read the second message sent to them while following a curved section of road. They were asked to drive at 40mph and in the centre of their lane. While carrying out these smartphone tasks their lane position varied more than in the same section of the control drive. The same happened when they were writing their third message while following a lead vehicle on a motorway. These differences are shown in Figure 9.
Figure 9: Standard deviation of lane position during smartphone episodes
Paired samples t-tests were conducted and the results showed that these differences were statistically significant (Write 2: t(22)=-3.598, p=.002; Write 3: t(26)=-4.539,
.0 .5 1.0 1.5 2.0 2.5 3.0 3.5 4.0 4.5 5.0
4th written Status update
Control Smartphone .00 .10 .20 .30 .40 .50 .60 .70 .80 .90
2nd written 3rd written 2nd read
S tandard dev iat ion o f lane posit ion Control Smartphone
p=.000; and read 2: t(26)=-5.114, p=.000). No significant differences were found for other smartphone tasks.
Further calculations were carried out to investigate the consequences of participants’ poor lane-keeping. It was found that participants crossed over the lane markings 26 times while using their smartphone to write the second message, but kept within their lane at all times during their control drive. This is shown in Figure 10.
Figure 10: Number of lane excursions during 2nd written message
While writing their third message, participants crossed the lane markings four times, but did not cross the lane markings in the same section of the road during their control drive. They did not cross the lane markings at all while reading a message sent to them. The deterioration in lateral control is consistent with results from other studies (see Chapter 2) which have looked at the effects of distracted driving. This suggests that driving while using a smartphone to write messages could pose a significant threat to the safety of vehicles in adjacent lanes.
4.3.4 Maximum speed
The maximum speed that participants reached during each smartphone episode was calculated but no significant differences emerged between these speeds and the highest speeds reached in the same sections of the control drive.
4.3.5 Time headway
Calculations were also made to understand how well participants were able to follow the lead vehicle while writing their third message. The results showed no difference in mean time headway or the shortest time headway observed, but did show a difference in how variable participants’ time headway was (t(26)=-3.291, p=.003).
0 26 excursions, 5 participants 0 5 10 15 20 25 30 Control Smartphone Number of lane e x c ursions
Figure 11: Standard deviation of time headway
Figure 11 shows that time headway varied significantly more during the smartphone drive, suggesting that participants were less able to respond to its changing speed. This finding is consistent with the reaction time data, which also suggests poorer responses to stimuli in the environment.
4.3.6 Gender differences
The sample of drivers tested contained an approximately equal number of males and females. Thus, it was possible to investigate the relative effects of the smartphone tasks on the driving performance of male and female participants. Repeated measures ANOVA tests were carried out, with gender as a between-subjects factor.
In general, the data showed that there was a statistically significant difference between males and females in the following measurements:
• Standard deviation of time headway during the 3rd written message (F(1,25)=4.909, p=.003)
• Mean speed for write 4 only (F(1,19)=4.762, p=.042)
• Standard deviation of lane position during write 2 (F(1,21)=4.372, p=.049), write 3 (F(1,21)=4.520, p=.046) and read 2 (F(1,25)=11.876, p=.002)
• Standard deviation of speed during update message (F(1,25)=10.357, p=.004) Key statistics in relation to these measures are presented in Table 10.
.00 .50 1.00 1.50 2.00 2.50 3.00 Control Smartphone S tandard dev iat ion o f headway
Table 10: Performance of males and females on key measures of driving performance in each drive
Females Males
Measure Drive Section N Mean SD N Mean SD
SD time
headway Smartphone Write message 3 12 .97 .56 16 .48 .27 SD time
headway Control Write message 3 11 1.92 1.86 16 1.14 .76 Mean speed Smartphone Write message 4 11 71.22 3.10 16 74.49 5.05 Mean speed Control Write message 4 11 65.75 8.22 16 73.03 6.18 SD Lane Pos Smartphone Write message 2 10 .29 .07 14 .25 .06 SD Lane Pos Control Write message 2 9 .63 .44 14 .40 .10 SD Lane Pos Smartphone Write message 3 12 .25 .08 16 .17 .04 SD Lane Pos Control Write message 3 11 .37 .17 16 .24 .07 SD Lane Pos Smartphone Read message 2 12 .33 .09 16 .26 .08 SD Lane Pos Control Read message 2 11 .47 .14 16 .30 .07 SD Speed Smartphone Update message 12 2.42 1.09 16 1.69 .93 SD Speed Control Update message 11 3.33 1.08 16 2.20 .88
The results indicate that for these sections males tended to reduce their speed less, not vary their lateral position, distance from the lead vehicle or speed as much as females did. Thus, on these measures of performance, females did not perform as well as males. Differences between the driving performance of males and females were not statistically significant for any of the other measurements taken.
An interaction effect of drive and gender was found for only one of these variables: standard deviation of lane position during the second read message task (F(1,25)=11.582, p=.002). This suggests that the smartphone task affected males differently to females, with females’ performance deteriorating more than that of males.
4.4
Visual behaviour
A video recording of each participant was taken during the drive and this made it possible to observe their visual behaviour. Of particular interest were the sections of the smartphone drive in which participants were interacting with their phone, and the same locations in the control drive. The video was coded to compute the following variables for each smartphone episode:
• Total time spent looking down (this does not distinguish between looking at the phone or other parts of the in-vehicle environment)
• Total time spent looking up (ie at the road, mirrors, etc)
On average, participants spent 28.36 seconds per smartphone episode looking down when compared with an average 5.1 seconds looking down in the same sections of the control drive. Table 11 shows how this breaks down across all episodes of smartphone use and also gives the same information about the comparable sections of the control drive.
Table 11: Amount of time (in seconds) spent looking down during the messaging section of the smartphone drive and equivalent section of the
control drive (note: message completion times not equal)
Drive Smartphone
episode N Minimum Maximum Mean
Std. Deviation S m a rt p h on e Write 1 24 14.14 46.99 31.34 10.37 Read 1 26 2.42 40.81 16.25 10.08 Write 2 27 5.90 77.91 30.73 14.76 Read 2 25 4.60 36.32 12.55 7.68 Update 27 20.02 92.54 41.55 14.97 Write 3 27 20.64 66.33 34.47 11.52 Write 4 27 15.90 119.52 30.40 20.28 C o n trol Write 1 20 .91 10.23 4.68 2.31 Read 1 19 .00 8.74 3.50 2.75 Write 2 25 .00 20.00 6.83 4.45 Read 2 27 .00 13.65 3.07 3.19 Update 27 .00 27.11 6.53 5.62 Write 3 27 .00 14.54 4.59 3.17 Write 4 27 .00 15.13 4.51 3.58
It can be seen that on average, participants spent longer looking down during sections of the smartphone drive. Figure 12 displays the time participants spent looking down as a percentage of the time they were interacting with the phone during that episode of phone use. This accounts for the fact that each smartphone episode lasted a different length of time.
Figure 12: Percentage of time spent looking down during the messaging section of the smartphone drive and equivalent section of the control drive
It is clear that on average, participants spent between 40% and 65% of their time looking down during smartphone episodes, when compared with under 15% of time when not using a smartphone. Paired samples t-tests were used to investigate whether these differences in visual behaviour between the smartphone and control drives were statistically significant. Table 12 shows that for all smartphone episodes, the differences were highly statistically significant. Participants spent much longer looking down when using a smartphone than when not using a smartphone.
Table 12: Results of statistical test comparing the percentage of time spent looking down Smartphone Mean (SD) Control Mean (SD) df t p Write 1 55.3% (9.0%) 9.0% (4.3%) 19 21.275 .000 Read 1 48.5% (11.4%) 7.9% (6.7%) 21 15.483 .000 Write 2 46.6% (12.9%) 10.6% (6.4%) 24 13.300 .000 Read 2 42.5% (10.2%) 12.0% (9.5%) 23 11.074 .000 Update 62.2% (7.87%) 9.9% (7.5%) 25 24.599 .000 Write 3 60.6% (8.2%) 8.6% (5.4%) 25 26.874 .000 Write 4 58.9% (7.2%) 10.3% (6.7%) 24 29.428 .000
Although in the smartphone drives it is not possible to distinguish between time spent looking at the phone and time spent looking at driving-related targets inside the vehicle (such as the speedometer), it can be assumed that the control drive represents participants’ normal visual behaviour. Thus, the difference between the two drives represents the distraction from driving caused by use of the smartphone. This change in
0% 10% 20% 30% 40% 50% 60% 70% 80% 90% 100%
Write 1 Write 2 Write 3 Write 4 Update Read 1 Read 2
Percentage o f time s pent looking down Control Smartphone
visual behaviour fits well with the findings that measures of driving performance suffered while participants were using a smartphone.
From some of the videos it was also possible to glean where participants were holding their phone while using it. Some tended to place it against the top of the steering wheel whereas others held it lower down or to one side. However, it was not possible to pinpoint the location of the phone during all drives, so statistical analysis of the effects of phone location was not conducted.
4.5
Effects of driving on smartphone use
Although the primary aim of this research is to investigate the effect of smartphone use on the task of driving, carrying out two tasks at once can lead to reductions in performance on both tasks. To investigate this, participants’ recall of the messages they sent and the time it took them to compose messages was investigated.
4.5.1 Recall of received messages
During the trial participants were sent two messages and were prompted in the post-trial questionnaire to recall a key fact from each message. All participants responded to the question. Table 13 shows that only one participant (a different participant in each case) was unable to recall the content of the message.
Table 13: Participants' recall of the messages sent to them
No. respondents No. Correct No. Incorrect
Message 1 28 27 1
Message 2 28 27 1
This demonstrates that, on the whole, participants did pay attention to the content of the message.
4.5.2 Time taken to write messages
The second measure taken to assess performance on the task of writing messages was the time it took to do so. Figure 13 shows that participants took on average just under 14 seconds to write the control messages, but when driving, it took them on average 56.6 seconds to write messages of a comparable length.
Figure 13: Average time taken to write messages while driving and control messages while not driving
A paired samples t-test confirmed that these differences were statistically significant (t(27)=-18.937, p=.000). Thus, it would seem that the task of driving also interfered with use of the smartphone.
4.6
Subjective effects of smartphone use on driving performance
After each drive, participants were asked eight questions in which they had to rate specific aspects of their driving performance. Table 14 shows the questions participants were asked, their responses for each drive (mean and standard deviation) and results of paired comparison t-tests.
.0 10.0 20.0 30.0 40.0 50.0 60.0 70.0 80.0 Baseline Driving T ime (secs)
Table 14: Subjective ratings of performance during the two drives Question Smartphone Mean (SD) Control Mean (SD) t df p
Compared to how you normally drive, how well do you think you drove in the first motorway section?
47.6 (21.1) 61.6 (20.5) -2.938 27 .007
How easy or difficult was it to drive at 40mph and stay in the centre of the lane during the curve following task?
36.6 (16.9) 54.8 (21.1) -3.860 27 .001
Compared to how you normally drive on curved roads, how well do you think you drove during the curve following task?
29.2 (17.7) 46.8 (21.4) -3.607 27 .001
Compared to how you normally drive when following other vehicles, how well do you think you drove in the car following section?
45.3 (20.1) 55.4 (21.5) -2.234 27 .034
How easy or difficult was it to maintain a constant distance during the car following task?
34.8 (16.3) 42.4 (21.1) -1.791 27 .085
How easy or difficult was it to respond to any tones you might have heard?
50.7 (20.6) 58.0 (21.3) -1.892 27 .069
How easy or difficult was it to respond to the red bar stimulus which you might have observed?
41.6 (22.1) 56.0 (20.6) -2.878 27 .008
Compared to how you normally drive, how well do you think you drove overall?
41.2 (19.4) 55.6 (16.5) -3.341 27 .002
The results show that participants tended to feel that their performance was worse during the smartphone drive. All but two results are statistically significant. The differences between their ratings for the two drives of their ability maintain a constant distance during the car following task and the ease of responding to auditory tones failed to reach statistical significance. These perceptions do not match the measures taken from the simulator, which show significant delays in responding to the first auditory tone during the smartphone drive. Thus, participants’ actual performance may be have deteriorated even if they do not perceive this to be the case.
Aside from asking participants how they performed during each drive, the questionnaire also asked how they felt social networking affected different aspects of their driving. Table 15 presents participants’ views of the effect of social networking on their concentration towards driving, its effect on their speed, headway, lane keeping, hazard awareness and overall driving performance.
Table 15: Participants' perceptions of the effects of social networking on driving
N Min Max Mean SD
Concentration (high score means increased
concentration)
Updating status 28 1.1 13 4.35 2.71 Reading messages 28 0.5 9.8 4.83 2.49 Writing messages 28 0 9 2.78 1.99 Effect on speed
(high score means increased speed)
Updating status 27 0.2 73 6.74 13.54 Reading messages 28 0.5 9.2 4.60 2.27 Writing messages 28 0 8.6 3.74 2.53 Effect on headway
(high score means driving closer to car in front)
Updating status 27 0 8.8 3.99 2.79 Reading messages 28 0 8.4 3.34 2.17 Writing messages 28 0 8 3.07 2.36 Effect on lane keeping
(high scores represent struggling to maintain lane position)
Updating status 28 5.6 9.9 7.80 1.27 Reading messages 28 1.8 9.5 6.07 2.00 Writing messages 28 4.3 62 9.69 10.34 Effect on awareness of hazards
(high scores represent being less aware)
Updating status 28 0.9 9.5 7.45 1.77 Reading messages 27 1 9.6 6.34 2.02 Writing messages 28 1.2 10 7.18 2.24 Overall driving performance
(high scores represent worse driving performance)
Updating status 28 2.8 10 7.79 1.54 Reading messages 28 4.8 10 7.19 1.51 Writing messages 28 5.4 10 8.08 1.19
The scores indicate that participants thought social networking negatively affected their concentration, lane keeping, hazard awareness and overall driving performance. They also reported that they left more distance between themselves and lead vehicles.
4.7
Patterns of mobile phone use
The post trial questionnaire enquired about participants’ patterns of mobile phone use, in order to establish their level of familiarity with the device and the tasks they were asked to perform during the trial.
4.7.1 Familiarity with the device
On average, participants reported that they had owned their phone for just over a year and a half (Mean = 1.6, SD=1.3). Only one participant had owned their phone for one
month or less, suggesting that the vast majority of the sample was familiar with their phone.
Participants were given four messages to write while they were not driving. On average it took participants 13.9 (SD=4.93) seconds to write these messages. Figure 14 shows the time taken for each of these four messages.
Figure 14: Mean and standard deviation of time taken to write baseline messages
Figure 15 shows the distribution of participants’ mean baseline message writing times.
Figure 15: Boxplot of time taken (in seconds) to write messages when not driving 0 5 10 15 20 25
Message 1 Message 2 Message 3 Message 4
T
ime
This shows that participants 16 and 22 took longer to write messages than the remainder of the participants. However, the time it took them to write messages during the drives was within two standard deviations of the sample mean. Thus, there is no basis for concern that they were engaging in the secondary task of using their phone for longer than the rest of the sample.
4.7.2 Familiarity with social networking and different phone functions
In order to ascertain whether participants were familiar with social networking sites, they were asked how often per week they accessed social networks. All participants were users of social networking sites and just under half accessed social networking sites over thirty times per week (see Figure 16). This suggests that participants were familiar with social networking sites.
Figure 16: The number of times per week participants access social networking sites
It was also of interest to know how often they used their smartphone for basic mobile phone functions as well as for social networking. Figure 17 shows the frequency with which participants reported using their phone for spoken conversations, texting and social networking. 0 2 4 6 8 10 12 0 1-5 6-10 11-20 21-30 31+ Num b er of part ic ipant s
Figure 17: The number of times per week participants access social networking sites via their smartphone
More participants reported texting very frequently (31+times a week) than they did using their phone for spoken conversations or social networking. Nevertheless, all participants reported that they use their smartphone to access social networking sites at least once per week. In fact, the results suggest that participants use their phone to access social networking sites about as often as they do for spoken conversations.
Participants were asked to rate the ease of using their smartphone to access social networking sites on a scale of 0 – 100 (0=very difficult, 100 = very easy). The average score given by participants was 76.7 (SD=28.7). Nevertheless, there were four participants who gave a rating of 20 or less.
4.7.3 Use of phone while driving
Participants were asked a series of questions about their use of mobile phones while driving, including:
• Do you take your smartphone with you when driving?
• How often do you leave your smartphone switched on while driving?
• If you leave your phone switched on while driving, how often do you leave it on silent?
• Do you have a cradle for your phone in your car? If so how often do you use it?
• Do you use your phone hands free while driving
• Do you access social networking sites while driving?
All participants reported that they take their smartphone with them when they are driving. The overwhelming majority responded that they always leave their phone switched on, while only two participants said that they ‘often’ leave it switched on. Only nine of the 26 respondents to the question reported that they always or often keep their phone on silent while they are driving. Leaving a mobile phone (and its ringer) on while driving could present a temptation to use it.
0 2 4 6 8 10 12 14 16 18 0 1-5 6-10 11-20 21-30 31+ Num b er of part ic ipant s
Number of times per week
Spoken conversations Texting
In the UK it is currently illegal to use a hand-held mobile phone while driving. Only six out of 25 respondents to the question reported that they have a cradle in their car for their mobile phone, and of these six, only two reported that they always use it. Thus, if they do use their mobile phone while driving, the majority of participants in this study would be at risk of non-compliance with the law.
Participants were asked whether they access social networking sites while they are driving. Figure 18 shows that three of the 21 participants who responded to this question said they do.
Figure 18: The number of participants who access social networking sites while driving
While this is not a large proportion of drivers in this study, it does suggest that social networking is an activity that some people engage in while driving. Thus, this activity cannot be ruled out as a safety risk on the grounds that people don’t do it.
4.8
Perceptions of legality
In the post-trial questionnaire participants were asked whether they thought certain activities are illegal, and whether they think these activities should be illegal. These activities were:
• Writing a message while the phone is in a cradle
• Reading a message while the phone is in a cradle
• Writing a message using the phone handheld
• Reading a message while using the phone handheld
• Writing a message using a text-to-speech function on the phone
Twenty-seven participants answered these questions. Figure 19 shows that a majority of participants thought that it was illegal to read or write messages regardless of whether the phone was in a cradle or used handheld. Perceptions were more mixed in relation to use of the text-to-speech function, with more people being unsure or thinking it was a legal activity than with the others.
0 2 4 6 8 10 12 14 16 18 20 No Yes Num b er of part ic ipant s
Whether participants access social networking sites while driving
Figure 19: Perceptions of current legality of phone use while driving
In fact, current legislation does not specifically prohibit use of a phone to send and receive text messages; the only requirement is that the phone is in a cradle. The Highway Code does, however, advise that, “it is far safer not to use any telephone while you are driving or riding – find a safe place to stop first or use the voicemail facility and listen to messages later.” (DirectGov, 2011)
Figure 20 shows that participants’ perception of the current legality of these activities was well-aligned with their opinions on whether the activities should or should not be legal.
Figure 20: Perceptions of whether phone use while driving should be legal
Most participants thought that use of a phone to write or read messages should be illegal, although more participants thought that writing messages using text-to-speech functions should be legal than other activities (14 participants compared with 24-26 participants for the other activities).
0 5 10 15 20 25 30 write (in cradle) read (in cradle) write (handheld) read (handheld) write (text to speech) Not sure Illegal Legal 0 5 10 15 20 25 30 write (in cradle) read (in cradle) write (handheld) read (handheld) write (text to speech) Not sure Illegal Legal
4.9
Perceptions of relative risks of driving behaviours
Participants were asked to judge the difference that sixteen driving behaviours make to a person’s safety while driving. The response scale was from 0% (less dangerous) to 100% (more dangerous). The results for this section of the questionnaire are presented in Table 16.
Table 16: Participants’ judgements of the safety of different driving behaviours
Activity
Mean percentage risk
When a driver has been drinking alcohol (regardless of amount) 91.1%
When a driver is racing others 86.4%
When a driver is updating a social networking site whilst driving 86.1%
When a driver is tired 86.0%
When a driver is writing a text message 84.3%
When a driver is reading a text message 83.0%
When a driver is browsing a social networking site while driving 82.8%
When a driver is angry enough to have road rage 80.7% When a driver is talking on their mobile phone (handheld) 78.9% When other drivers on the road are acting unsafely 76.3%
When a driver is in a hurry 76.1%
When a driver is inexperienced 74.6%
When a driver is speeding 72.8%
When a driver is selecting music while driving 64.4% When a driver is talking on their mobile phone (handsfree) 50.8%
When passengers are in the car 44.9%
Social networking activities ranked 3rd and 7th in the list, with updating a social networking site being perceived as having a greater negative effect than browsing a social networking site. All of the behaviours in this list, apart from those relating to social networking, were included in the questionnaire administered during the study by Reed and Robbins (2008). These results are broadly in line with their findings.
5
Discussion
This study set out to investigate whether there was an effect of social networking using a smartphone on driving performance. Twenty-eight young male and female participants took part in the study and drove a high fidelity driving simulator through the same test scenario twice: once