Schriften des Lehrstuhls für Energiewirtschaft, TU Dresden
Series of the chair of energy economics, TU Dresden
Alexander von Selasinsky
The integration of renewable energy
sources in continuous intraday markets
for electricity
Technische Universität Dresden
Fakultät Wirtschaftswissenschaften
Schriften des Lehrstuhls für Energiewirtschaft, TU Dresden
Series of the chair of energy economics, TU Dresden
Band 9
Impressum
Herausgeber:
Technische Universität Dresden
Fakultät der Wirtschaftswissenschaften
Lehrstuhl für Energiewirtschaft
01062 Dresden
Tel.:
+49 351 463-33297
Fax:
+49 351 463-39763
E-Mail:
ee2@mailbox.tu-dresden.de
Internet
http://www.ee2.biz
ISBN 978-3-86780-486-8
Stand 04/2016
The integration of renewable energy sources in continuous
intraday markets for electricity
Alexander von Selasinsky
Dissertation zur Erlangung des akademischen Grades doctor rerum politicarum (Dr. rer. pol.)
vorgelegt am 18. Mai 2015 an der Fakultät Wirtschaftswissenschaften
Technische Universität Dresden Disputation am 5. April 2016
BETREUENDERHOCHSCHULLEHRER
Prof. Dr. Dominik Möst Technische Universität Dresden Fakultät Wirtschaftswissenschaften
Lehrstuhl für Energiewirtschaft GUTACHTER
Prof. Dr. Dominik Möst
Abstract
This thesis develops and applies methodological approaches for the analysis of intra-day markets for electricity which are organised as continuous double auctions. The focus is to improve the understanding of how balancing forecast errors from weather-dependent renewable energy sources influences the outcomes of continuous intraday markets. This is important as it helps to assess how large amounts of renewable capacity can be utilised cost-efficiently and without stressing security of supply. In a first step, the thesis proposes a (non-mathematical) model of a continuous intraday market to show how the direction of the forecast error determines transactions between market participants, how these transactions relate to the formation of prices, and how the market integration of renewables can be improved. In a second step, the thesis provides a foundation for quantitative market analyses by modelling price-setting decisions for power generators and electricity demanders. This makes it possible to show that information on market participants’ technical characteristics enables informed predictions of their market behaviour. In a third step, the thesis presents a computer simulation of a continuous intraday market. Implementing the simulation approach for the German power system allows calculation of the costs associated with the uncertain feed-in from renewables.
Danksagung
Zuerst danke ich Professor Dominik Möst für die Möglichkeit, diese Arbeit verfassen zu können. Sein Vertrauen, seine Unterstützung und sein Wissen waren während meiner Zeit an seinem Lehrstuhl unverzichtbar. Mein Dank gilt außerdem Professor Marco Lehmann-Waffenschmidt, der diese Arbeit in Zweitbetreuung unterstützte, sowie Professor Alexander Kemnitz und Professorin Bärbel Fürstenau als weitere Mitglieder der Promotionskommission.
Die Förderung durch Friedrich Kunz war für mich und für diese Arbeit von großem Wert. Michael Zipf danke ich sowohl für seine Beiträge zum besseren Verständ-nis meines Forschungsthemas als auch für die gemeinsame Zeit in unserem Büro. Ebenso möchte ich meinen Kollegen David Gunkel, Theresa Müller, Daniel Schubert, Hannes Hobbie, Fabian Hinz, Susanne Koschker, Philipp Hauser, Matthew Schmidt, Martina Voß, Stefan Perras, Christoph Kost, Christoph Brunner, Julia Michaelis, Gerda Schubert und Michael Burkhardt für die Zeit am Lehrstuhl und ihre Unterstützung danken.
Ich danke außerdem Florian Leuthold, Professor Hannes Weigt, Professor Christian von Hirschhausen, Sophia Rüster, Professor Martin Meyer-Renschhausen und Pro-fessor Alexander Kemnitz für die (energie-)ökonomische Ausbildung über viele Jahre. Zudem bin ich sehr froh, dass ich auf die mathematische Kompetenz von José Miguel Zapata Rolón, Daniel Huppmann, Daniel Tillich und Professor Martin Keller-Ressel zugreifen konnte.
Das Verdienst meiner wichtigsten Freunde Philipp Wetzel und Marian Stiehler kann ich nicht hoch genug bewerten. Ebenso danke ich Dennis Gültig und Christoph Planteur für viele gemeinsame Jahre. Alexander Fels, Christoph Knippschild, Julia Thiel und Maximilian Raschke haben meine Zeit in Dresden schöner und einpräg-samer werden lassen. Alexander Fels war mir beim Studium zudem eine große Unterstützung.
Dank Miranda Benner hat diese Arbeit keine Lebenszeit gekostet. Ihre Verbundenheit und ihr Rückhalt waren unersetzbar.
Ohne meine Eltern und meine Brüder wäre alles schwerer und vieles unmöglich. Für Heinrich Werner Wilhelm Köster.
Table of Contents
Page
List of Tables xiii
List of Figures xv
List of Abbreviations xix
1 Introduction and overview 1
2 Renewable energy sources and intraday markets 3
2.1 The characteristics of renewable energy sources . . . 3
2.2 Effects in the power system – zero marginal costs . . . 4
2.3 Effects in the power system – variability and uncertainty . . . 7
2.4 Integration instruments and intraday markets . . . 8
3 Overview of intraday markets 11 3.1 Intraday markets in power systems . . . 11
3.2 The design of intraday markets . . . 13
3.2.1 Auctions and their characteristics . . . 13
3.2.2 Intraday markets as continuous double auctions . . . 14
3.2.3 Cross-border trading in continuous intraday markets . . . 16
3.3 Intraday markets in Europe . . . 17
3.3.1 The intraday market in Spain (OMIE) . . . 17
3.3.2 The intraday market in Scandinavia (Nord Pool Spot) . . . 18
3.3.3 The intraday market in Germany (EPEX SPOT) . . . 19
4 Related literature and contribution 23 4.1 Research on continuous double auctions . . . 23
4.1.1 Modelling limit order books . . . 23
4.1.2 Modelling trading strategies . . . 24
4.2 Research on intraday markets for electricity . . . 26
4.2.1 Market design . . . 26
4.2.2 Trading strategies . . . 27
4.2.3 Modelling intraday markets . . . 27
4.3 Contribution to the literature . . . 29
5 A simple model of a continuous intraday market 33 5.1 Setup and assumptions . . . 33
5.2 The day-ahead auction as a reference framework . . . 35
TABLE OF CONTENTS
5.4 Continuous trading . . . 38
5.5 Empirical insights . . . 39
6 Options to improve the balancing of forecast errors 43 6.1 Reducing forecast errors . . . 43
6.2 Increasing the number of market participants . . . 44
6.3 Improving the flexibility of the power plant portfolio . . . 45
6.4 Making the demand side more flexible . . . 48
6.5 Introducing more capacity to store electricity . . . 50
6.6 Some policy conclusions . . . 50
7 Price-setting decisions in continuous intraday markets 53 7.1 Price-setting decisions for power generators . . . 53
7.1.1 General framework . . . 53
7.1.2 Economic effects of output adjustments . . . 54
7.1.3 Calculation of indifference offer prices . . . 58
7.1.4 Calculation of optimal offer prices . . . 62
7.2 Price-setting decisions for electricity demanders . . . 66
7.2.1 Calculation of indifference offer prices . . . 66
7.2.2 Calculation of optimal offer prices . . . 67
7.3 Specifying optimal offer prices . . . 68
7.3.1 Weibull distribution and Newton’s method . . . 68
7.3.2 Evaluation of the probability of success . . . 74
7.3.3 Insights into price-setting decisions . . . 75
8 A simulation for continuous intraday markets 79 8.1 Structure and calculation procedure . . . 79
8.1.1 Overview and setup of the simulation . . . 79
8.1.2 Calculation of day-ahead offers and day-ahead dispatch . . . . 82
8.1.3 Offer type decision and output constraints . . . 83
8.1.4 Calculation of intraday offers and open order book . . . 86
8.1.5 Determination of balancing decisions . . . 87
8.1.6 Calculation of intraday transactions and intraday price . . . 88
8.2 Implementation for the German intraday market . . . 89
8.2.1 Power plant portfolio . . . 89
8.2.2 Electricity demanders . . . 91
8.2.3 Electricity demand and renewable production . . . 91
8.2.4 Fuel and carbon prices . . . 92
8.3 Results for the German intraday market . . . 93
8.3.1 Validity of the simulation results . . . 93
8.3.2 The response to the balancing of forecast errors . . . 96
8.3.3 The costs of balancing forecast errors . . . 98
8.3.4 The costs associated with the uncertainty of renewables . . . 101
TABLE OF CONTENTS
8.3.5 The incentive to increase the likelihood of an underestimation . 108
8.3.6 The role of the balancing profile . . . 110
8.3.7 The effects of increasing the number of market participants . . 114
9 Main results and conclusions 117
Bibliography 121
A Output adjustments and the difference quotient 135
B Source code: Newton-Raphson method for optimal bid prices 137
B.1 Power generators . . . 137 B.2 Electricity demanders . . . 139
C Source code: Newton-Raphson method for optimal ask prices 143
C.1 Power generators . . . 143 C.2 Electricity demanders . . . 145
D Source code: Verifying root calculation and global maximum 147
D.1 Bidding to buy electricity . . . 147 D.2 Asking to sell electricity . . . 151
E Source code: Simulation of a continuous intraday market 155
List of Tables
TABLE Page
5.1 Market results for three intervals of forecast errors from the German power system. Data from EEX (2014c); EPEX SPOT (2014); EEX Transparency (2014). . . . 40 7.1 Evaluation of how the characteristics of base, mid, and peak-load generators
(per-unit costs of production, impact of partial load conditions) determine their indifference offer prices.. . . 61 7.2 Evaluation of how the characteristics of base, mid, and peak-load generators
(per-unit costs of production, impact of partial load conditions) determine their indifference and their optimal offer prices.. . . 78 8.1 Comparison of historical and simulated volume-weighted average intraday
mar-ket prices for the year 2012. The time series “TShi st or i c al” refers to data from EPEX SPOT (2014). “Pricescor r ec t ed” compares historical and simulated intraday prices only for hours in which the absolute difference between the observed and the simulated day-ahead price is belowe10/MWh (6,259 hours). The column labelled “PDCmod el” gives information on the comparison of Price Duration Curves constructed from historical and simulated prices. . . 96 8.2 Intraday activity of a lignite-fired power generator subject to the market
environ-ment imaged by the cumulative distribution functions of Fig. 8.8a. . . 98 8.3 Simulated trading costs for balancing forecast errors in the German intraday
market for the year 2012. The column labelled “TCF E” (“TCF I”) gives trading costs per megawatt hour of forecast error (renewables feed-in). Forecast errors and feed-in from EEX Transparency (2014). . . 99 8.4 Sensitivity of trading costs for the year 2012. “No strategic behaviour” refers to the
balancing of forecast errors at indifference offer prices, “Fewer generators” to the exclusion of power generators with a reference capacity below 100 MW (instead of 50 MW), “Fewer demanders” to electricity demanders holding only 10 percent of the expected residual load (instead of 25 percent), and “Flexible demanders” to a price elasticity of -0.3 (instead of -0.15). . . 100 8.5 Simulated market integration costs for balancing forecast errors in the German
intraday market for the year 2012. The column labelled “MICF E” (“MICF I”) gives market integration costs per megawatt hour of forecast error (renewables feed-in). Forecast errors and feed-in from EEX Transparency (2014). . . 104
LIST OFTABLES
8.6 Sensitivity of market integration costs for the year 2012. “No strategic behaviour” refers to the balancing of forecast errors at indifference offer prices, “Fewer generators” to the exclusion of power generators with a reference capacity below 100 MW (instead of 50 MW), “Fewer demanders” to electricity demanders holding only 10 percent of the expected residual load (instead of 25 percent), and “Flexible demanders” to a price elasticity of -0.3 (instead of -0.15). . . 104 8.7 Average feed-in from renewables subject to specified intervals of forecast errors.
The intervals widen to include more observations. Data from EEX Transparency (2014). . . 106 8.8 Market integration costs for 2012 given that the CRM sells 100 percent (No
strategy) or 95 percent (Strategy95%) of the forecasted feed-in in the day-ahead
auction. “noPE” means that the price effect is neglected. . . 108 8.9 Comparison of three balancing profiles subject to various levels of forecast errors.
All results were calculated assuming an expected residual load of 40 GW. . . 112
List of Figures
FIGURE Page
2.1 Output from wind turbines and photovoltaic installations in Germany for two days in 2013 as well as the difference between their day-ahead forecasted and their delivered output on 18.04.2013. Data from EEX Transparency (2014). . . 3 2.2 Residual Load Duration Curves for the German electricity market in the years
2010, 2020, and 2030 considering installed capacities of 36.5 GW (2010), 86 GW (2020), and 119.8 GW (2030) for weather-dependent renewables. Data from Gunkel et al. (2012). . . 5 2.3 Simplified illustration of the merit order effect induced by renewable energy
sources.. . . 6 3.1 A simple illustration of a liberalised power system with wholesale and retail
competition (based on Kirschen and Strbac, 2004). . . 12 3.2 Simplified illustration of an open order book. The left-hand side contains bids
sorted in descending order with respect to their limit price. The right-hand side of the order book contains the submitted asks sorted in ascending order. . . 15 3.3 Simplified illustration of the mechanism for intraday implicit capacity allocation
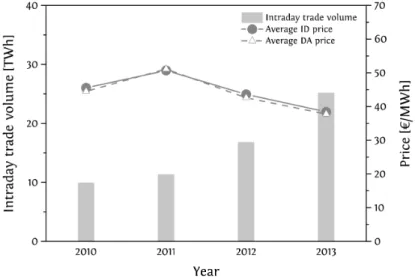
(based on ENTSO-E, 2012). . . 16 3.4 Volumes and prices from the Spanish intraday market. Data from OMIE (2014b). . 17 3.5 Intraday trade volumes, average intraday prices, and average day-ahead prices
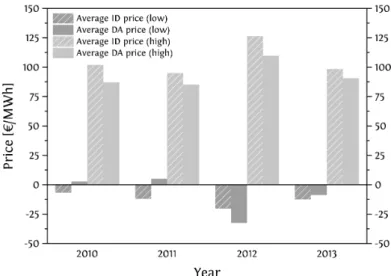
from the German electricity market. Data from EPEX SPOT (2014); EEX (2014c). . 19 3.6 Comparison of the average price of the 100 lowest-price hours and the average
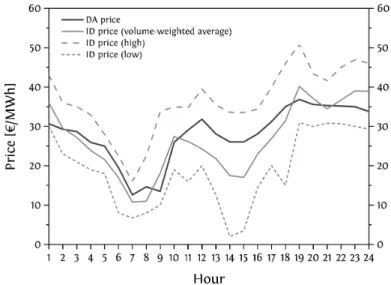
price of the 100 highest-price hours. Data from EPEX SPOT (2014); EEX (2014c). . 20 3.7 Intraday market prices for each hour of 1st December 2013. “Intraday price” refers
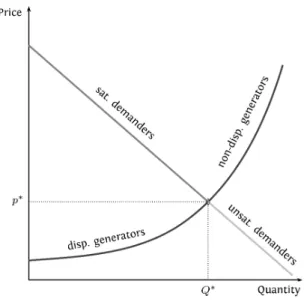
to the volume-weighted average intraday market price. “Intraday price low” is the clearing price of the transaction with the lowest price and “Intraday price high” is the clearing price of the transaction with the highest price. Data from EPEX SPOT (2014); EEX (2014c). . . 21 5.1 Results of the day-ahead auction for a given hour. “Dispatched generators”, as
opposed to “non-dispatched generators”, are committed through the day-ahead auction to producing their offered quantities. “Satisfied demanders”, as opposed to “unsatisfied demanders”, obtained quantities in the day-ahead market.. . . 35 5.2 Framework for analysing intraday markets. An underestimation of the feed-in
from renewables requires selling the overproduction. In the case of an overes-timation, balancing the forecast error requires buying missing quantities in the intraday market. . . 37
LIST OFFIGURES
5.3 Continuous trading illustrated with the help of ovals marking regions of potential bid and ask prices. Market participants who bought (sold) quantities have the opportunity to sell (buy) them back. . . 38 5.4 Spread “day-ahead price – intraday price” subject to forecast error and residual
load from the German electricity market. Data from EEX (2014c); EPEX SPOT (2014); EEX Transparency (2014). . . 39 6.1 The effects of inflexibility. On the left-hand side, all generators participate in the
intraday market (no inflexibility, e. g. many hours before physical delivery). On the right-hand side, some generators had to drop out of the market (inflexibility, e. g. close to physical delivery). . . 46 6.2 Average difference between the day-ahead and the intraday market price for
hours with an underestimation of the feed-in from renewables subject to different intervals of residual load. Data from EEX (2014c); EPEX SPOT (2014); EEX Trans-parency (2014).. . . 47 6.3 Market representation with a steep day-ahead demand curve. . . 49 7.1 Illustration of Eq. (7.3) withGr e f = 100 MW and ηr e f = 0.5. Minimum load
con-straints are neglected to improve the visualisation. . . 55 7.2 Illustration of the indifference offer price subject to the magnitude of the output
reduction for a generator with a concave efficiency function. Minimum load constraints are neglected. . . 59 7.3 Illustration of the Weibull cumulative distribution function for various parameter
specifications. . . 68 7.4 Illustration of the procedure behind the Newton-Raphson method (based on
Dennis Jr. and Schnabel, 1996). . . 70 7.5 Construction of a probability density function and a cumulative distribution
function for the random variableBwithbh=e50/MWh,Fh= 0.9,bl=e40/MWh,
Fl= 0.1, andγ= 3. . . 74 7.6 Optimal bid prices subject to the corresponding indifference prices and the
market environment as imaged via a cumulative distribution function. . . 76 7.7 Optimal ask prices subject to the corresponding indifference prices and the
market environment as imaged via a survival function. . . 77 8.1 Overview of the simulation structure.. . . 80 8.2 Overview of the simulation calculation procedure. . . 81 8.3 Illustration of offer type decisions for power generators subject to the current
level of output, the position on the merit order, and the direction of the forecast error. The percentages in brackets are probabilities that the respective offer type is submitted. . . 84 8.4 Illustration of the CRM’s profile to balance forecast errors. The light grey dots
show the quantity that has to be traded in response to the evolution of the forecast error (dark grey squares). . . 87
LIST OFFIGURES
8.5 Left: Price Duration Curves for historical and simulated clearing prices of the day-ahead auction (data from EEX, 2014c). Right: Price Duration Curves for historical and simulated optimal and indifference intraday market prices (data from EPEX SPOT, 2014). . . 93 8.6 Time series of historical, optimal, and indifference intraday market prices for the
last seven days of March 2012. Data from EPEX SPOT (2014). . . 94 8.7 Comparison of historical and simulated intraday market prices for hours in
which the absolute day-ahead price difference is smaller thane3/MWh and the absolute forecast error is greater than 3,000 MW. Data from EEX (2014c); EPEX SPOT (2014). . . 95 8.8 Left: Cumulative distribution functions for the 10 time steps given that the CRM
balances an underestimation of 5 GW at an expected residual load of 25 GW. Right: Survival functions for the 10 time steps given that the CRM balances an overestimation of 5 GW at an expected residual load of 55 GW. . . 97 8.9 Trading costs per megawatt hour of forecast error subject to different levels of
actual residual load. The calculations were performed with the balancing profile illustrated in Fig. 8.4.. . . 101 8.10 Comparison of revenue from selling the underestimated and the actual feed-in
from renewables in the day-ahead market. . . 102 8.11 Comparison of revenue from selling the overestimated and the actual feed-in
from renewables in the day-ahead market. . . 103 8.12 The components of market integration costs resulting from all hours in 2012
which exhibit either an underestimation (left) or an overestimation (right). . . 105 8.13 Market integration costs for a single hour with a specific underestimation and an
actual residual load. . . 107 8.14 Market integration costs for a single hour with a specific overestimation and an
actual residual load. . . 107 8.15 Illustration of the balancing profile “Profilemi ss”. The light grey dots show the
quantity that has to be traded in response to the evolution of the forecast error (dark grey squares). . . 110 8.16 Comparison of different balancing profiles subject to their trading costs. Out
of 1,000 simulation runs, the figure shows the profile resulting in the lowest, the median, and the highest trading costs. The calculations were performed assuming an expected residual load of 40 GW and an underestimation of 5 GW. . . 111 8.17 Change in trading costs due to using Profilemi ss instead of Profileopt i mal for
various forecast errors and actual residual loads. . . 113 8.18 Change in trading costs due to introducing 5 GW of additional gas-fired
genera-tors (a) or 5 GW of additional lignite-fired generagenera-tors (b) for various underestima-tions and actual residual loads. The calculaunderestima-tions were performed with Profilebasi c. 114 8.19 Illustration of the effect of introducing additional generators to the day-ahead
LIST OFFIGURES
8.20 Change in trading costs due to introducing 5 GW of additional gas-fired genera-tors (a) or 5 GW of additional lignite-fired generagenera-tors (b) for various overestima-tions and actual residual loads. The calculaoverestima-tions were performed with Profilebasi c. 116
List of Abbreviations
AON All-or-None
approx. approximately
c. p. ceteris paribus
CCGT Combined Cycle Gas Turbine
CDA continuous double auction
CDF cumulative distribution function
Chap. Chapter
CHP Combined Heat and Power
CMM Capacity Management Module
CO2 carbon dioxide
CRM Central Renewables Manager
DA day-ahead
DR demand response
el electric
Elbas Electricity Balance Adjustment System
Eq. Equation Fig. Figure FOK Fill-or-Kill GW gigawatt ID intraday indiff. indifference IOC Immediate-or-Cancel k kilo kg kilogram m million
MAE Mean Absolute Error
max maximum
MIC market integration costs
MICF E market integration costs per MWh forecast error
MICF I market integration costs per MWh feed-in
min minimum
MJ megajoule
MW megawatt
MWh megawatt hour
OCGT Open Cycle Gas Turbine
OCOT Open Cycle Oil Turbine
OOB open order book
opt. optimal
LIST OFABBREVIATIONS
PCC Pearson product-moment correlation coefficient
PDC Price Duration Curve
PDF probability density function
PE price effect
PLC partial load conditions
QE quantity effect
RLDC Residual Load Duration Curve
RMSE Root-Mean-Square Error
SD standard deviation
Sect. Section
SF survival function
SOB Shared Order Book
t ton
Tab. Table
TC trading costs
TCF E trading costs per MWh forecast error
TCF I trading costs per MWh feed-in
th thermal
TSO Transmission System Operator
TWh terawatt hour
under. underestimation
WTA willingness to accept
WTP willingness to pay
Introduction and overview
W
hen Thomas A. Edison opened the world’s first central power station on 4thSeptember 1882 on Pearl Street, New York, he most likely would not have believed the eagerness at the beginning of the 21st century to bring back the technology of the windmill used extensively in the dark ages. Yet he would also not have believed that burning fossil fuels for only one hundred years could threaten the quality of life on earth. Opposing climate change, together with reducing the dependency on depleting natural, non-renewable resources, is one main argument for introducing large amounts of renewable energy sources to energy systems. Making use of wind power and solar radiation is of particular relevance in this context since their technical potential is great enough to cover the global energy demand. However, using wind turbines and photovoltaic installations has the disadvantage that their output depends on the state of the environment, which is both variable and uncertain. This downside is relevant because of two main aspects. First, the operational stability of the transmission network depends on ensuring a permanent balance of supply and demand. Not maintaining this equilibrium adequately can result in supply interruptions which induce damage to an economy that was built around the promise that electricity can be consumed at all times. Second, it is cost-intensive to store large amounts of electricity and the potential of current storage technologies is limited. As a consequence, providing instruments to ensure a well-functioning integration of the feed-in from weather-dependent renewables into power systems is of significant importance.
An intraday market for electricity can be understood as such an instrument. By giving market participants the possibility to trade electricity close to its physical delivery (“within the day”), intraday markets are of high relevance for managing the uncertainty of the output from weather-dependent renewable energy sources. This uncertainty manifests itself in the form of forecast errors which can be measured by the difference between the expected feed-in at the closure of the day-ahead market and the actual feed-in. Thus, the amount of electricity sold in the day-ahead market, which allocates quantities to buyers and sellers for each hour of the following day, generally does not equal the amount actually produced by wind turbines and photovoltaic installations. The intraday market permits reaction to new information
CHAPTER 1. INTRODUCTION AND OVERVIEW
emerging after the closure of the day-ahead market and therefore allows market participants to balance forecast errors. For example, a wind power manager receives a short-term forecast of the average wind speed for an hour in the future. This new forecast implies that the electricity output will be higher than the amount sold in the day-ahead market. The intraday market then gives the wind power manager the option of selling the anticipated overproduction in order to avoid an unbalanced position in the future hour. A continuous intraday market—as operated in e. g. Germany, France, and Scandinavia—organises such trading activities by delegating the clearing process to the market participants. In simple terms, this means that they can place bids for buying and asks for selling electricity in an open order book at any time within a specified trading period. If a bid price is equal to or exceeds the price of an ask, a corresponding transaction between the involved parties takes place on a bilateral (but anonymous) level. Hence, this kind of auction design provides a high level of flexibility to market participants and is therefore well suited to manage the uncertainty of renewables.
Providing a better understanding of the relationship between (continuous) intra-day markets and the integration of renewable energy sources is especially impor-tant for evaluating how large amounts of renewable capacity can be utilised cost-efficiently and without stressing security of supply. To contribute in this respect, the main purpose of this thesis is to develop and to apply methodological approaches for the analysis of how balancing forecast errors from renewables influences the outcomes of continuous intraday markets. This requires explaining how the char-acteristics of power generators and electricity demanders determine their market activity, how this market activity can be modelled, and how it is connected to the cor-rection of forecast errors. More specifically, Chap. 2 first discusses the characteristics of weather-dependent renewable energy sources, how they affect power systems, and why intraday trading can contribute to managing these impacts. Chap. 3 proceeds by presenting the design and the functionality of intraday markets for electricity and by introducing the most relevant arrangements in Europe. While Chap. 4 gives insights into the related literature and clarifies the contribution of this thesis, Chap. 5 proposes a non-mathematical model of a continuous intraday market. This model provides a simple market representation, which makes it possible to carry out a very general analysis of how changing market conditions influence market outcomes. In fact, Chap. 6 uses this representation to discuss options for improving the in-tegration of renewables. To build a foundation for modelling continuous markets quantitatively, Chap. 7 formalises price-setting decisions of power generators and electricity demanders. Chap. 8 uses these formalisations together with the insights from the model in Chap. 5 to present a computer simulation for continuous intraday markets. Implementing the simulation approach for the German power system allows calculation of market prices and the costs of balancing forecast errors, for example, and thus gives more concrete insights into the impact of renewables on intraday markets. Chap. 9 concludes by summarising the main findings of this thesis and by highlighting the need for further research.
Renewable energy sources and intraday markets
This chapter deals with fundamental aspects relating to the integration of the feed-in from weather-dependent renewable energy sources. Whereas Sect. 2.1 discusses the characteristics of renewables, Sect. 2.2 and Sect. 2.3 show how these characteristics affect power systems. The chapter closes by discussing why intraday markets can be understood as an integration instrument (Sect. 2.4).
2.1 The characteristics of renewable energy sources
The electricity production of weather-dependent renewable energy sources, such as output from wind turbines and photovoltaic installations, has three essential characteristics.
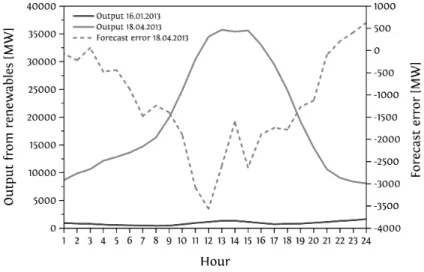
Figure 2.1: Output from wind turbines and photovoltaic installations in Germany for two days in 2013 as well as the difference between their day-ahead forecasted and their delivered output on 18.04.2013. Data from EEX Transparency (2014).
CHAPTER 2. RENEWABLE ENERGY SOURCES AND INTRADAY MARKETS
First, the output from renewables is produced with (basically) zero marginal costs and without greenhouse gas emissions. This implies that cost-efficient operation of a power system will aim at maximising the feed-in of the installed capacity, given that supply security is ensured. As a consequence, the main purpose of dispatchable power generators, such as coal, gas, and oil-fired power plants, has been reduced to cover the remaining difference between the electricity demand and the feed-in from renewables. This “crowding out” is intended by policy makers since it contributes to the reduction of carbon emissions and the dependency on the import of fossil fuels.
Second, the output from renewables is variable. Fig. 2.1 shows the feed-in from wind turbines and photovoltaic installations in Germany for two days in 2013. Whereas the generation from noon to 1 p. m. was 4,100 megawatts (MW) on 16.01.2013, the output amounted to 35,741 MW on 18.04.2013 during this hour (approx. half of the electricity demand). This implies that the conventional power plant portfolio has to cover nearly the entire electricity demand in some hours and only a small fraction in others. The variability of the feed-in also reflects its volatility. On 18.04.2013, the renewables output increased by 4,077 MW between 11 a. m. and noon, in the next hour by 1,243 MW, then dropped by 340 MW, slightly increased again by 219 MW, and then dropped by 2,625 MW in the following hour. Hence, the required output from thermal power plants can vary significantly within a few hours. Third, the output from weather-dependent renewables is uncertain. This means that it is not known a priori to what extent the expected electricity production from renewables matches the quantities that can actually be delivered. This uncertainty is attributable to the fact that production from wind turbines and photovoltaic installations depends on the natural environment and that the future states of this environment cannot be forecasted perfectly. In this context, Fig. 2.1 shows the fore-cast error—the difference between the day-ahead forefore-casted and the actual output from renewables—for 18.04.2013. We can see that the actual electricity production was significantly higher than the anticipated output; between 11 a. m. and noon, the overproduction amounted to 3,562 MW. Such deviations are relevant since the conventional power plant portfolio is typically dispatched according to the day-ahead forecast of the feed-in from renewables. If the production that can actually be delivered the next day deviates from the anticipated output level, thermal power generators or electricity demanders have to respond to this under- or overproduction from renewables accordingly.1
2.2 Effects in the power system – zero marginal costs
The fact that renewables require high investments and do not have (relevant) variable production costs implies that their output should be used whenever possible. As
1Note that the uncertainty of weather-dependent renewables is not the only reason for adjustment
needs. Especially load forecast errors and unexpected power plant outages require the response of the entities in a power system.
2.2. EFFECTS IN THE POWER SYSTEM – ZERO MARGINAL COSTS
already discussed, fossil-fuelled power plants thus have to cover the remaining difference between the electricity demand and the feed-in from renewables. This difference is typically termed “residual load”.
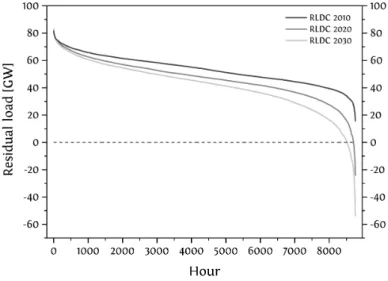
Figure 2.2: Residual Load Duration Curves for the German electricity market in the years 2010, 2020, and 2030 considering installed capacities of 36.5 GW (2010), 86 GW (2020), and 119.8 GW (2030) for weather-dependent renewables. Data from Gunkel et al. (2012).
To show the relevance of this term, Fig. 2.2 sorts hourly residual loads for the years 2010, 2020, and 2030 in descending order to create Residual Load Duration Curves (RLDCs) for the German electricity market. As indicated by the area under the curves, the utilisation of the conventional power plant portfolio will decrease with an increasing share of renewables. In this context, the ends of the three curves are of particular interest. The left ends show that the highest required output during one year stays almost constant. This is because even in a power system with a high share of weather-dependent renewables, their output can be close to zero (compare Fig. 2.1). At their right ends, the RLDCs differ from each other. More renewable capacity results in more hours with a higher feed-in and thus low residual loads. In fact, the curves for 2020 and 2030 show that the output from wind turbines and photovoltaic installations can be expected to exceed the electricity demand in a few number of hours.
Whereas the residual load and its evolution over time show to what extent and in which situation conventional power plants are crowded out, Fig. 2.2 does not provide concrete insights into the market impact of renewables. In most electricity markets in Europe, a uniform-price day-ahead auction builds the foundation for organising the exchange between buyers and sellers of electricity. More specifically, the intersection of the supply and demand curves gives the clearing price at which all quantities are traded for a given hour. In simple terms, the supply curve—called “merit order”—is constructed by the power exchange by sorting the submitted sell offers in ascending
CHAPTER 2. RENEWABLE ENERGY SOURCES AND INTRADAY MARKETS
order with respect to their price. Since market participants are expected to offer their short-run marginal costs of production, the “order of merit” is strongly determined by the technology-specific fuel prices. For example, lignite is less expensive than natural gas so that, under most conditions, the marginal costs of lignite-fired power plants are lower than the marginal costs of gas-fired power stations. As a consequence, a lignite plant will be positioned before a gas plant on the merit order and is therefore more likely to be dispatched.
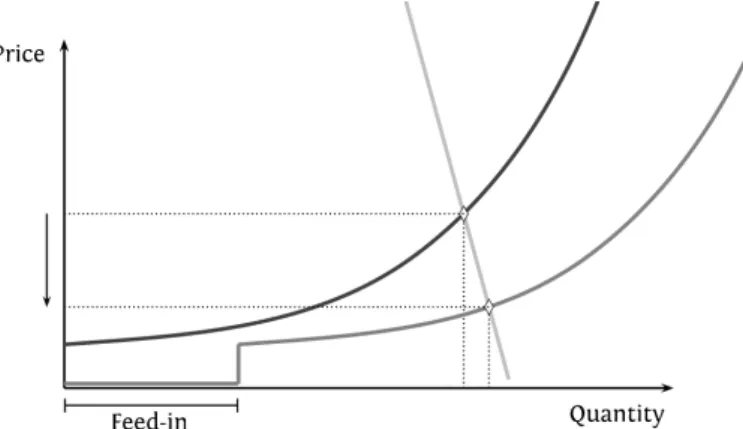
Figure 2.3: Simplified illustration of the merit order effect induced by renewable energy sources.
Since the feed-in from renewables is produced with zero marginal costs, offering the forecasted output in the day-ahead market shifts the thermal merit order to the right (see Fig. 2.3). The consequences of this shift are summarised as the “merit order effect of renewable energy sources” and are mainly twofold. First, given a certain level of demand, some power plants are shifted behind the intersection of the supply and demand curves and are thus not dispatched any more (note the connection to analysing the residual load). They lose the opportunity to produce and therefore do not earn profits to amortise investments. This is especially relevant for gas-fired power plants as they are often positioned around the intersection of the market
curves.2 Second, the right-shift of the merit order lowers the clearing price of the
day-ahead auction. On the one hand, this means that electricity demanders have to pay less for consuming electricity so that there is a gain in consumer surplus. On the other hand, all dispatched power plants earn less profit as the producer surplus
2The merit order effect can induce a significant reduction of full-load-hours of gas-fired power
plants. This is problematic because they are relatively flexible and can hence adjust output fast and at short notice. This flexibility is lost or reduced if these plants are dispatched in fewer hours and, in the long run, investments in gas-fired generation capacity become unprofitable. However, note that the aim of introducing renewable energy sources is to crowd out fossil-fuelled generation. Yet from a system perspective it would be preferable if renewables would predominantly replace more inflexible and more carbon-intensive production options. Policy makers can address this issue by increasing the costs for carbon emissions as this increases the relative competitiveness of gas-fired generation.
2.3. EFFECTS IN THE POWER SYSTEM – VARIABILITY AND UNCERTAINTY
decreases. Regarding the supply side, the incentive to invest in generation capacities becomes weaker in the long run. This is generally not objectionable since a higher capacity of renewables should give information to market participants that fewer (conventional) capacities are needed. However, this substitution also means a loss in flexibility because the output of fossil-fuelled power plants is controllable and thus
relevant for ensuring system stability.3 For more detailed analyses of the impact of
renewables on day-ahead electricity markets, see Sensfuß et al. (2008), Nicolosi and Fürsch (2009), de Miera et al. (2008), and Weigt (2009).
2.3 Effects in the power system – variability and uncertainty
The fact that the feed-in from renewables is variable and uncertain raises challenges to the power system mainly because its stability depends on ensuring a permanent equilibrium of supply and demand. Not maintaining this equilibrium adequately can cause supply interruptions which pose significant costs to an economy. Hence, large weather-induced output changes require corresponding adjustments either on the supply or the demand side. To a large extent, electricity demanders align their consumption to their activities and not to the current level of electricity supply. This is not only because they do not favour postponing or avoiding their electricity-consuming activities; in most electricity markets, especially the residential sector does not receive any price information that reflects the current state of the power
system.4 This means that the demand side is highly inflexible in responding to
changing and unexpected injections into the electricity grid. As a consequence, predominantly controllable electricity generators, such as coal, gas, and oil-fired power stations, have to balance the variable and uncertain feed-in. Hence, they have to reduce and increase output within short periods of time and at short notice. As a consequence, thermal power generators may not only have lower full-load-hours and lower revenues due to the feed-in from renewables (recall the merit order effect); they will also have costs for adjusting their output. As these adjustment capabilities are often offered and procured via markets, however, generators get compensated for these costs and also have the possibility to earn additional profit.
Researchers are interested in quantifying the impacts of the uncertain and vari-able feed-in from renewvari-ables because it allows the evaluation of the “true costs” of renewables. Whereas variability costs mainly result from having to perform frequent load changes, uncertainty costs predominantly stem from a power plant dispatch which is inefficient given the actual production from renewables. In this context,
3Note that the price reduction due to the merit order effect also influences the profit for renewable
producers. For more insights, see Hirth (2013).
4Demand response (DR) measures aim at providing information to electricity consumers which
reflects the current level of supply and demand. As a consequence, consumers are given the incentive to respond to this information by either shifting or shedding load. This allows them to reduce electricity costs and enhances the contribution of the demand side to react to changes on the supply side. For more information on DR measures, see e. g. Strbac (2008) and Paulus and Borggrefe (2011).
CHAPTER 2. RENEWABLE ENERGY SOURCES AND INTRADAY MARKETS
Müsgens and Neuhoff (2006) presented a linear optimisation model to analyse how wind generation affects thermal power generators. They calculated the impact on generation costs, costs due to partial load operation, and start-up costs. Using data from the German electricity market for the year 2003, they found that wind uncer-tainty had significant effects on the volatility of electricity prices. Yet the additional costs from this uncertainty were not as high as the costs associated with the volatility of the wind feed-in. Especially partial load costs and start-up costs increased with higher volatility. Zipf and Möst (2013) used a stochastic electricity market model to calculate the indirect system costs resulting from the uncertain and volatile feed-in of wind turbines and photovoltaic installations. They assessed how the characteristics of renewables induce costs for the conventional power plant portfolio (e. g. start-up and partial load costs). Using data from the German electricity market, their results support the finding of Müsgens and Neuhoff (2006) that the volatility of the feed-in can contribute substantially to total indirect system costs. However, Zipf and Möst (2013) concluded that the costs resulting from uncertainty would increase significantly with the share of renewables in the power system. Especially the introduction of large amounts of photovoltaic capacity would reduce total volatility costs and make uncertainty costs more relevant. For the year 2013, they calculated indirect system costs of approx. EUR 1.25 for each megawatt hour (MWh) of feed-in from photovoltaic installations and approx. EUR 2.25 for each megawatt hour of feed-in from wfeed-ind turbfeed-ines.
2.4 Integration instruments and intraday markets
The expression “integration of renewables” can be understood as the process of utilising the output from renewable energy sources in a power system. This integra-tion must deal with the previously discussed characteristics of weather-dependent renewables. The reason is that the aim should be the maximisation of the infeed from a given production capacity while considering its “externalities” (e. g. volatility and uncertainty costs). In fact, cost-efficient integration should make use of the output from renewables as long as its marginal system value is higher than its marginal system costs (compare Jacobsen and Schröder, 2012; Finon and Perez, 2007). As a consequence, reducing the negative impacts of the non-dispatchable feed-in affects this trade-off so that a higher utilisation of the installed capacity becomes optimal. Integration instruments, such as transmission expansion and storage power plant investments, contribute in this respect (compare Boie et al., 2014).
The transmission network allows the disaggregation of the sites where electricity is produced from the locations where it is consumed. This local shifting of electricity production has several benefits regarding the integration of renewables. For example, the power plant portfolio can be operated more efficiently. In Germany, a large part of the installed wind capacity is located in the north. However, the regions with the highest loads are located in the west and south of Germany. Inadequate transmission
2.4. INTEGRATION INSTRUMENTS AND INTRADAY MARKETS
capacity between the centre of wind production and high demand may not allow utilisation of the entire wind turbines’ output where it is needed. As a consequence, output generated with zero marginal costs may have to be curtailed and a fossil-fuelled power plant located near the load centre may have to operate instead (see Weigt et al., 2010). Similarly, adequate interconnector capacity between market areas can permit use to be made of excess production in the case of negative residual loads (recall Fig. 2.2). For more information on the relevance of transmission expansion, see e. g. Schaber et al. (2012), Gunkel and Möst (2014), and Fürsch et al. (2013).
Whereas transmission lines make it possible to shift electricity production spa-tially, storage power plants enable the shifting of output in time (see Beaudin et al. (2010) and Connolly et al. (2011) for an overview of storage technologies and their relevance). In a liberalised electricity market, this shifting works via the price mech-anism as the business model of storage plants is to exploit price differences; they aim at buying electricity at low prices and selling the stored quantities when the electricity prices are high (Loisel et al., 2010). Since low market prices typically emerge in times of low residual loads (and thus in times of high renewables feed-in), storage plants store electricity when the output from renewable energy sources is large. Following this reasoning, storage power plants typically sell when the feed-in from renewables is low because the residual load and hence the electricity price are likely to be high.
Intraday markets for electricity do not provide “physical capabilities” to deal with renewables as transmission lines or storage plants do. Nevertheless, such markets can be understood as an instrument to contribute to the integration of renewables. This is because they organise the interactions between entities in a power system by allowing market participants to buy and to sell electricity until close to physical delivery. The possibility to trade “within the day” is important as most power exchanges employ a day-ahead market for the allocation of quantities to buyers and sellers of electricity. In simple terms, this means that market participants can submit buy and sell offers for each hour of the following day. The power exchange constructs hourly supply and demand curves based on these offers and determines the uniform clearing price for each hour of the next day by finding their intersection point (recall Fig. 2.3). However, new information—such as unexpected outages of power plants and improved forecasts of the electricity demand and the feed-in from renewables— emerges after the closure of the day-ahead market. Power generators and electricity demanders may want to respond to this new information by adjusting their scheduled production or consumption for one or more hours in the future. A continuous intraday market allows them to do so; market participants can trade electricity for each hour covered by the day-ahead auction from shortly after the closure of the day-ahead market until close to real time (in Germany, for example, until 45 minutes before physical delivery). This means that the intraday market can be thought of as an instrument for organising the reallocation of the outcomes of the day-ahead auction. Consider, for example, that a wind power manager obtains a short-term forecast of wind speeds which leads to the expectation that the electricity output for an hour in the future will be higher than the amount sold in the day-ahead market.
CHAPTER 2. RENEWABLE ENERGY SOURCES AND INTRADAY MARKETS
As a consequence, the manager wants to sell the anticipated overproduction in order to avoid an unbalanced position in the future hour. In contrast, an operator of a gas-fired power plant dispatched in the day-ahead auction for this hour may want to earn additional profit by offering the flexibility to reduce output at short notice. A continuous intraday market allows both entities to engage in a bilateral but anonymous transaction so that the wind power manager avoids (costly) imbalances and the plant operator can profitably exploit the advantage of being dispatchable. From the point of view of market participants with unbalanced positions, the intraday market can thus be understood as the access to a large pool of options for making use of the flexibilities and capabilities the power system provides.
Overview of intraday markets
This chapter provides a basic understanding of continuous intraday markets for electricity. Whereas Sect. 3.1 shows the placement of intraday markets in liberalised power systems, Sect. 3.2 discusses their design and functionality. The last part of the chapter introduces the intraday markets in Spain, Scandinavia, and Germany as they can be considered the most relevant arrangements in Europe and reflect the variety of design choices (Sect. 3.3).
3.1 Intraday markets in power systems
The liberalisation of the electricity sector resulted in the unbundling of geographic monopolies which integrated the production, transmission, distribution, and the retail supply of electricity (see Joskow, 2008). This process of fragmentation required instruments to organise the interactions of the now independently-acting entities. As a consequence, wholesale markets emerged which allow electricity generators to
sell their output to electricity demanders.1 As Fig. 3.1 shows, these demanders can
be large consumers (e. g. companies from the industry sector) or retail companies that use the wholesale market to supply electricity to small consumers (e. g. private households).
Power exchanges have installed different types of markets to cover the need of participants to buy or to sell electricity both in the long and in the short term (compare Deng and Oren, 2006). Futures and forward markets allow electricity
trading for future months or years.2 This gives power generators the possibility to
create certain revenue streams for future points in time and thus helps to manage price risks introduced by the liberalisation process (Ausubel and Cramton, 2010). Similarly, retail companies participate in futures and forward markets to hedge their
1In most power systems, there is no obligation to participate in markets operated by power
exchanges. Hence, bilateral long-term contracts and privately negotiated “Over The Counter” transactions are also instruments to organise the interactions between market entities (see Duffie, 2012).
2While both futures and forwards are contracts to buy or to sell electricity for a specified price at a
specified time in the future, futures are more standardised (e. g. in terms of transaction and settlement requirements). See Deng and Oren (2006) and Maurer and Barroso (2011) for more information.
CHAPTER 3. OVERVIEW OF INTRADAY MARKETS
risks in the business with their customers. As the point of physical delivery comes closer, market entities gain new information and need to adjust accordingly. For example, a retail company has more accurate forecasts regarding the electricity demand of private households and wants to update the general position taken in the futures market. Due to such needs, power exchanges operate spot markets where electricity can be traded close to real time. These markets (day-ahead and intraday markets in Fig. 3.1) are of high importance because ensuring a permanent equilibrium of supply and demand requires short-term interactions between the entities in a power system.
Figure 3.1: A simple illustration of a liberalised power system with wholesale and retail competition (based on Kirschen and Strbac, 2004).
Day-ahead markets allow the sale or purchase of electricity for each hour of the following day. They can be considered the reference markets in most power systems and result in an allocation which is close to the allocation at real time (compare e. g. Viehmann, 2011). Nevertheless, new information can emerge within the time frame between the closure of the day-ahead market and physical delivery. In a power system with a high share of weather-dependent renewables, significant deviations can arise
between the forecasted and the actual feed-in (recall Sect. 2.1).3 Intraday markets
3Demand uncertainty and unexpected power outages also result in the need to adjust the positions
originating from participation in the day-ahead market.
3.2. THE DESIGN OF INTRADAY MARKETS
provide the possibility to react to such information by allowing market participants to trade electricity close to physical delivery (in Germany, for example, until 45 minutes before real time). This benefits the entities who have unbalanced positions and gives additional profit opportunities to those market participants who can offer to compensate for these imbalances.
Although intraday trading allows the update of day-ahead allocations subject to new information, small deviations will nevertheless arise until physical delivery. These mismatches between supply and demand generally require instant response and are therefore not managed by trading via a power exchange. To counteract such real-time deviations, prequalified power generators are committed to providing bal-ancing services by adjusting their electricity output in order to allow stable operation of the electricity network. For more information on the design and the operational procedures of electricity markets, see Sioshansi (2008), Cochran et al. (2013), and Hiroux and Saguan (2010).
3.2 The design of intraday markets
3.2.1 Auctions and their characteristicsAn auction can be understood as a mechanism to exchange goods for money. The characteristics of the mechanism for organising this exchange determine the type of auction. For example, an open ascending-bid auction (“English auction”) allows participants to openly submit bids for buying goods from a seller (for more informa-tion see Milgrom, 2004; Klemperer, 1999). If no participant is willing to bid above the highest price submitted so far, the auction ends and the goods are allocated to the auction participant with the highest bid and thus the highest willingness to pay (WTP). In contrast, the second-price sealed-bid auction (“Vickrey auction”) requires that all bidders submit sealed bids simultaneously. The bidder who submitted the highest bid wins the auction but does not pay his or her own but the second-highest submitted bid for acquiring the goods. Both the English auction and the Vickrey auction are one-sided auctions because there is a single seller and multiple buyers competing against each other.
Day-ahead and intraday markets for electricity are organised as double auctions since they allow buyers and sellers to submit offers.4Double auctions can be classified as auctions with periodic or continuous clearing (Madhavan, 1992). Periodic auctions typically rely on institutional trade determination and price setting. In the case of electricity, this means that buyers and sellers submit offers to a power exchange. The power exchange then determines which offers are successful and finds the price at which transactions clear. To facilitate this institutional clearing process, periodic double auctions are typically based on a uniform pricing rule (Parsons et al., 2008). Hence, the power exchange uses the submitted asks to construct a supply curve
CHAPTER 3. OVERVIEW OF INTRADAY MARKETS
and the submitted bids to find a demand curve for electricity. The intersection of both curves determines the allocation of quantities as well as the uniform clearing price; the quantities to the left of the intersection point are sold by the sellers to the buyers at the clearing price (compare Fig. 2.3). Such discrete, uniform-price double auctions constitute all major day-ahead markets but only few intraday markets in Europe. In contrast to periodic auctions, continuous double auctions (CDAs) generally rely on non-institutional trade determination and price setting. Hence, market participants themselves are responsible for deciding which quantities are traded at which price. Because there is no uniform pricing rule, a continuous double auction is a discriminatory price auction (see Wurman et al., 1998).5As this thesis is concerned with intraday markets that are organised as continuous double auctions, the following section discusses the design and functionality of these types of markets in more detail.
3.2.2 Intraday markets as continuous double auctions
An intraday market organised as a continuous double auction delegates the clearing process to the market participants. Hence, the power exchange needs to provide a framework which gives information to the participants and allows them to engage in transactions with each other. This framework is the “open order book”. As Fig. 3.2 shows, the open order book has a side where bids (buy offers) are collected and a side where asks (sell offers) are collected. Market participants can thus submit offers to the order book by specifying a quantity and a limit price. The limit price is either the indicated maximum willingness to pay (bid) or the minimum willingness to accept (ask) for each unit (megawatt hour) of the specified quantity. On the left-hand side of the order book illustrated in Fig. 3.2, bids are sorted in descending order with respect to their limit price. The right-hand side sorts the asks in ascending order. This means that the current “best offers” are positioned at the top of the order book. If two or more offers have the same limit price, their rank is decided by the time the order was submitted (older first). Note that in the depicted order book, the highest limit bid price is below the lowest limit ask price. The indicated willingness to pay of the buyer is therefore not sufficiently high to engage a seller in a transaction. The magnitude of this discrepancy between the prices at the top of the order book is measured with the bid-ask-spread (compare Huang and Stoll, 1997).
Let us now assume that a seller submits an ask to sell 30 MWh at a limit price
of e37.5/MWh. To follow the reaction of the order book illustrated in Fig. 3.2, note
that the limit price of the submitted ask is lower than the limit price of the two best available bids. Furthermore, their combined quantity (25 MWh) is lower than the quantity of the submitted ask. As a consequence, the incoming sell offer can be matched against the two bids, which are fully satisfied. Because only 25 MWh of the
5Continuous double auctions are frequently applied in the financial sector (e. g. at the New York
Stock Exchange). In fact, they can be considered the most relevant market institution for the trading of equities, commodities, and derivatives (Das et al., 2001).
3.2. THE DESIGN OF INTRADAY MARKETS
submitted 30 MWh are sold, the remaining five megawatt hours are stored in the order
book. Since the submitted price ofe37.5/MWh is lower than the limit prices of the
existing asks, the offer is positioned at the top of the order book.
Several possibilities exist to determine the clearing prices in a continuous double auction. For example, the price at which two orders are matched can be found with
kpbi d+(1−k)pask,
where pbi d is the bid price, pask is the ask price, and k can be chosen between
zero and one (see Satterthwaite and Williams (1989) for more information and the implications of this price-setting rule). In intraday markets for electricity, it is common to clear a transaction at the price of the offer first stored in the order book. For the presented example, this means that the market participant sells 15 MWh for
e40/MWh and 10 MWh fore38/MWh. Hence, the buyers “pay as bid” and the seller
receives a higher price than the indicated minimum willingness to accept specified by the limit price.
Figure 3.2:Simplified illustration of an open order book. The left-hand side contains bids sorted in descending order with respect to their limit price. The right-hand side of the order book contains the submitted asks sorted in ascending order.
Continuous intraday markets allow participants to use limit orders with different execution restrictions. For example, it can be specified that non-executed parts of an order are not stored in the order book. In the presented example, we would have the same transactions but the remaining five megawatt hours would be deleted immediately. Another example is that market participants can use the restriction that orders are only executed if the specified quantity can be traded entirely. Whereas limit orders require the specification of a limit price, there is no such need when trading with market orders. Therefore, a market order trades a chosen quantity at the best available prices in the order book. Although common in the financial sector, most intraday markets for electricity do not offer the possibility to trade with market orders. Note, however, that a limit order can be specified in such a way that it is equivalent to a market order.
CHAPTER 3. OVERVIEW OF INTRADAY MARKETS
3.2.3 Cross-border trading in continuous intraday markets
Market coupling refers to the integration of electricity markets by allowing transac-tions between entities from different market areas. It is thus an important instrument for increasing economic efficiency (see Meeus et al., 2009; Hobbs et al., 2005). To allow cross-border trading in continuous intraday markets, three fundamental require-ments have to be met. First, there needs to be an adequate amount of transmission capacity between the market regions. Second, a mechanism must exist for allocating this transmission capacity. Third, the infrastructure behind the order book must have the capability to include offers from different market regions subject to the currently available transmission capacity.
Figure 3.3:Simplified illustration of the mechanism for intraday implicit capacity allocation (based on ENTSO-E, 2012).
The “implicit continuous capacity allocation method” is a well-suited approach to respond to these requirements. It is the method preferred by power exchanges operating continuous markets and has also been proposed for creating an integrated European intraday market (ENTSO-E, 2012). Fig. 3.3 illustrates the workings of a system which makes use of implicit continuous capacity allocation by showing the interactions of its main elements. The central parts are the “Shared Order Book” (SOB) and the “Capacity Management Module” (CMM). The SOB builds the connection between the order books of the involved power exchanges or market areas. The CMM is managed by the involved Transmission System Operators (TSOs) as they use it to announce the available transmission capacity. If a trader submits an order to the order book in market area A (OOB-A), the SOB module recognises this activity and checks the available transmission capacity via the CMM. Given that this capacity is sufficient
3.3. INTRADAY MARKETS IN EUROPE
to allow a cross-border transaction, the order is also shown in the open order book in market area B (OOB-B). After each trade across market areas, the transmission capacity available for intraday trades is updated; it decreases in the direction of the transaction and increases for trades in the opposite direction. This interaction between the Shared Order Book and the Capacity Management Module is instant. If an order from OOB-A is shown in OOB-B and the required transmission capacity is no longer available, the order disappears in OOB-B. If a TSO releases more transmission capacity, the interactions between the CMM and the SOB make the resulting cross-border trading opportunities available to the market areas.
3.3 Intraday markets in Europe
3.3.1 The intraday market in Spain (OMIE)OMI-Polo Español S.A. (OMIE) operates the intraday market for Spain and Portugal. The process of matching the needs of buyers and sellers is organised not as a continuous double auction with discriminatory pricing, but as multiple uniform-price double auctions (for more information see OMIE, 2014a). This means that the power exchange calculates supply and demand curves for each hour based on the market participants’ offers. The intersection point of both curves determines the hourly uniform clearing price and the allocation of quantities.
Figure 3.4:Volumes and prices from the Spanish intraday market. Data from OMIE (2014b). The intraday market started operation in 1998 and allows the trading of electricity at six auction sessions per day. The first session opens at 5 p. m. and closes at 6:45 p. m. Within this time frame, market participants can submit offers to trade electricity for 27 hours (from 9 p. m. to midnight of the next day). As the last hour of the next day
CHAPTER 3. OVERVIEW OF INTRADAY MARKETS
comes closer with every session, the sixth session opening at noon covers only nine auctions (for the hours from 3 p. m. to midnight).
Fig. 3.4 shows the traded volumes and the average market prices for the Spanish intraday market. The market is relatively liquid as the volume amounts to approx. 20 percent of the volume traded on the day-ahead market (OMIE, 2014b). This shows that market participants have a relevant need for adjusting their positions after the day-ahead auction. As the installed capacity of weather-dependent renewables amounted to 29.5 GW in 2013 (ENTSO-E, 2014c), an important determinant of this need should relate to balancing the uncertain feed-in from renewables. Nevertheless, the day-ahead market must be considered the reference market and the average intraday market price shown in Fig. 3.4 is very similar to the corresponding average price of the day-ahead auction. For more detailed insights into the Spanish intraday market, see Chaves-Ávila and Fernandes (2015).
3.3.2 The intraday market in Scandinavia (Nord Pool Spot)
Nord Pool Spot AS, which is owned by Nordic and Baltic Transmission System Operators, manages the intraday market “Elbas” (Electricity Balance Adjustment System). Elbas covers the Nordic region except Iceland (Denmark, Finland, Norway, and Sweden), the Baltic region (Estonia, Latvia, and Lithuania), and Germany (for
more detailed information see Nord Pool Spot, 2014b).6 The intraday market is
organised as a continuous double auction. That is, market participants can trade electricity continuously by submitting limit orders to an open order book. Limit orders can be specified as “Fill” or “All-or-Nothing” (for more information see Nord Pool Spot, 2013, 2012). Whereas a Fill-order allows partial execution, the classification “All-or-Nothing” only results in a transaction if the entire volume can be traded.
In the order book, the bids and asks are sorted with respect to the limit price. If two or more orders have the same price, they are ranked according to their time stamp (oldest first). The price of a transaction is determined by the limit price of the order first stored in the book. Regarding the connection of market areas, Elbas allows implicit cross-border trading. As explained in Sect. 3.2.3, this implies the existence of a Capacity Management Module and a Shared Order Book. Hence, the available transmission capacity between market areas, which is updated after every transaction, determines whether a submitted order is also shown in the books of connected market regions.
Although Elbas covers many countries, the trading volume is relatively low (3.2 TWh in 2012 and 4.2 TWh in 2013), especially in comparison to Nord Pool Spot’s day-ahead market “Elspot” where 349 TWh were traded in 2013 (Nord Pool Spot, 2014a). One plausible reason is that weather-dependent renewables do not play a significant role in the core countries covered by Elbas. In 2013, the combined capacity of wind turbines and photovoltaic installations in Denmark, Finland, Norway,
6The Elbas trading system is furthermore used by Belpex and APX to operate the intraday markets
in Belgium and the Netherlands.
3.3. INTRADAY MARKETS IN EUROPE
Sweden, Estonia, Latvia, and Lithuania amounted to 11.3 GW; for comparison, the capacity in Germany was nearly 71 GW (ENTSO-E, 2014c).
3.3.3 The intraday market in Germany (EPEX SPOT)
EPEX SPOT SE was founded in 2008 to merge the spot market activities of EEX AG
(Germany) and Powernext SA (France).7The market area comprises Germany, France,
Austria, and Switzerland and is embedded into price coupling with North-Western and South-Western Europe. EPEX SPOT operates a day-ahead as well as an intraday market. The day-ahead auction is a uniform-price double auction, takes place at noon (11 a. m. in Switzerland) and allocates quantities to buyers and sellers for every hour of the following day.
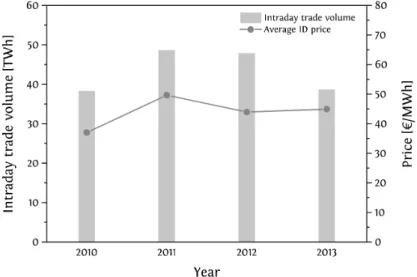
Figure 3.5:Intraday trade volumes, average intraday prices, and average day-ahead prices from the German electricity market. Data from EPEX SPOT (2014); EEX (2014c).
The intraday market, which is organised as a continuous double auction, opens at 3 p. m. and thus gives market participants the possibility to adjust their day-ahead position from shortly after the day-ahead auction to close before physical delivery. The lead time between the closure of the intraday market and physical delivery was reduced from 75 minutes to 45 minutes in 2011 for the intraday markets in Germany and France. These two markets were complemented by continuous intraday markets in Austria in 2012 and Switzerland in 2013 (both with 75 minutes lead time). EPEX SPOT uses implicit intraday trading to manage cross-border trades between market regions. The interactions between the Capacity Management Module and the Shared Order Book hence enable a connection to be established between the order books
CHAPTER 3. OVERVIEW OF INTRADAY MARKETS
of different market regions. This means, for example, that an order submitted in the German market becomes visible in the order book of the French market if the available transmission capacity allows this trade.
In Germany and Switzerland, market participants can not only trade single hours (and blocks of hours) but also quarter-hours. These 15-minute contracts were introduced in December 2011 to provide more flexibility in responding to the feed-in of renewables. This is especially relevant for photovoltaic installations as their output can increase or decrease significantly during an hour.
Figure 3.6:Comparison of the average price of the 100 lowest-price hours and the average price of the 100 highest-price hours. Data from EPEX SPOT (2014); EEX (2014c).
To interact with the open order book, market participants can use limit orders and market sweep orders. A market sweep order is a block order which is matched with one-hour contracts and is executed immediately as far as possible. Limit orders can be submitted with execution restrictions “All-or-None” (AON), “Immediate-or-Cancel” (IOC), “Fill-or-Kill” (FOK), or “Iceberg”. The AON restriction prevents partial execution of an order. This means that the offer remains in the order book until the specified quantity can be matched entirely or until it is cancelled by the trader. An IOC order is either executed immediately or deleted immediately. This implies that the order, or a part of it, are not stored in the book. Specifying a limit order with “Fill-or-Kill” requires that the order has to be matched entirely and immediately. If these two conditions cannot be fulfilled, it is immediately cancelled and thus not stored in the order book. Note that a limit order with the restriction “IOC” or “FOK” combined with a very high bid price or a very low ask price can be considered equivalent to a buy or sell market order. An Iceberg order divides the total quantity into smaller orders. These smaller orders are entered in the order book successively until the ent