CRANET SURVEY
ON
COMPARATIVE HUMAN RESOURCE MANAGEMENT
CRANET SURVEY
ON
COMPARATIVE HUMAN RESOURCE MANAGEMENT
INTERNATIONAL EXECUTIVE REPORT 2005
TABLE OF CONTENTS
INTRODUCTION... 4
COUNTRIES PARTICIPATING... 4
METHODOLOGY... 6
THE STRUCTURE OF THE REPORT... 7
1. HR ROLES... 8
2. FLEXIBLE WORKING ARRANGEMENTS: DIVERGENCE AND CONVERGENCE ACROSS COUNTRIES... 34
3. EMPLOYEE RELATIONS AND COMMUNICATION... 40
4. PAY... 49
5. TRAINING AND DEVELOPMENT... 53
APPENDIX 1 – THE QUESTIONNAIRE... 58
APPENDIX 2 –PARTICIPATING COUNTRIES... 73
Introduction
‘Cranet’ is an international network of business schools around the world which conducts a survey of Human Resource Management, enquiring into policies and practices in people management through a set of common questions. The survey is undertaken approximately every four years. The purposes of the survey are to provide high quality data for academics, for public and private sector organisations, as well as for students of the field, to inform research and to create new knowledge about Human Resource Management across the world.
This international report is a first of its kind. Whilst Cranet has existed since 1989, and there have been numerous reports and articles on the data gathered, this is the first report to cover such a wide range of countries, from the UK to the USA, from Cyprus to Nepal, from Eastern European countries to Western European countries. As a data set it is therefore unique.
Cranet data is valuable within each country, where it is collected and disseminated by well-known scholars, who comprise the group which meets regularly to steer the project. The international comparisons between countries produce data which are new and interesting, informing debates in many academic fields. Such comparisons are not without difficulties. Changes to the political and economic landscape are charted by Cranet, for example the expansion of European Union membership, but make simple comparisons problematic, for example when examining changes to EU averages over time.
These data were gathered over an eighteen-month period from late 2003 until mid 2005. Such a timeframe is inevitable given the needs of different countries and the varying opportunities for funding and for doing the work, the time taken to conduct the survey, to follow-up, and to report.
The comparisons themselves can prove challenging, as words have different meanings in different countries. Our methodology of translating the surveys from English into each language, and then back into English before the survey, seeks to overcome some of these problems but meanings are in people and their cultures, so in spite of our efforts to obtain exactly the same meaning, there will inevitably be some distortion in some questions. Nevertheless, the longevity of this survey, which has retained a core of the same questions for most rounds of the survey over the years, has through the resulting discussions and debates reduced the differences to a minimum. Readers of this report can therefore be confident that the English language version is as accurate as we can expect, and that these are common meanings for the topics discussed.
Countries participating
Of the countries which normally took part in the survey in the past, only Japan, Portugal, South Africa, Poland and Ireland did not conduct the Cranet survey in this round. New partners have joined us, from Slovakia, Hungary, Iceland, USA, Canada, New Zealand, Philippines and Nepal. The total list of countries taking part in this the 2003/2005 round is 32.
Countries participating in the survey
Australia Greece Sweden Austria Hungary Switzerland Belgium Iceland The Netherlands Bulgaria Israel Tunisia
Canada Italy Turkey
Cyprus Nepal Turkish Cypriot Community Czech Republic New Zealand UK
Denmark Norway USA Estonia Philippines
Finland Slovakia France Slovenia
Content
The data derived from this survey have been collected with a longitudinal perspective in mind. We have therefore followed the same broad areas with the current round as in the past; the six sections being:
Section I HRM activity in the organisation Section II Staffing practices
Section III Employee development Section IV Compensation and benefits
Section V Employee relations and communication Section VI Organisational details
The questions, which are shown in detail in Appendix 1 reveal much data that can be of value to those examining, inter alia, convergence and divergence in HR policies and practices, the impact of globalisation and commercial development on the management of people at work, the changing fortune of the HR occupation itself, relationships between HR practices and performance, how employers associations are regarded around the world, what the trends are in payment systems, and in studying a range of techniques from communications to employee development.
Although a common set of issues have been covered over the different rounds of the survey, new topics are introduced, sparingly, where the network as a whole believe there is a significant development in HRM. Additions to the 1999 survey round made in 2003/2005 were:
Section I
Questions on HR information systems, reflecting the continuing growth in importance of new technology to the processes carried out by the HR function. These included questions about the stage of development of the system, how it is used, and the extent to which it meets the HR function’s needs (Q9, 10, 11, 12 and 13).
Section II
There were minor changes including questions on commercial job and company websites; and on flexibility, questions on the compressed working week, were added.
Section III
Questions about who has the most influence over training needs, design and implementation of training (Q4, A, B and C). The growth of importance of the training and development area is shown here, and there were additional items on the questions about training/learning methods.
Section IV
A question about variable pay was added. Whether team, individual, or company wide performance was being measured (Q3, A, B and C).
Section V
Question 3, the recognition of Trade Unions was a question included, following some changes in regulations about recognition in some countries, and the on-going interest in TU growth/decline. Question 7, satisfaction with Employers Association’s services was added in view of the position of EA’s in many countries, where new services and a new role are being created for Employers’ Associations.
Section VI
A question on the stage at which HR is involved in the process of mergers/acquisitions was added because of the growth in recent years of mergers and acquisitions activity.
Methodology
The methodology of the survey has remained predominantly a paper-based questionnaire, although in some countries (for example the USA) this has now developed into an on-line survey. Reminders are sent out and attempts made to ensure that a representative sample is produced. This is especially important since the number of respondents is not always large, no doubt due to the difficulties inherent in countries where ‘survey fatigue’ has set in amongst HR Directors or their equivalents to whom the survey was sent.
The population in each country was public, private, not for profit, and mixed sector organisations.
Table 1: Number of organisations responding
EU countries (18) Number of responses
UK 1101 France 140 Germany 347 Sweden 383 Spain 158 Denmark 516 Netherlands 397 Italy 117 Finland 293 Greece 180 Austria 270 Belgium 230 Cyprus 85 Estonia 118 Slovenia 161 Slovakia 259 Czech Republic 72 Hungary 59 Total EU countries 4886
Europe - non EU countries (6)
Norway 303
Switzerland 311
Turkey 171
Bulgaria 157
Iceland 114
Turkish Cypriot Community 87
Total Europe - non EU countries 1143
Rest of world (8) USA 260 Canada 456 Australia 259 New Zealand 286 Israel 175 Philippines 56 Nepal 204
The results were reported and discussed in the participating countries, through conferences and seminars, and the analysis of the data was undertaken by the Human Resource Research Centre of Cranfield University, which coordinates the Network.
The structure of the report
The report follows the sequence of the questionnaire, as shown in the contents list. The sections of the report discuss the frequencies and describe or point to any trends, or changes. No detailed analysis is possible in a brief report of this kind, but some key trends are shown in each section. The sections of the report have been written by members of the network. This epitomizes the strength of our network; it is a collaborative adventure in which we are engaged, our commitment to the academic field crosses national boundaries, and our common concern with many of the main themes has retained the membership of organisations over the years.
The authors of the report are:
Section I Nancy Papalexandris
Section II Erling Rasmussen and Eleni Stavrou-Costea Section III Shaun Tyson and Paul Gooderham
Section IV Erik Poutsma
Section V Françoise Dany; Florian Hatt; Mila Lazarova; Wolfgang Mayrhofer
All members of the network have, of course, in a sense been the originators of the report because they have produced the data from their surveys. A list of their names is shown in Appendix 2.
No report of this kind can be introduced without an acknowledgement to Professor Chris Brewster, the founding genius of Cranet who left Cranfield in 2001.
Whilst we gratefully acknowledge the roles of all those who have helped to write and produce this report, we would also wish to thank Jayne Ashley who has assisted so ably with the editing of the report, and who, as usual, has made the final document possible.
Nevertheless, any errors or omissions remain our own.
Emma Parry, Shaun Tyson, Sue Brough (Eds). Cranfield University
1.
HR Roles
We begin our description of HR roles with an examination of labour costs in different countries as reported in the survey. This is because one driver of HR specialisation is believed to be the significance of labour costs.
Operating Costs accounted for by labour costs
As shown in Figure 1, Figure 2 and Figure 3, in most of the participating countries labour costs account for 25% to 50% of the total operating costs. This underlines the magnitude of labour costs in the total operating costs of companies around the world. Labour costs represent the highest percentage of the total operating costs in the Netherlands (64%), Canada (59%), Denmark (59%), Norway (56%), the USA (53%) and Sweden (52%). They have the lowest impact on total operating costs in Slovakia (19%), Turkey (23%), Bulgaria (25%), Hungary (27%) and Czech Republic (26%). This is most probably due to the lower labour costs, as well as the mix of industries in countries where for example there is a large agricultural sector.
Figure 1: Operating costs accounted for by labour costs (EU countries)
0.0 10.0 20.0 30.0 40.0 50.0 60.0 70.0 UK Fran ce Ger man y Swed en Spa in Den mar k Net herla nds Italy Finl and Gre ece Aus tria Bel gium Cyp rus Esto nia Slo veni a Slo vaki a Cze ch R epub lic Hun gary m e a n % o f o p e ra ti n g c o s ts
Figure 2: Operating costs accounted for by labour costs (Europe – Non EU countries) 0.0 10.0 20.0 30.0 40.0 50.0 60.0
Norway Switzerland Turkey Bulgaria Iceland Turkish Cypriot Community m e a n % o f la b o u r c o s ts
Figure 3: Operating costs accounted for by labour costs (Rest of the world)
0.0 10.0 20.0 30.0 40.0 50.0 60.0 70.0 USA Can ada Aus tralia New Zea land Israel Philip pine s Nep al Tuni sia m e a n % o f o p e ra ti n g c o s ts
The Head of the personnel/HR department has a place on the main Board of
Directors or the equivalent
In the majority of the world, the head of the personnel/HR department seems to participate on the main board of directors at a percentage ranging from 40% to 70% of the companies. The participation of the HR/personnel director on the Board is most common in France (91%), Tunisia (92%), Belgium (79%), Sweden (88%) and Israel (85%). Participation is least common in Turkey (25%) and the Turkish Cypriot Community (32%), Greece (34%), Cyprus (35%) and Bulgaria (40%), all of which belong to the larger group of southern Balkan countries. Whilst there is some regional specificity, the reasons for HR to be represented at Board level by an HR specialist may be because of other factors, such as the extent of development of the function, board structure and the mix of industry sectors, the presence of multinationals etc. HR may be represented as part of a general management remit by other Directors, or by the CEO, for example.
Figure 4: The Head of the personnel/HR department has a place on the main Board of Directors or the equivalent (EU countries)
0 10 20 30 40 50 60 70 80 90 100 UK Fran ce Ger man y Swed en Spa in Den mar k Net herla nds Italy Finl and Gre ece Aus tria Bel gium Cyp rus Esto nia Slove nia Cze ch R epub lic Hun gary % o f o rg an isat io n s
Figure 5: The Head of the personnel/HR department has a place on the main Board of Directors or the equivalent (Europe- non EU)
0 10 20 30 40 50 60 70 80
Norway Switzerland Turkey Bulgaria Iceland Turkish Cypriot Community % o f o rg an isat io n s
Figure 6: The Head of the personnel/HR department has a place on the main Board of Directors or the equivalent (Rest of world)
0 10 20 30 40 50 60 70 80 90 100 USA Can ada Aus tralia New Zea land Israel Philip pine s Nep al Tuni sia % o f o rg an isat io n s
Where the senior HR Director was recruited
In most countries, the HR Director usually is an HR specialist coming from outside the organisation. This is most pronounced in Anglo-Saxon countries like the USA (52%), the UK (52%), and Australia (55%). Exceptions to this were Denmark, Finland, Austria and Czech Republic, where the HR Director is more likely to be a non-specialist from within the organisation, as well as Slovenia and Turkey, where the HR Director comes more usually from within the HR department. In Cyprus and Nepal other recruitment sources are very common.
Figure 7: Where the senior HR Director was recruited (EU countries)
0 10 20 30 40 50 60 UK Fran ce Ger man y Sw edenSpain Den mar k Net herla nds Italy Finl and Gre ece Aus tria Bel gium Cyp rus Esto nia Slo veni a Slov akia Cze ch R epub lic Hun gary % o f o rg a n is a ti o n s
Within personnel department Non specialist within organisation HR specialist outside organisation Non specialist outside organisation Other
Figure 8: Where the senior HR Director was recruited (Europe, non-EU countries)
0 10 20 30 40 50 60 Nor way Switz erla nd Turk ey Bul garia Icel and Turk ish Cyp riot C omm unity % o f o rg a n is a ti o n s
Within personnel department
Non specialist within organisation HR specialist outside organisation Non specialist outside organisation Other
Figure 9: Where the senior HR Director was recruited (EU countries) 0 10 20 30 40 50 60 USA Can ada Aust ralia New Zea land Israel Philip pine s Nep al Tuni sia % o f o rg a n is a ti o n s
Within personnel department
Non specialist within organisation HR specialist outside organisation Non specialist outside organisation Other
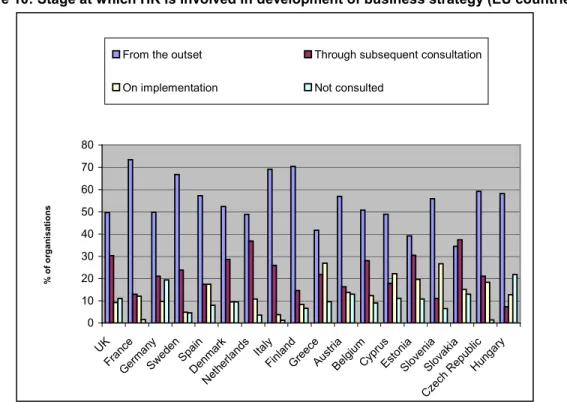
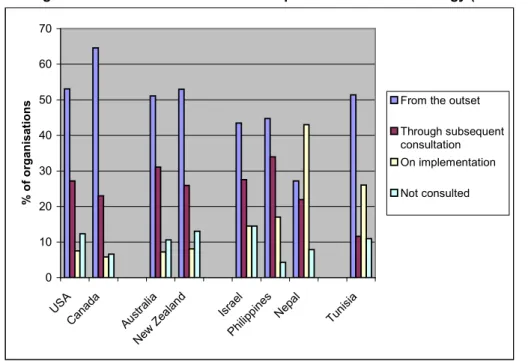
Stage at which HR is involved in development of business strategy
In most countries, HR is involved from the outset in the development of business strategy. In most countries 40%-60% of the respondents reported that HR is involved from the outset in business strategy development. This is most common in France (73%), Finland (70%), Italy (69%), Spain (57%) and Canada (65%). Only in Bulgaria and Nepal is HR most commonly involved on implementation only (at 39% and 43% of the cases, respectively), while in 38% of companies of the Turkish Cypriot community, HR is not involved at all.
Figure 10: Stage at which HR is involved in development of business strategy (EU countries)
0 10 20 30 40 50 60 70 80 UK Fran ce Ger man y Swed en Spa in Den mar k Net herla nds Italy Finl and Gre ece Aus tria Bel gium Cyp rus Esto nia Slove nia Slov akia zech Rep ublic Hun gary % o f o rg a n is a ti o n s
From the outset Through subsequent consultation
Figure 11: Stage at which HR is involved in development of business strategy (Europe-non EU countries) 0 10 20 30 40 50 60 70 Nor way Switz erla nd Turk ey Bulg aria Icel and Turk ish Cyp riot C omm unity % o f o rg a n is a ti o n
s From the outset
Through subsequent consultation On implementation
Not consulted
Figure 12: Stage at which HR is involved in development of business strategy (Rest of world)
0 10 20 30 40 50 60 70 US A Can ada Aust ralia New Zea land Israel Phi lippi nes Nep al Tuni sia % o f o rg an isat io n
s From the outset
Through subsequent consultation On implementation
Existence of HR Strategy
In most countries the prevailing practice is most commonly a written HRM strategy. This is especially notable in Sweden, where around 80% of organisations have a written HR strategy. In some countries, like Germany, Austria, Slovakia and Israel, however, there is a similar frequency of written and unwritten HR strategy (35-40%), but there is some HR strategy to dictate HR policies and actions. In Cyprus and Tunisia the use of an unwritten HR strategy is most common.
There are few cases where countries report a low level of HR strategy development.
Figure 13: HR strategy (EU countries)
0 10 20 30 40 50 60 70 80 90 UK Fran ce Ger man y Swed en Spa in Den mar k Net herla ndsItaly Finl and Gre ece Aus tria Bel gium Cyp rus Esto nia Slove nia Slo vaki a Cze ch R epub lic Hun gary % o f o rg an isat io n s Yes, written Yes, unwritten No Don't know
Figure 14: HR strategy (Europe- non-EU countries)
0 10 20 30 40 50 60 70 80 Nor way Switz erla nd Turk ey Bulga ria Icel and Turk ish Cyp riot C omm unity % o f o rg an isat io n s Yes, written Yes, unwritten No Don't know
Figure 15: HR strategy (Rest of world) 0 10 20 30 40 50 60 70 80 90 USA Can ada Aus tralia New Zea land Israel Philip pine s Nep al Tuni sia % o f o rg an isat io n s Yes, written Yes, unwritten No Don't know
Mission Statement
In most countries, both in Europe and other continents, the vast majority of companies (from 55-85%) have a written mission statement. In Finland (93%), Sweden (89%), Slovenia (87%), Norway (89%), Canada (90%) and Philippines (88%), the percentage of companies with a written mission statement goes, in general, far beyond 85%. Sole exceptions are Bulgaria and the Turkish Cypriot Community, where there is a written mission statement only at the 40% and 28% of the companies examined, respectively.
Figure 16: Mission statement (EU countries)
0 10 20 30 40 50 60 70 80 90 100 UK Fran ce Ger man y Sw edenSpai n Den mar k Net herla ndsItaly Finl and Gre ece Aus tria Belg ium Cyp rus Esto nia Slo veni a Slova kia Cze ch R epub lic Hun gary % o f o rg an isat io n s Yes, written Yes, unwritten No Don't know
Figure 17: Mission statement (Europe, non-EU countries) 0 10 20 30 40 50 60 70 80 90 100 Nor way Switz erla nd Turk ey Bulga ria Icel and Turk ish Cyp riot C omm unity % o f o rg a n is a ti o n s Yes, written Yes, unwritten No Don't know
Figure 18: Mission statement (Rest of world)
0 10 20 30 40 50 60 70 80 90 100 USA Can ada Aus tralia New Zea land Israel Philip pine s Nep al Tuni sia % o f o rg an isat io n s Yes, written Yes, unwritten No Don't know
Corporate Values Statement
In most countries, the majority of companies reported that there is a written values statement. Only in Germany, Austria, Cyprus and the Turkish Cypriot Community, as well as Iceland, is it more common not to have a Corporate Values statement. It is interesting to note that in those countries it is also rare to have a written HR strategy.
Figure 19: Corporate values statement (EU countries)
0 10 20 30 40 50 60 70 80 UK Fran ce Ger man y Swed en Spa in Den mar k Net herla ndsItaly Finl and Gre ece Aus tria Bel gium Cyp rus Esto nia Slove nia Slo vaki a Cze ch R epub lic Hun gary % o f o rg an isat io n s Yes, written Yes, unwritten No Don't know
Figure 20: Corporate values statement (Europe, non- EU countries)
0 10 20 30 40 50 60 70 80 Nor way Switz erla nd Turk ey Bulga ria Icel and Turk ish Cyp riot C omm unity % o f o rg an isat io n s Yes, written Yes, unwritten No Don't know
Figure 21: Corporate values statement (Rest of world) 0 10 20 30 40 50 60 70 80 90 100 USA Can ada Aus tralia New Zea land Israel Philip pine s Nep al Tuni sia % o f o rg a n is a ti o n s Yes, written Yes, unwritten No Don't know
Business Strategy
In most countries the prevailing practice is to have a written Business Strategy (50%-80% of companies examined). Only in Cyprus (37%), Italy (42%) and Israel (48%), less than 50% of the companies examined have a written business strategy. The Turkish Cypriot community is the only case where the practice of unwritten business strategy is more common than the written one, at 59%.
Figure 22: Business strategy (EU countries)
0 10 20 30 40 50 60 70 80 90 100 UK Fran ce Ger man y Swed en Spa in Den mar k Net herla ndsItaly Finl and Gre ece Aus tria Belgi um Cyp rus Esto nia Slo veni a Slova kia Cze ch R epub lic Hun gary % o f o rg a n is a ti o n s Yes, written Yes, unwritten No Don't know
Figure 23: Business strategy (Europe, non-EU countries) 0 10 20 30 40 50 60 70 80 90 100 Nor way Switz erla nd Turk ey Bulga ria Icel and Turk ish Cyp riot C omm unity % o f o rg a n is a ti o n s Yes, written Yes, unwritten No Don't know
Figure 24: Business strategy (Rest of world)
0 10 20 30 40 50 60 70 80 90 100 USA Can ada Aus tralia New Zea land Israel Philip pine s Nep al Tuni sia % o f o rg an isat io n s Yes, written Yes, unwritten No Don't know
Primary Responsibility for Recruitment and Selection
All around the world, it seems that it is common for HR and the line to share the responsibility for recruitment and selection. In some countries it is more common for HR to have an assisting role to the line, while in others it is the other way round. The only exceptions are Nepal and the Turkish Cypriot community, where the main responsibility for recruitment and selection lies more commonly within the hands of the line only.
Figure 25: Primary responsibility for recruitment and selection (EU countries)
0 10 20 30 40 50 60 UK Fran ce Ger man y Swed en Spa in Den mar k Net herla ndsItaly Finl and Gre ece Aus tria Belgi um Cyp rus Esto nia Slo veni a Slova kia Cze ch R epub lic Hun gary % o f o rg an isat io n s Line Mgt
Line Man with HR dept HR with line
HR dept
Figure 26: Primary responsibility for recruitment and selection (Europe, non- EU countries)
0 10 20 30 40 50 60 70 Nor way Switz erla nd Turk ey Bul garia Icel and Turk ish Cyp riot C om mun ity % o f o rg an isat io n s Line Mgt
Line Man with HR dept HR with line
Figure 27: Primary responsibility for recruitment and selection (Rest of world) 0 10 20 30 40 50 60 USA Can ada Aus tralia New Zea land Israel Philip pine s Nep al Tuni sia % o f o rg an isat io n s Line Mgt
Line Man with HR dept HR with line
HR dept
Primary Responsibility for Pay and Benefits
As in the case of Recruitment and Selection, the primary responsibility for Pay and Benefits is shared by the line and HR, with most common practice of HR doing it with the assistance of the line. There are some countries, however, where it is more common for the line to have the main responsibility for Pay and Benefits [Slovakia (56%), Estonia (41%), Turkish Cypriot Community (78%), Bulgaria (48%), Turkey (42%), Nepal (55%)].
Figure 28: Primary responsibility for pay and benefits (EU countries)
0 10 20 30 40 50 60 UK Fran ce Ger man y Swed en Spa in Den mar k Net herla ndsItaly Finl and Gre ece Aus tria Belgi um Cyp rus Esto nia Slo veni a Slo vaki a Cze ch R epub lic Hun gary % o f o rg an isat io n s Line Mgt
Line Man with HR dept HR with line
Figure 29: Primary responsibility for pay and benefits (Europe, non- EU countries) 0 10 20 30 40 50 60 70 80 90 Nor way Switz erla nd Turk ey Bul garia Icel and Turk ish Cyp riot C om mun ity % o f o rg an isat io n s Line Mgt
Line Man with HR dept HR with line
HR dept
Figure 30: Primary responsibility for pay and benefits (Rest of world)
0 10 20 30 40 50 60 70 USA Can ada Aust ralia New Zea land Israel Phi lippi nes Nep al Tuni sia Line Mgt
Line Man with HR dept HR with line
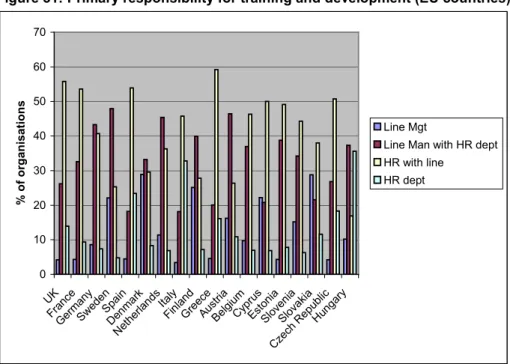
Primary Responsibility for Training and Development
In training and development, the responsibility is shared by the line and HR, but it is common for most EU countries for HR to be responsible with the assistance of the line (except Sweden, Finland, Austria and the Netherlands, where most commonly the line does the training and development with the assistance of HR). It can be said, therefore, that training and development is seen as a shared responsibility for managers.
Figure 31: Primary responsibility for training and development (EU countries)
0 10 20 30 40 50 60 70 UK Fran ce Ger man y Swed en Spa in Den mar k Net herla ndsItaly Finl and Gre ece Aus tria Belgi um Cyp rus Esto nia Slo veni a Slova kia Cze ch R epub lic Hun gary % o f o rg an isat io n s Line Mgt
Line Man with HR dept HR with line
HR dept
Figure 32: Primary responsibility for training and development (Europe, non- EU countries)
0 10 20 30 40 50 60 70 Nor way Switz erla nd Turk ey Bul garia Icel and Turk ish Cyp riot C omm unity % o f o rg a n is a ti o n s Line Mgt
Line Man with HR dept HR with line
Figure 33: Primary responsibility for training and development (Rest of world) 0 10 20 30 40 50 60 USA Can ada Aus tralia New Zea land Israel Philip pine s Nep al Tuni sia % o f o rg an isat io n s Line Mgt
Line Man with HR dept HR with line
HR dept
Primary Responsibility for Industrial Relations
Industrial Relations, in contrast with all the other HR functions examined, is often seen as the primary responsibility of HR alone. Though in many countries (UK, Sweden, Greece, Belgium, Hungary, Norway, USA, Canada, Philippines), industrial relations are considered most commonly as a shared responsibility under the guidance of HR, in all other countries Industrial Relations are most commonly seen as the job of HR. Sole exceptions were Slovakia, Bulgaria, Nepal, Tunisia and the Turkish Cypriot community, where it is most common for the line to assume responsibility for industrial relations, without the support of the HR.
Figure 34: Primary responsibility for Industrial Relations (EU countries)
0 10 20 30 40 50 60 70 80 UK Fran ce Ger man y Swed en Spa in Den mar k Net herla ndsItaly Finl and Gre ece Aus tria Bel gium Cyp rus Esto nia Slove nia Slo vaki a Cze ch R epub lic Hun gary % of or gani s at ions Line Mgt
Line Man with HR dept HR with line
Figure 35: Primary responsibility for Industrial Relations (Europe, non-EU countries) 0 10 20 30 40 50 60 70 Nor way Switz erla nd Turk ey Bul garia Icel and Turk ish Cyp riot C om mun ity % o f o rg an isat io n s Line Mgt
Line Man with HR dept HR with line
HR dept
Figure 36: Primary responsibility for Industrial Relations (Rest of world)
0 10 20 30 40 50 60 70 USA Can ada Aus tralia New Zea land Israel Phi lippi nes Nep al Tuni sia % o f o rg an isat io n s Line Mgt
Line Man with HR dept HR with line
Primary Responsibility for Workforce expansion reduction
The primary responsibility for workforce expansion/reduction in most countries resides with the line, with the assistance from the HR department. In some countries, though, it is the HR department, with the assistance of the line that has the primary responsibility (Germany, Italy, Greece, Cyprus, Australia, and Israel). Finally, in some countries it is more common for the line alone to have the responsibility for workforce expansion/reduction [Slovakia (40%), Turkey (44%), Turkish Cypriot community (71%) and Nepal 43%)].
Figure 37: Primary responsibility for workforce expansion/reduction (EU countries)
0 10 20 30 40 50 60 70 UK Fran ce Ger man y Swed en Spa in Den mar k Net herla ndsItaly Finl and Gre ece Aus tria Belgi um Cyp rus Esto nia Slo veni a Slova kia Cze ch R epub lic Hun gary % o f o rg an isat io n s Line Mgt
Line Man with HR dept HR with line
HR dept
Figure 38: Primary responsibility for workforce expansion/reduction (Europe, non-EU countries) 0 10 20 30 40 50 60 70 80 Nor way Switz erla nd Turk ey Bulga ria Icel and Turk ish Cyp riot C omm unity % o f o rg an isat io n s Line Mgt
Line Man with HR dept HR with line
Figure 39: Primary responsibility for workforce expansion/reduction (Rest of world) 0 10 20 30 40 50 60 USA Can ada Aus tralia New Zea land Israel Philip pine s Nep al Tuni sia % o f o rg an isat io n s Line Mgt
Line Man with HR dept HR with line
HR dept
Change in use of external providers for HR Information Systems (HRIS)
External providers for HRIS are used extensively in most countries. Generally, over 65% of companies in most countries appear to use such services. Exceptions are met in Germany where 41% do not use external providers for HRIS, Slovakia (48%), Turkish Cypriot community (57%), Nepal (64%) and Tunisia (48%).
In most countries the use of external providers of HR Information Systems has either increased or stayed the same. Only in France (36%), Spain (39%), Finland (35%) and Israel (46%) more than 10% of the companies reported a decrease in the use of external providers of HRIS.
Figure 40: Change in use of external providers for HR information systems (EU countries)
0 10 20 30 40 50 60 UK Fran ce Ger man y Swed en Spa in Den mar k Italy Finl and Gre ece Aus tria Bel gium Cyp rus Esto nia Slove nia Slo vaki a ch R epub lic Hun gary % o f o rg an isat io n s Increased Decreased Same Not used
Figure 41: Change in use of external providers for HR information systems (Europe, non-EU countries) 0 10 20 30 40 50 60 Nor way Switz erla nd Turk ey Bul garia Icel and Turk ish Cyp riot C omm unity % o f o rg a n is a ti o n s Increased Decreased Same Not used
Figure 42: Change in use of external providers for HR information systems (Rest of world)
0 10 20 30 40 50 60 70 USA Can ada Aus tralia New Zea land Israel Phi lippi nes Nep al Tuni sia % o f o rg an isat io n s Increased Decreased Same Not used
Type of HR Information System
In most of the countries examined the most common practice is for companies to use a primarily independent HR system. In Slovenia (55%), USA (52%), Denmark (47%) and Philippines (42%), it is most common, though, to have a HRIS which is integrated into the wider management information system.
Surprisingly, there are many countries where there was a relatively high report of no use of any computerized HRIS, such as the Turkish Cypriot community (79%), Nepal (65%), Hungary (39%), New Zealand (37%), Australia (35%) and Cyprus (31%).
Figure 43: Type of HR information system (EU countries)
0 10 20 30 40 50 60 70 80 UK Fran ce Ger man y Sw edenSpai n Den mar k Net herla ndsItaly Finl and Gre ece Aus tria Belg ium Cyp rus Esto nia Slo veni a Slova kia Cze ch R epub lic Hun gary % o f o rg a n is a ti o n s Do not have computerised HR IS Primarily independent HR system Primarily integrated into wider management IS
Figure 44: Type of HR information system (Europe, non- EU countries)
0 10 20 30 40 50 60 70 80 90 Nor way Switz erla nd Turk ey Bul garia Icel and ish Cyp riot C omm unity % o f o rg a n is a ti o n s
Do not have computerised HR IS
Primarily independent HR system
Primarily integrated into wider management IS
Figure 45: Type of HR information system (Rest of world) 0 10 20 30 40 50 60 70 USA Can ada Aust ralia New Zea land Israel Philip pine s Nep al Tuni sia % o f o rg a n is a ti o n s Do not have computerised HR IS Primarily independent HR system
Primarily integrated into wider management IS
Stage of EHRM web deployment
In most countries examined, e-HR allows for mostly one-way communication (mostly publishing of information and in some cases with some access from the user). As a matter of fact, in some countries, the use of one-way communication with some access is almost as common or more than the publishing of information (Hungary, France, Austria, Nepal).
Face to face communication may well be a preferred option in a majority of countries. The use of e-HRM for two-way communication is much more restrained and as a rule fewer than 20% of the respondents use such systems. The use of such two-way communication systems is more common in the USA, Australia, New Zealand, probably because advanced information systems and email are well established and there may be longer distances to communicate, where the benefits from using such systems are more evident. The use of two-way communication in Europe is also very common in Italy and Belgium.
Figure 46: Stage of EHRM web deployment (EU countries) 0 10 20 30 40 50 60 70 80 90 UK Fran ce Ger man y Swed en Spa in Den mar k Net herla ndsItaly Finl and Gre ece Aus tria Bel gium Cyp rus Esto nia Slove nia Slov akia Cze ch R epub lic Hun gary % o f o rg a n is a ti o n s One-way communication (Info. Publishing) One-way communication (some access) Two-way communication (simple update) Two-way communcation (more complex transactions) Other (further advanced) Don't know
Figure 47: Stage of EHRM web deployment (Europe, non-EU countries)
0 10 20 30 40 50 60 70 Nor way Switz erla nd Turk ey Bul garia Icel and Turk ish Cyp riot C omm unity % o f o rg a n is a ti o n s One-way communication (Info. Publishing) One-way communication (some access) Two-way communication (simple update) Two-way communcation (more complex transactions) Other (further advanced) Don't know
Figure 48: Stage of EHRM web deployment (Rest of world) 0 10 20 30 40 50 60 70 80 USA Can ada Aus tralia New Zea land Israel Philip pine s Nep al Tuni sia % o f o rg a n is a ti o n s
One-way communication (Info. Publishing)
One-way communication (some access)
Two-way communication (simple update)
Two-way communcation (more complex transactions) Other (further advanced)
Don't know
Table 2: Does the Head of HR have a place on the Board?
1995 (%) 1999 (%) 2003-5 (%)
EU countries 57.9 54.4 56.9 Europe (Non EU) 60.6 50.7 47.1
Table 2 shows the proportion of organisations in which the Head of HR is on the Board of Directors or equivalent. This proportion has remained relatively constant within EU organisations, with just over half of organisations stating that their Head of HR is on the Board. In non-EU European countries however, we can see a steady drop in the proportion of organisation with the Head of HR on the Board over the time period between 1995 and 2005.
Conclusions
The wide variation in the roles of HR Directors and HR functions described here no doubt reveals both a diversity of cultures and national economic systems, different stages in the development of HR roles, and a variety of models of HR management.
We can see, however, that whether or not HR is represented on the main Board of a business, HRM continues to have an influence on the creation of strategy and its implementation. We can also see a trend towards the formalisation of strategy, with more written business strategies and written HR strategies being frequently in place. Similarly written mission statements imply that most businesses not only have strategic objectives, but also have provided a vision of the future for employees. HR’s role in helping the organisations reported here to achieve that mission is found in HRM’s primary role for industrial relations policy, and in its significant responsibility in conjunction with line management for recruitment, selection, training, development and rewards.
There are also signs from these results of the growing significance of HR information systems, many of which are integrated with the wider business systems such as SAP. The influence of information technology on HR may well be an area that future surveys should explore more fully, given the potential implications for the structures of the function especially in the transactional areas of its work.
2.
Flexible Working Arrangements: Divergence and Convergence across
Countries
The rise in flexible working arrangements
Flexible working arrangements (FWAs) have been a major research focus since Atkinson’s (1984) ‘flexible firm’ model1. Atkinson’s model was followed by a wave of flexibility typologies which attempted to analyse flexible working arrangements across firms, sectors or countries.
This analysis is based on Cranet data regarding the use of FWAs in 30 countries: 18 European Union members, 6 non-members of the European Union and a further 8 countries outside Europe. The Cranet surveys have always provided a wealth of information about flexible working arrangements and this information has influenced both research and public policy agendas. Cranet data has shown changes in flexible working arrangements over the last 15 years (see below).
Flexible working arrangements – what are we focussing on?
The information is based on answers to the following question:
“Please indicate the approximate proportion of those employed by your organisation who are on the following working arrangement.”
Table 3 below indicates the flexible working arrangements which were covered by this question. After providing a general overview of key findings, we will explore one of the more recent flexibility typologies which focuses on four bundles of FWAs, namely non-standard work patterns, non-standard work hours, work outsourced and work away from the office.
Table 3: Types of flexible working arrangements
Working time Contractual Externalised
Part-time work Weekend work Overtime Shift work
Compressed working week Annualised hours Flexi-time Job sharing Temporary/casual work Fixed-term employment Home-based work Tele-working
Table 4: Proportion of companies using FWAs in different regions of the world Proportions of Companies by Regions of the World (%)
FWAs by Proportions Used English Speaking Northern European Central European Mediter-ranean Former Eastern Block Asian Shift Work Not Used 0 - 5% 6-10% 11-20% 21-50% >50% 30 18 10 09 14 19 37 14 09 09 16 15 32 15 10 08 15 20 24 14 10 09 13 30 25 13 09 09 20 24 47 08 06 08 10 21 Annual Hours Contract Not Used 0 - 5% 6-10% 11-20% 21-50% >50% 72 12 03 03 03 07 63 12 04 03 03 15 66 08 03 02 05 16 77 06 03 01 03 10 60 24 06 04 02 04 92 04 02 0 02 0 Flextime Not Used 0 - 5% 6-10% 11-20% 21-50% >50 46 21 9 06 07 11 22 16 11 11 12 28 27 09 07 08 12 37 67 13 04 04 04 08 45 23 11 08 07 06 82 10 02 02 01 03 Teleworking Not Used 0 - 5% 6-10% 11-20% 21-50% >50 73 20 04 02 01 0 58 32 05 02 02 01 69 24 03 02 01 01 90 07 01 01 0 01 76 18 03 01 01 01 92 05 01 0 01 01
National differences often cut across popular understanding of flexible labour
markets
In the debate over labour market flexibility, there has often been a notion that where state regulation is limited, countries – for example, the USA or the United Kingdom – should score high across most flexibility measures. However, this is not the case since the prevalence of certain types of flexible working arrangements varies across countries. As Robinson (1999: 96) has pointed out regarding temporary work: countries with high levels of regulation of standard employment contracts often have high levels of flexible working arrangements.2 If firms find that certain types of flexible working arrangements are constrained by regulations then they will pursue other, more easily obtained forms of flexibility. Thus, France scores high in terms of annual hours contracts, the Netherlands scores high in terms of part-time work and fixed-term contracts and Spain and Turkey are leaders in shift work.
2
“So the relationship between regulation and the incidence of temporary employment is exactly the opposite way round from what might be expected. Indeed, a high and rising incidence of temporary employment could be taken as a worrying sign that regulation of standard employment contracts is seen as burdensome and may be distorting the labour market.” (Robinson 1999: 96).
Traditional patterns of flexible working arrangements are still dominant over
‘new’ forms of flexibility
In light of the futuristic discussion of the ‘end of the job’, it has often been expected that annualised hours, job sharing, home-based working and tele-working would become major features of working life. However, this has yet to happen. For example, extensive use of tele-working (that is, more than 10% of a organisation’s workforce) covers less than 10% of the responding organisations. Even in countries that are the leaders in this area there is a long way to go before tele-working becomes part of mainstream flexible working arrangements (see Table 5).
Table 5: Proportion of workforce involved in tele-working (% of organsations) Countries Not used 0-5% 6-10% 11-20% 21-50% >50%
UK 80 16 3 1 0 0 Germany 56 38 2 1 2 1 Sweden 55 35 5 2 1 2 Denmark 61 31 4 1 2 1 Netherlands 59 29 7 2 2 1 Slovakia 55 30 9 2 2 2 Norway 40 48 5 4 3 0 Iceland 52 31 13 2 1 1 USA 45 37 10 3 2 3
Bundles of flexible working arrangements
In addition to viewing FWAs as individual arrangements, we may also see them as groups or bundles of arrangements. Research has shown that when combined, these arrangements have better results on organizational effectiveness and performance. Table 6 below indicates how the FWAs covered by the Cranet surveys can be categorised into four different ‘bundles’3.
Table 6: Bundles of flexible working arrangements Non-Standard Work
Patterns
Non-Standard Work Hours
Work Outsourced Work Away from the Office Annual Contracts Part-time Work Job Sharing Flextime Fixed-term Contracts Compressed Work-week Weekend Work Shift Work Overtime Temporary Employment Subcontracting Home-based Work Tele-working
The FWA ‘bundles’ can be used as a starting point for analysing how FWAs vary across the groups of countries. This is done in Table 7. Looking at the four bundles of FWAs, we can see that: (a) non-standard work patterns have become embedded in most regions, though less so amongst Asian countries; (b) the two bundles of non-standard work hours and work away from the office are more common amongst countries in the English speaking, Northern and Central European regions; (c) work outsourced is most common amongst Mediterranean and Asian countries; and (d) working away from the office has yet to take hold in Mediterranean and Asian countries.
Table 7: Proportion of companies using FWA categories/bundles in different regions of the world
Proportion of Companies by Country Regions (%) Flexible Work Arrangements By Category /Bundle English Speaking Northern European Central European Mediter-ranean Former Eastern Block Asian Non-Standard Work Patterns No FWAs 1 FWA 2 FWAs 3 FWAs 4 FWAs 5 FWAs 6 FWAs 02 09 20 26 22 15 06 0 05 14 32 28 16 05 01 04 18 32 25 15 05 11 28 29 19 09 03 01 05 18 30 28 13 04 02 17 39 25 11 05 02 01 Non-Standard Work Hours No FWAs 1 FWA 2 FWAs 3 FWAs 05 14 27 54 06 21 28 45 08 19 31 42 06 14 32 48 07 16 29 48 20 35 27 18 Work Outsourced No FWAs 1 FWA 2 FWAs 08 55 37 07 56 37 31 39 30 24 35 41 17 51 32 25 31 44 Work Away From
the Office No FWAs 1 FWA 2 FWAs 60 28 12 51 32 17 64 28 08 88 09 03 71 23 06 92 07 01
Table 8: Proportion of organisations using annual hours contracts (all countries)
1995 (%) 1999 (%) 2003-5 (%) Not used 71.2 72.8 68.9 0-5% 19.7 7.5 11.5 6-10% 2.1 5.5 3.5 11-20% 1.2 2.1 2.7 >20% 5.8 12.1 13.4
A slightly higher proportion of employees in 2003-5 than in 1995 were on annual hours contracts with 13.4 per cent of organisations stating that more than 20 per cent of their workers are on annual hours contracts, compared to only 5.8 per cent in 1995. Annual hours contracts were also used by a slightly higher proportion of organisations in 2003-5 (31.1%) compared to 1995 (28.8%).
Table 9: Proportion of organisations using temporary/casual work (all countries)
1995 (%) 1999 (%) 2003-5 (%) Not used 16.9 24.5 26.7 0-5% 60.2 23.8 43.7 6-10% 13.3 29.6 16.8 11-20% 6.3 11.6 8 >20% 3.2 10.6 4.8
The use of temporary/casual work has dropped over the ten-year period. This may be due in part to legislation in some countries that has given temporary workers more rights as employees. Temporary or casual work is generally used by a relatively low proportion of employees.
Table 10: Proportion of organisations using fixed-term contracts (all countries) 1995 (%) 1999 (%) 2003-5 (%) Not used 19.4 20.6 26.3 0-5% 57.6 23.5 46.1 6-10% 11.9 29.1 13.1 11-20% 4.6 11.7 6.1 >20% 6.4 15.1 8.4
The use of fixed-term contracts has also dropped marginally overall over the ten-year period. Fixed-term contracts are also typically found in a low proportion of the workforce. This may be due to legal changes which have made the renewal of short term contracts beyond two years less attractive in some EU countries.
Conclusions
Despite the general rise in FWA’s over the last 10 years, there has not been the expected rise in some well established forms of FWA’s. Shift work and part time work have been relatively constant, whilst annual hours arrangements have become important for a minority of organisations. However, there are still major variations when it comes to the actual implementation of flexible working arrangements. This may blur some of the averages reported here. There are significant regional and country variations and some countries have experienced stagnation or even reversal in some types of flexible working arrangements. It is also puzzling – in light of the growth in service sector and professional jobs – that the growth in new forms of flexible working arrangements (e.g. teleworking, annual hours contracts) has been less than expected. There are several key findings which have been discussed.
• Growth and stability in some flexible working arrangements, whilst others have diminished • National and regional differences in flexibility are still pronounced
• National differences often cut across popular understanding of flexible labour markets
• Traditional patterns of flexible working arrangements are still dominant over ‘new’ forms of
flexibility
Continuous growth in flexible working arrangements?
Part-time work, flexi-time, annual hours contracts and weekend work have now become standard across organisations in many of the participating countries. This is hardly surprising where more women join a labour market dominated by service sector organisations and white-collar, technical or managerial jobs.
While the dominating trend is towards more flexible working arrangements several cautionary remarks are required. First, there is ample room for an increase in flexible working arrangements. Despite the rise in service sector jobs the majority of countries are reporting that more than 60% of responding organisations have under 5% of their workforce employed on weekend work. Second, the growth in new forms of FWAs has been less than expected (see above). Third, there has been stagnation or reversal in the rise of some types of FWAs. For example, there has been a surprising drop in part-time work amongst Danish women over the last two decades (Rasmussen et al., 2004)4.
4
National and regional differences in flexibility are still pronounced
While debates of convergence versus divergence and the impacts of market forces versus institutional forces rage on, the country surveys show considerable diversity across the individual measures of flexible working arrangements, and well as certain regional practices.
Clearly there are interesting research areas to explore by looking at the reasons for regional and national differences, which are located in labour market pressures, the laws and the practices in many countries reported here, as well as in the expansion and contraction of particular industry sectors and the impact of new technology.
3.
Employee Relations and Communication
In this first section on employee relations, we chart the rise of the internet and intranet in employee communications. Whilst the use of emails continues to grow around the world, we can see that the patterns of the use of electronic communications with employees are not all the same. We should note that the figures shown do not reveal the current level of this kind of communication, but instead show the rise or fall in its use.
In general the use of electronic methods to communicate major issues to employees has increased significantly during the last three years across nearly all of the countries surveyed. In regard to EU countries we can observe particularly marked increases in the electronic communication of these issues for the Czech Republic, Estonia, Austria, Finland, Italy, the Netherlands, Denmark and Sweden (see Figure 49). The most obvious exception to this trend is Slovakia where some 40 percent of organizations make no use whatsoever of electronic communication and where under 20 percent report any increase in its use. This represents a very different pace of development in comparison with its neighbour, the Czech Republic, where all organizations use electronic communication. Cyprus is also somewhat different from the general trend in that while most of its organizations are increasing their use of electronic communications it also contains a substantial proportion of organizations that make no use of electronic communication.
Figure 49: Change in the use of electronic methods to communicate major issues to employees during the last 3 years (EU countries)
0 10 20 30 40 50 60 70 80 90 100 UK Fran ce Ger man y Swed en Spa in Den mar k Net herla nds Italy Finl and Gre ece Aus tria Belgi um Cyp rus Esto nia Slo veni a Slova kia Cze ch R epub lic Hun gary % o f o rg a n is a ti o n s
The average number of organisations in EU member countries which were increasing their use of electronic communications was 72%, whilst 16% of organisations remained the same and 8% did not use electronic communications to communicate with their employees, and 1% of organisations on average decreased their use of this method.
As Figure 50 indicates the non-EU European countries present a somewhat more mixed picture. In particular The Turkish Cypriot Community has a substantial majority of organizations that make no use of electronic communication. In this respect The Turkish Cypriot Community is atypical of Europe. Norway is also somewhat different from the general European trend in that only about 10 percent of its organizations increased their use of electronic communication. However, it should be noted that all Norwegian organizations make some use of electronic communication.
Figure 50: Change in the use of electronic methods to communicate major issues to employees during the last 3 years (Europe – non EU countries)
0 10 20 30 40 50 60 70 80 90
Norway Switzerland Turkey Bulgaria Iceland Turkish Cypriot Community % o f o rg a n is a ti o n s
Increased Same Decreased Not used
In regard to the non-European countries, Tunisia has a profile that is very similar to The Turkish Cypriot Community in that the vast majority of its organizations make no use of electronic communication (see Figure 51). With the exception of Nepal, all of the other non-European countries show pronounced increases in the use of electronic communication.
Figure 51: Change in the use of electronic methods to communicate major issues to employees during the last 3 years (Rest of world)
0 10 20 30 40 50 60 70 80 90 USA Can ada Aus tralia New Zea land Israel Philip pine s Nep al Tuni sia % o f o rg a n is a ti o n s
Increased Same Decreased Not used
Trade Union Membership
Trade unions have traditionally constituted one significant channel for employer communication with employees. In general in cases of organizations where there is no trade union presence at all it is reasonable to assume that trade unions are not acting as a communication channel. In this regard Figure 52 indicates that EU-countries are to a significant extent bifurcated on the basis of whether they have a communist history or not. That is to say that all of the former communist countries excepting Slovenia have above average proportions of organization with no trade union membership whatsoever. In the case of Estonia this is approaching 70 percent of organizations. In the rest of the EU, i.e. the majority of EU countries, with the exception of Greece and the UK, organizations with no union membership are much less common. The Scandinavian countries of Sweden, Denmark and Finland (and Iceland in the non-EU European countries) showed particularly high unionisation. Cyprus also showed high unionisation, demonstrating the fact that Cyprus uses the same tri-partite model as Scandinavia whereby most decisions are reached between employer associations, unions and the Government.
Figure 52: Proportion of total number of employees who are members of a trade union (EU countries) 0 10 20 30 40 50 60 70 80 UK Fran ce Ger man y Swed en Spai n Den mar k Net herla nds Italy Finl and Gre ece Aus tria Belg ium Cyp rus Est onia Slo veni a Slo vaki a Cze ch R epub lic Hun gary % o f o rg a n is a ti o n s 0% 1-10% 11-25% 26-50% 51-75% 76-100% Don't know
European non-EU countries may also be divided into two. While both Norway and Iceland are very similar to the majority of EU countries, the other non-EU European countries all have substantial proportions of organizations with no union membership (see Figure 53).
Figure 53: Proportion of total number of employees who are members of a trade union (Europe – non EU countries) 0 10 20 30 40 50 60 70 80 90 100
Norway Switzerland Turkey Bulgaria Iceland Turkish Cypriot Community % o f o rg a n is a ti o n s 0% 1-10% 11-25% 26-50% 51-75% 76-100% Don't know
As Figure 54 indicates, the non-European countries we have surveyed are clearly different to the majority of EU countries in that they all contain large proportions of organizations with no union membership. This is particularly the case for the Philippines and the USA. Further analysis of the data showed that, across countries, the proportion of employees that are members of a trade union is higher in the public sector than in the private sector, with about a quarter of private sector organisations (26%) showing no unionisation compared to only seven per cent of public sector organisations.
Figure 54: Proportion of total number of employees who are members of a trade union (Rest of world) 0 10 20 30 40 50 60 70 80 USA Can ada Aus tralia New Zea land Israel Philip pine s Nep al Tuni sia % o f o rg an isat io n s 0% 1-10% 11-25% 26-50% 51-75% 76-100% Don't know
Employers’ associations. A new question was asked in this survey with regard to whether organizations were members of employers’ association. No distinction was made here between employers’ associations and trade associations. In regard to the EU in the case of 12 out of the 17 countries for which we have data 60 percent or more organizations were members of employers associations (see Figure 55). Of the five countries which had membership frequencies below 60 percent, four were ex-communist countries, with the fifth being the UK. That is to say we find a pattern that is broadly similar to the pattern we observed in regard to union density.
Figure 55: Organisations reporting to be members of an employers’ association (EU countries) 0 20 40 60 80 100 120 UK Fran ce Ger man y Swed en Spa in Den mar k Net herla nds Italy Finl and Gre ece Aus tria Belgi um Cyp rus Esto nia Slo veni a Slo vaki a Cze ch R epub lic Hun gary % o f o rg an isat io n s
In regard to the non-EU European countries we can observe a pattern for membership of employers’ associations that is similar to that of union density in that it is only Norwegian and Icelandic organizations that have membership frequencies above 60 percent and which are therefore similar to the majority of EU countries (see Figure 56)
The average number of organisations in the EU which were members of an employers association was 67%, and of those who were members, around 58% were satisfied entirely or to a large extent with the services they received. This leaves a substantial number who were not entirely satisfied:- 3% were not satisfied at all, and 39% were only satisfied to a small extent. This may reflect the changing nature of employers associations which, according to the ILO are having to change their role from a focus on employee relations to a greater emphasis on human resource advisory services in order to meet the needs of their members (ILO 2003)5.
Membership of employers associations across the EU is related to size, the larger the organisation the more likely they are to be members, and membership is common in chemical products, extraction and processing industries, in manufacturing, building and civil engineering. The overall extent of membership has remained similar, between 1999 at around 70% of organisations, as it is in the 2003/5 surveys.
Figure 56: Organisations reporting to be members of an employers’ association (Europe – non EU countries) 0 10 20 30 40 50 60 70 80 90
Norway Switzerland Turkey Bulgaria Iceland Turkish Cypriot Community % o f o rg an isat io n s
For the remaining countries in our survey, membership of employers’ associations is generally high with USA, Canada, Israel and Nepal falling below the 60 percent mark (see Figure 57).
Figure 57: Organisations reporting to be members of an employers’ association (Rest of world)
0 10 20 30 40 50 60 70 80 90 USA Can ada Aus tralia New Zea land Israel Philip pine s Nep al Tuni sia % o f o rg an isat io n s
We also asked how satisfied respondents were with the services provided by associations. Looking at both Figures 58 and 59 we can observe a pronounced Nordic cluster, Sweden, Denmark, Finland, Norway and Iceland, where satisfaction levels are overwhelmingly large. The same is also the case, albeit to a much lesser extent, for the Netherlands, Belgium, Cyprus, Estonia and France. In the other countries, including the non-European countries with the exception of Australia (see Figure 60), the largest group of respondents reported that membership met their needs only to a small extent.
Figure 58: Extent to which services provided by the employers’ association meet organisation’s needs 0 10 20 30 40 50 60 70 80 90 UK Fran ce Ger man y Swed en Spa in Den mar k Net herla nds Italy Finl and Gre ece Aus tria Bel gium Cyp rus Esto nia Slove nia Slo vaki a Cze ch R epub lic Hun gary % o f o rg a n is a ti o n s
Not at all To a small extent To a large extent Entirely
Figure 59: Extent to which services provided by the employers’ association meet organisation’s needs (Europe – non EU countries)
0 10 20 30 40 50 60 70 80 90
Norway Switzerland Turkey Bulgaria Iceland Turkish Cypriot Community % o f o rg a n is a ti o n s
Figure 60: Extent to which services provided by the employer’s association meet organistion’s needs (Rest of world)
0 10 20 30 40 50 60 70 80 USA Can ada Aus tralia New Zea land Israel Phili ppin es Nep al Tuni sia % o f o rg a n is a ti o n s
Not at all To a small extent To a large extent Entirely
Table 11: Briefing of employees on business strategy
1995 (%) 1999 (%) 2003-5 (%) Management 94.2 92.4 98.9 Professional/technical 64 55.2 95.5 Clerical 44.1 37.9 91 Manual 35 27.6 86.5
The 2003-5 results show a sharp upward rise in the proportion of organisations that brief levels besides management regarding business strategy.
Conclusions
Whereas it is commonplace for organizations to make use of verbal and written communication direct to employees this current survey reveals a significant new development in employee communications, i.e. the increasing use of electronic methods of communication. Moreover, organizations are confirming that they are using electronic methods to communicate major issues. There is also evidence of an overall increase in the briefing of employees about business strategy.
However, this development does not necessarily mean that unions have lost their role as actual or potential channels of communication between employer and employee. Although non-unionization is widespread in the USA, in Europe in general most unions continue to have a membership presence in most organizations. However, there are exceptions to this “European” model including a number of former communist countries and the UK.
For the first time in the history of this survey organizations were asked whether they were members of employers’ association and whether or not they were satisfied by the services provided. Organizations in Nordic countries generally belong to such organizations and they are generally satisfied with them. For the other countries surveyed, while membership levels are also generally high, fairly low levels of satisfaction are commonplace.
4.
Pay
Under the heading of pay in the survey three topics are covered. The first topic concerned the importance of performance related pay. The increasing use of variable pay related to the performance of the individual, the team or the organisation as a whole is a major trend in HRM today. The second topic which is related to performance oriented HRM is for some countries and companies the new phenomenon of financial participation, employee share ownership, stock options and profit sharing. The third topic is the level of bargaining where decentralisation to lower levels, from nation/industry wide to company and individual level, is seen as a major trend.
Table 12 presents an overview of the use of performance related pay by organisations by country. In general, variable pay based on the performance of the group or team is less common than individual performance rating and pay based on collective organizational level performance. It is clear that there is large diversity between countries. This diversity is based on cultural differences in the acceptance of this type of variable pay as well as differences in business regimes. We may expect these forms of pay to appear in more voluntary regimes where the discretion of management to model the employment relationship is the largest. In this case it is interesting to note that countries like Hungary, Slovenia and Slovakia have higher scores than the USA. Apparently these post-communist States offer ample opportunity to model the employment relationship to performance oriented arrangements. An outlier is Spain, which also frequently uses performance related pay on all levels.
Table 12 presents also an overview of the use of forms of financial participation. In general the use of schemes is higher for management and professional staff and lower for clerical staff and manual work. In the case of profit sharing, there is even more distribution among categories of personnel. In general there are lower levels of use in case of stock options. This may also be the result of the new international bookkeeping standards that require the expensing of stock options in the profit and loss account.
There is considerable diversity in the use of these schemes between countries. Higher levels of use of share plans are found in the UK and France (supported by promotion policies and tax concessions), Norway and the USA. Here again the former post-communist regimes of Hungary and Slovakia have relatively high levels of use. These countries frequently show the other forms of financial participation. Profit sharing is very common in France and Finland due to specific provisions and tax concessions in those countries. High levels are also found in the USA, the Netherlands, Spain and Norway. As expected a high level of use of stock options is found in the USA. Outliers are Spain and Iceland.
Table 12: Proportion of companies with types of financial participation and performance related pay per country
Financial Participation (only private sector)
Performance Related Pay Shareplan Profit
sharing Options Team Individual
Collective organization United Kingdom 18 12 2 4 9 13 France 19 73 3 11 18 16 Germany 8 24 1 4 16 15 Sweden 7 16 3 5 3 11 Spain 12 35 19 61 72 79 Denmark 7 4 2 4 15 5 The Netherlands 12 36 4 6 20 15 Italy 5 2 1 10 21 33 Norway 50 30 11 21 34 18 Switzerland 5 23 3 8 29 20 Turkey 2 7 1 2 5 6 Finland 4 48 5 6 11 15 Greece 8 5 11 8 16 15 Czech Republic 7 14 3 15 28 38 Austria 5 18 2 3 15 14 Belgium 11 8 2 3 13 7 Bulgaria 9 14 14 10 28 20 Hungary 20 22 27 41 59 56 Australia 12 7 1 5 8 10 New Zealand 7 12 1 4 10 12 Cyprus 4 4 4 11 5 Israel 3 18 4 3 5 6 USA 16 37 30 26 43 40 Canada 11 13 3 4 7 9 Tunisia 4 3 1 9 39 21 Iceland 1 9 18 3 5 5 Turkish Cypriot Community 3 12 1 2 8 6 Estonia 2 3 2 8 11 10 Slovenia 11 18 4 23 52 42 Philippines 8 6 2 11 18 25 Slovakia 19 49 10 58 72 69 Nepal 1 26 0 5 10 3
Table 13 presents the findings of pay determinacy levels for manual personnel. Note that respondents indicated a number of different levels of bargaining. That is, in some cases organizations have company level bargaining as well as national, industry wide or regional bargaining. It appears that, in general, nation/industry wide bargaining for manual personnel is still more common in most of the countries than the other levels. Not presented here, to a great extent the distribution of the level of pay settlement for clerical staff follows the same patterns as for manual personnel. A higher proportion of organizations indicate that they settle pay for professionals on company and individual level. Pay settlement for management is done largely on individual and company level; in most countries more than 70% of organizations.