DOCUMENT DE TREBALL
XREAP2012-08
What underlies localization and urbanization
economies? Evidence from the location of new firms
Jordi Jofre-Monseny (IEB, XREAP)
Raquel Marín-López (IEB, XREAP)
Elisabet Viladecans-Marsal (IEB, XREAP)
What underlies localization and urbanization economies?
Evidence from the location of new firms
∗Jordi Jofre-Monseny Raquel Marín-López Elisabet Viladecans-Marsal Universitat de Barcelona & Institut d’Economia de Barcelona (IEB)
ABSTRACT: The objective of this paper is to analyze why firms in some industries locate in specialized economic environments (localization economies) while those in other industries prefer large city locations (urbanization economies). To this end, we examine the location decisions of new manufacturing firms in Spain at the city level and for narrowly defined industries (three-digit level). First, we estimate firm location models to obtain estimates that reflect the importance of localization and urbanization economies in each industry. In a second step, we regress these estimates on industry characteristics that are related to the potential importance of three agglomeration theories,
namely, labor market pooling, input sharing and knowledge spillovers.
Localization effects are low and urbanization effects are high in knowledge-intensive industries, suggesting that firms (partly) locate in large cities to reap the benefits of inter-industry knowledge spillovers. We also find that localization effects are high in industries that employ workers whose skills are more industry-specific, suggesting that industries (partly) locate in specialized economic environments to share a common pool of specialized workers.
Keywords:Agglomeration economies, manufacturing industries, localization economies, urbanization economies, specialization. JEL codes:L25, L60, R12, R30
Contact Address:
Facultat d’Economia i Empresa Avda. Diagonal 690, 08034 Barcelona
e-mail: jordi.jofre@ub.edu; rql.marin@ub.edu; eviladecans@ub.edu
∗ We thank Albert Solé-Ollé, Josep-Maria Arauzo-Carod and Ángel Alañón-Pardo for helpful
comments and suggestions. Financial support from projects ECO 2010-16934 (Ministerio de Educación y Ciencia) and 2009SGR102 (Generalitat de Catalunya) is gratefully acknowledged.
1. Introduction
The empirical literature on agglomeration economies has shown that firms enjoy positive externalities from the geographical concentration of economic activity. In empirical work and in policy discussions, two types of agglomeration economies are often considered: localization economies, i.e., the benefits that firms derive from the presence of same industry firms in a geographical area, and urbanization economies, i.e., the benefits that firms obtain from large (and often economically diverse) cities.
There is a large body of literature analysing the effects of localization and
urbanization economies on various outcomes1,2. One group of studies examines (firm)
productivity. This approach was pioneered by Carlino (1979) and was later adopted by
Sveikauskas et al (1988) and Henderson (2003) among others3. A second approach,
pioneered by Glaeser et al (1992) and Henderson et al (1995), estimates the effects of baseline industry characteristics on subsequent employment growth, seeking to determine whether industry employment growth is best explained by a history of specialization in the industry (localization economies) or by a diversified industry mix (urbanization economies). More recent applications of this second approach include Combes (2000) and Viladecans-Marsal (2004). Finally, and more closely related to our study, a third group of papers examines firm location decisions4. Looking at the locations of new firms is helpful in terms
of identification since location attributes are fixed at the time of start-ups and this alleviates concerns about simultaneity (Rosenthal and Strange, 2003). Across countries, time periods and outcome definitions the results indicate that both localization and urbanization economies matter although the effects vary substantially across industries.
The debate about the relative importance of localization and urbanization effects is one concerned with the industrial scope of agglomeration economies (where industrial proximity is defined in a binary fashion). To a large extent, this debate has been silent on
1 For a review of this literature see Rosenthal and Strange (2004).
2 A related body of literature deals with the urban wage premium and estimates the effect of city density (urbanization economies) on wages. To the best of our knowledge, de Blasio and Di Addario (2005) and Combes et al (2008) are the only two studies that estimate localization and urbanization effects on wages.
3 The effect of localization and urbanization economies on productivity remains an active research area. Graham (2009), Broesma and Oosterhaven (2009), Graham et al (2010), Fu and Hong (2011) and Martin et al (2011) are recent examples.
4 Recent U.S. applications include Rosenthal and Strange (2003), Guimarães et al (2004) and Buenstorf and Klepper (2010) while van Soest et al (2006) and Arauzo-Carod (2005) and Jofre-Monseny (2009) are applications to the Dutch and Spanish cases respectively. Arauzo-Carod et al (2010) review the analytical framework, methods and results of this approach.
the reasons why firms in some industries prefer specialized economic environments while those in other industries prefer large (and diverse) cities. In relation to three agglomeration theories forwarded in the literature (namely, labor market pooling, input sharing and knowledge spillovers), we consider the potential explanations they provide5.
A densely populated local labor market (labor market pooling) facilitates flows of workers across firms in the presence of firm-specific shocks (Krugman, 1991) and enhances employer-employee matches (Hesley and Strange, 1990). The hypothesis that same industry firms co-locate in space to share a pool of specialized workers is consistent with the idea that localization effects are more important in industries employing workers with industry-specific skills. Conversely, urbanization effects are hypothesised as being more important in industries that employ workers whose skills are not so industry-specific. The concentration of firms in a geographical area enables firms to share input suppliers (input sharing). If same industry firms co-locate to share specialized input suppliers, we can expect localization effects to be greater in industries with higher input intensities. Conversely, in the case of firms locating in large urban areas to be close to a wide range of input providers, we would expect greater urbanization effects in these input dependent industries. The knowledge spillover theory holds that geographical proximity facilitates the transmission of knowledge between workers and firms. Thus, the hypothesis that same industry firms co-locate to reap the benefits of intra-industry knowledge spillovers is consistent with the idea that localization effects are more important in knowledge-intensive industries. Conversely, the notion that firms co-locate in large urban areas to reap the benefits of inter-industry knowledge spillovers is consistent with urbanization effects being more important in knowledge-intensive industries.
In order to examine the underlying causes of localization and urbanization economies we analyse the location decisions of new firms in Spain. Specifically, we look at the location of new firms created between 2002 and 2004 at the city level for all three-digit manufacturing industries. First, we estimate industry-specific localization and urbanization effects and then, we relate these estimates to the industry characteristics that can be
5Duranton and Puga (2004) provide an alternative, more theoretically driven, classification. They
propose classifying agglomeration mechanisms as sharing, matching or learning mechanisms. Agglomeration can be beneficial as a means of sharing facilities and infrastructure, input suppliers, the gains of individual specialization and a labor pool. Matching and learning can be enhanced in a more economically dense environment.
associated with the potential importance of the three agglomeration theories described above.
Our main findings can be summarized as follows. First, we find evidence of localization and urbanization effects in many, but not all, industries. The order of magnitude of these estimates is similar to that found in previous studies. Second, we document a negative correlation between localization and urbanization effects at the industry level, suggesting that urbanization effects tend to be unimportant in industries where localization effects do matter and vice versa. Third, we find that localization effects are low and urbanization effects are high in knowledge-intensive industries (proxied by the share of workers holding a university degree). This suggests that firms do not locate in specialized environments to reap the benefits of intra-industry knowledge spillovers. Instead, our results are consistent with the notion that firms locate in large cities to reap the benefits of inter-industry knowledge spillovers. Fourth, we find that localization effects are high in industries that employ workers whose skills are more industry-specific (proxied by the dissimilarity between the worker occupations in the industry with respect to the whole economy).
To our knowledge this is the first paper that systematically examines the sources of localization and urbanization economies. A further contribution of this paper is that we estimate industry-specific localization and urbanization effects for all industries whereas most studies deal with selected industries only. Thus, we are able to estimate the full distribution of localization and urbanization effects. Finally, our econometric approach, which amounts to estimating the impact of pre-existing economic conditions on subsequent firm entry, alleviates concerns about simultaneity.
This paper is also closely related to the empirical literature that seeks to determine the relative importance of agglomeration theories. Rosenthal and Strange (2001) aim to identify the characteristics of an industry that determine its degree of geographical concentration, using proxies of the three agglomeration mechanisms considered here. They conclude that labor market pooling is the most important agglomeration mechanism at work, and while knowledge spillovers also seem to contribute to industry agglomeration, the effect seems to be limited to the local level. Dumais et al (1997), Glaeser and Kerr (2009), Ellison et al (2010) and Jofre-Monseny et al (2011) examine co-agglomeration patterns and test whether industries that co-locate are those that use the same type of workers (labor market pooling), have a customer-supplier relationship (input sharing) and/or
use the same technologies (knowledge spillovers)6. These studies have found evidence in
support of all three theories.
The remainder of the paper is organised as follows. In section 2 we describe the data. In section 3 we explain how we estimate the industry-specific measures of localization and urbanization economies and describe these results. In section 4 we examine the industry characteristics used to explain why localization and urbanization economies matter in some industries and not in others. In section 5 we present and discuss the results obtained and section 6 concludes.
2. Data
The analysis is performed at the city level, where cities are defined as aggregations of municipalities built on the basis of commuting patterns7. There are 806 such cities in Spain,
although we only consider those with more than 10,000 inhabitants in order to exclude primarily rural areas. Eventually, therefore, our study includes 477 cities, which in 2001 contained 95% of the population and employment in Spain.
The dependent variable is constructed using SABI, the Iberian section of the (Bureau van Dijk’s) Amadeus database, which contains the annual accounts of more than 1 million Spanish firms. In 2002, the firms in this database represented 80 percent of the firms in the Spanish Social Security Register8. This firm-level database contains the location
(municipality) of the firm, the year the firm was created, and its industry. Our dependent variable is defined as the number of firms created in 2002, 2003 and 2004 by industry and location. 17,600 new manufacturing firms were created in our database in this period. The industry definition that we use corresponds to that of the three-digit level in the 1993 National Classification of Economic Activities (CNAE 93 Rev.1). We exclude those industries with fewer than 15 new firms in the estimation sample; this leaves us with 75
6 Dumais et al (1997) report various analyses. Here, we refer to the analysis conducted in Section 6; this does not appear in Dumais et al (2002), the published version of the paper.
7The city aggregations we use were constructed by Boix and Galleto (2006) in order to obtain
self-contained local labor markets. In 2001, there were 8,108 municipalities (political and administrative divisions) in Spain. We exclude the municipalities in the regions of Ceuta and Melilla (the two Spanish enclaves in North Africa).
8 To explore the representativeness of the SABI database in terms of the geographical and industrial distribution of the firms included therein, we computed various correlations between the SABI and the Social Security Register. In terms of the number of firms per municipality (province), the correlation between the SABI and the Social Security Register distributions is 0.902 (0.943). In the case of the number of firms per (two-digit) industry, the correlation between these two distributions is 0.942. Hence, the coverage (and the geographical and industrial representativeness) of the SABI database seem reasonably good.
three-digit industries. The distribution of new firms per city and industry is summarized in Table 1.
[Insert Table 1 here]
We report the maximum and the average number of new firms per industry and city for the five industries with most creations, the median industry in terms of creations, and the five industries with fewest creations. Around 2,200 new firms were created in the industry Manufacture of structural metal products (CNAE 281) during this period, representing 15.6% of all new creations. This industry is followed by Printing and service activities related to printing (CNAE 222) and the Manufacture of furniture (CNAE 361) industries, which account for 8.3% and 7.9% of the new firms respectively. The figure reported in the last column of the table is the share of cities with zero births in the industry and reflects the geographical concentration of new firm creation throughout Spanish territory. For example, in the industries Manufactures of insulated wire and cable (CNAE 313), Manufactures of leather clothes (CNAE 181) and Manufactures of sports goods (CNAE 364) no new firms were created in around 97% of Spanish cities during this period.
3. Measuring localization and urbanization effects
We formalize the firm creation process using the random profit function approach developed in Carlton (1983). The linear expected profit function we posit is:
kic i ic ic i urb ic i loc
kic =β ·emp +β ·emp +x 'γ +ε
π - (1)
where πkic denotes the profit of firm k (in industry i) in city c. This profit level is
determined by (1) localization economies measured by the log of the same industry employment level in the city (empic), (2) urbanization economies measured by the log of the
city employment outside industry i, (3) location determinants other than agglomeration
economies contained in the vector xic, and (4) an unobservable error term that varies
across firms and locations (εkic).
If we assume that εkic follows an extreme value type II distribution, the probability that firm k locates in geographical unit c has a conditional logit form:
∑
⋅ ⋅ + + ⋅ ⋅ = − − c i ic ic i urb ic i loc i ic ic i urb ic i loc γ ' x emp β + emp β exp( γ ' x emp β + emp β exp( c) in locates k Pr(firm ) ) (2)Guimarães et al (2003) have shown that the conditional logit coefficients can be equivalently estimated using the Poisson regression with exponential mean function:
) γ ' x emp β + emp β ) E(N i ic ic i urb ic i loc ic =exp( ⋅ ⋅ − + (3)
where the dependent variable (Nic) is the number of new firms in industry i and city c. This
implies that Poisson estimates can be given a random profit maximization framework. To avoid simultaneity, the dependent variable is the number of firms created between 2002 and 2004 whereas the explanatory variables are measured in 2001. All explanatory variables are entered in logs, implying that coefficients can be interpreted as elasticities9.
The vector of control variables xic includes the (log of) the city’s land area and a set
of regional fixed effects10. The land area is included as cities with more land might be
chosen more frequently, which implies that i
urb
β can also be interpreted as the elasticity of density11. The regional fixed effects are included to control for location determinants that
are common across locations within a region such as the market potential (in terms of consumers), regional policies or the remoteness of an area.
Equation (3) is estimated separately for each of the 75 industries considered, so that
we obtain 75 industry-specific estimates of localization ( i
loc
βˆ ) and urbanization ( i
urb
βˆ ) economies. These estimates and their (robust) standard errors are reported in Table A1 which is deferred to the annex. Graphs 1a and 1b plot all coefficient estimates (as well as their 95 confidence intervals) for the localization and urbanization elasticities respectively.
[Insert Graph 1a and 1b]
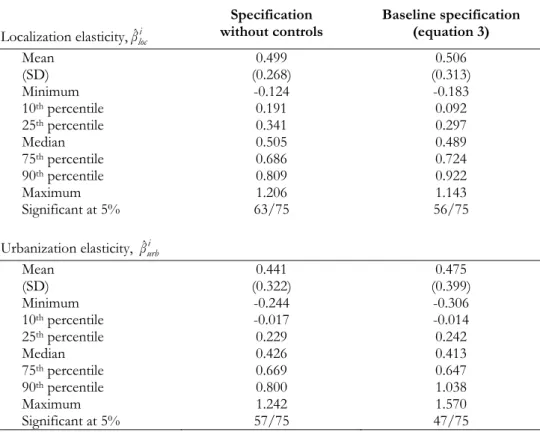
Summary statistics of these estimates are provided in the second column of Table 2. The average localization elasticity estimate is 0.506 with a standard error of 0.313. For 56 (out of 75) industries, the localization coefficient is positive and statistically significant. The localization estimates range from -0.183 (Manufacture of motor vehicles – CNAE 341) to 1.143 (Manufacture of jewellery and related articles – CNAE 362). The median localization elasticity is
9 The employment level is zero in some industry and city pairs. To take logarithms, we follow
Crépon and Duguet (1997). We create a dummy variable that takes the value of one if employment is zero in a given industry and city. We sum this dummy variable to the employment level and take the log of this sum. Then, the dummy variable indicating zero employment is included as a separate regressor in the estimations.
10 Regions correspond to the 17 Spanish NUTS 2 regions.
11 Suppose the specification isE(N) β employment/area)+β area ) a
d log( log( )
exp( ⋅ ⋅
= . Then, the density
0.489 (Building and repairing of ships and boats – CNAE 351) and is close to the average elasticity (0.506). This indicates that the distribution is not far from being symmetric, which contrasts with the distribution of geographic concentration indices that tend to be strongly skewed to the right - see, for example, Ellison and Glaeser (1997). As for urbanization economies, the average estimate is 0.475 with a standard deviation of 0.399. The urbanization coefficient is positive and statistically significant in 47 (out of 75) industries. The smallest urbanization estimate is -0.306 (Manufacture of footwear –CNAE 193), the largest is 1.570 (Manufacture of sports goods- CNAE 364), and the median is 0.413 (Casting of metals – CNAE 275). In the first column of Table 2, we provide the corresponding summary of the localization and urbanization elasticities when the regional fixed effects and the city’s land area are dropped from equation (3). The results do not differ to any significant extent.
[Insert Table 2 here]
The results reported here serve to confirm three findings previously reported in the empirical literature on agglomeration economies and reviewed in Rosenthal and Strange (2004). First, agglomeration economies seem to be an important determinant of firm location decisions (and firm productivity). Second, both localization and urbanization economies do matter. Third, the importance of localization and urbanization economies varies substantially across industries.
Inspecting Table A1 reveals the industries in which localization and urbanization economies have the greatest effect. The five industries with the largest localization effects are the Manufacture of jewellery and related articles (CNAE 362), the Manufacture of games and toys (CNAE 365), the Manufacture of footwear (CNAE 193), the Preparation and spinning of textile fibres (CNAE 171) and the Manufacture of knitted and crocheted articles (CNAE 177). Conversely, the five industries with the largest urbanization effects are the Manufacture of sports goods (CNAE 364), the Manufacture of electric motors, generators and transformers (CNAE 311), the Reproduction of recorded media (CNAE 223), the Manufacture of instruments and appliances for measuring, testing and navigating (CNAE 332) and the Manufacture of motor vehicles (CNAE 341). Interestingly, the urbanization economies estimates for the five industries with the largest localization effects are negative or statistically insignificant. Similarly, the localization economies estimates for the five industries with the largest urbanization economies are negative or statistically insignificant. Graph 2 documents the systematic negative correlation between localization and urbanization effects at the industry level. This
evidence suggests that urbanization effects tend to be unimportant in industries where localization effects do matter and vice versa.
[Insert Graph 2 here]
4. What underlies localization and urbanization effects? Theories and predictions
We now turn to characterize the industries for which localization vis-à-vis urbanization economies matter in light of the agglomeration theories that have been described and documented in the literature.
4.1. Labor market pooling. A thick local labor market (labor market pooling) facilitates the flow of workers across firms in the presence of firm-specific shocks (Krugman, 1991) and enhances employer-employee matches (Hesley and Strange, 1990). Fallick et al (2006) show that worker mobility between firms is higher in specialized areas. Overman and Puga (2010) find that industries that experience greater volatility are more geographically concentrated. Thus, these two studies provide evidence that, in a thick labor market, firms and workers are in a better position to face firm-specific shocks. Costa and Kahn (2000) and Andersson et al (2007) have shown that employer-employee matches are better in densely populated areas. Empirical support for the labor market pooling hypothesis has also been provided by Glaeser and Kerr (1999), Ellison et al (2010) and Jofre-Monseny et al (2011) by showing that industries using similar workers (in terms of occupation) tend to co-locate geographically.
The hypothesis that same industry firms co-locate in space to share a pool of specialized workers is consistent with the idea that localization effects are more important in industries employing workers with industry-specific skills. Conversely, urbanization effects are hypothesised as being more important in industries that employ workers whose skills are not so industry-specific12.
We measure how industry-specific the skills of workers in each industry are by computing an occupational dissimilarity index between an industry and the rest of the economy. We consider all the manufacturing workers included in the second quarter of the 2001 and 2005 waves of the Spanish Labor Force Survey (EPA). Workers are classified in 207 different occupations which correspond to the three-digit level of the 1994 National
12In a study analyzing the determinants of the geographic concentration of industries, Rosenthal
and Strange (2001) consider that skilled workers are less mobile across industries than their unskilled counterparts. If this assumption is correct, large localization economies would be expected in industries with high proportions of skilled workers.
Classification of Occupations13. Constructed as a Duncan and Duncan (1955) dissimilarity
index, the variable Skill specificityi compares the occupational structure of an industry with
that of the rest of the economy (including agriculture and services sectors):
∑
-o i i -o i oi i L L L L 2 1 = y specificit Skill (4)where o indexes occupation and L denotes the number of workers. This index is bounded between 0 and 1 and, in this application, can be interpreted as the share of workers in industry i that would need to change occupation to mimic the distribution of occupations in the economy. The first row in Table 3 provides its summary statistics. The average skill specificity is 0.370 with a standard deviation of 0.047. The manufacturing industry employing most skill-specific workers is the Manufacture of furniture (CNAE 361) with an index of 0.492. The industry employing workers with skills that are least specific to the industry is the Manufacture of machinery for the production and use of mechanical power (CNAE 291) with an index of 0.286.
4.2. Input sharing. The concentration of firms in a geographical area enables firms to share input suppliers (input sharing). Bartlesman et al (1994), Holmes (1999), Holmes and Stevens (2002) and Li and Lu (2009), among others, have tested the relevance of the input sharing mechanism. Their results indicate that the co-location of firms reduces the transportation costs of purchasing inputs and selling outputs. When examining co-agglomeration patterns, Glaeser and Kerr (2009), Ellison et al (2010) and Jofre-Monseny et al (2011) have documented that industries with a customer-supplier relationship tend to co-locate geographically.
We consider input sharing to be a (potentially) more important agglomeration theory in industries that are intensive in the use of manufactured inputs. Following Holmes (1999) and Rosenthal and Strange (2001), we measure input intensity by dividing purchased manufactured inputs by sales (Manufactured inputs per € of salesi). If same industry firms
co-locate to share specialized input suppliers, we can expect localization effects to be greater in industries with higher input intensities. Conversely, in the case of firms locating in large urban areas to be close to a wide range of input providers, we would expect greater urbanization effects in these input dependent industries.
13 A complete list of these occupations can be found in the (on-line) appendix in Jofre-Monseny et al (2011).
The variable manufactured inputs per € of sales is computed with data drawn from the 2001 Catalan Input-Output Table from the Statistical Institute of Catalonia (IDESCAT)14.
We use this regional table instead of the Spanish one because it enables us to characterize
customer-supplier relations for narrowly defined industries15. The second row in Table 3
summarizes manufactured input intensity at the industry level. The average input intensity is 0.305 with a standard deviation of 0.103. The Manufacture of knitted and crocheted articles industry (CNAE 177) is the industry with the highest manufactured input intensity (0.547) whereas the Manufacture of dairy products (CNAE 155) is the industry with the lowest intensity (0.112).
4.3. Knowledge spillovers. According to the knowledge spillover agglomeration theory, geographical proximity facilitates the transmission of knowledge between workers and firms. The most direct test of their existence is provided by patent studies showing that inventors are more likely to cite other inventors who are geographically closer (Jaffe et al, 1993; and Agrawal et al, 2008 and 2010). Co-agglomeration patterns also suggest that firms that use similar technologies tend to co-locate geographically, although the implied effects tend to be small in magnitude – see Glaeser and Kerr (2009), Ellison et al (2010) and Jofre-Monseny et al (2011).
We assume that knowledge spillovers are more important in knowledge-intensive industries. We proxy knowledge intensity with the share of workers in the industry that hold a university degree. The hypothesis that same industry firms co-locate to reap the benefits of intra-industry knowledge spillovers is consistent with the idea that localization effects are more important in industries with high proportions of skilled workers. Conversely, the notion that firms co-locate in large urban areas to reap the benefits of inter-industry knowledge spillovers is consistent with urbanization effects being more important in knowledge-intensive industries.
The share of workers with a university degree (knowledge intensityi) is constructed
with the educational level of workers contained in the second quarter of the 2001 and 2005 waves of the Spanish Labor Force Survey (EPA). The third row of Table 3 provides summary statistics of the share of graduates at the industry level. The average share of
14 Catalonia is a region in the north-east of Spain. In 2001, the population of Catalonia (6,361,365 inhabitants) represented 15.5% of the Spanish population, 17.5% of its employment and 24% of its manufacturing employment.
15 The Catalan (Spanish) Input-Output table enables us to characterize the supplier-customer relations for 122 (71) industry pairs.
graduates is 0.126 with a standard deviation of 0.095. Publishing (CNAE 221) has the largest share of skilled workers (0.474) whereas Manufacture of leather clothes (CNAE 181) has the lowest share (0).
4.4. First nature agglomeration. The literature has also documented that natural resources affect the location of economic activities - see, for example, Ellison and Glaeser (1999). Given that energy and primary activities are concentrated geographically, the location of industries that are heavily dependent on these resources will also tend to be geographically concentrated. In terms of predictions, therefore, we would expect greater localization effects in industries that make a more intensive use of energy and primary sector inputs. Given that energy and primary sector industries are not particularly concentrated in large cities, we expect the effects of urbanization economies to be low in these industries.
We define the variable Energy and primary sector inputs per € of sales as the sum of inputs purchased from the energy and primary sectors divided by sales using data from the 2001 Catalan Input-Output Table. Summary statistics are provided in the fourth row of Table 3. The Production, processing and preserving of meat and meat products (CNAE 151) is the industry with the highest ratio of energy and primary sector inputs to sales (0.412). The lowest ratio is 0.004. This figure corresponds to the Manufacture of office machinery and computers (CNAE 300).
5. What underlies localization and urbanization effects? Results
We now turn to explore which industry characteristics account for the inter-industry differentials in the importance of localization and urbanization economies. In Table 4a we report the results for localization effects. The first four columns show the bivariate ordinary least squares (OLS) regressions between the 75 industry-specific localization estimates (the i
loc
βˆ ’s) and each of the four industry characteristics reflecting the potential importance of the different agglomeration theories. In turn, column five shows the OLS regressions when all industry characteristics are entered simultaneously in the regression. The standard errors reported are robust to heteroskedasticity and contain a small sample correction16. Table 4b reports the results for the urbanization effects (the i
urb
βˆ ’s) and has the same structure as that of Table 4a.
[Insert Table 4a here]
Starting with the first column of Table 4a, the results show that localization effects tend to be more important in industries that employ workers whose skills are more industry-specific. In particular, one standard deviation increase in skill specificityi is associated
with a 0.08 increase in i loc
βˆ accounting for a quarter of a standard deviation in this estimated variable. Hence, the results suggest that same industry firms co-locate to share a pool of specialized workers. The coefficient in the second column indicates a statistically (and economically) insignificant relationship between localization effects and input intensity
(proxied by Manufactured inputs per € of salesi). Hence, our results do not support the
hypothesis that same industry firms co-locate in space to share specialized input suppliers. The third column documents a negative relationship between knowledge intensityi (proportion
of graduates in the industry) and localization effects. This suggests that same industry firms do not locate in specialized economic environments to reap the benefits of intra-industry knowledge spillovers. On the contrary, the results indicate that firms in knowledge-intensive industries tend to avoid agglomerations of same industry firms. To be specific, one standard deviation increase in knowledge intensityi is associated with a 0.09 decrease in
i loc
βˆ (accounting for 29% of a standard deviation in i
loc
βˆ ). In fact, note that the five industries with the largest localization effects (Manufacture of jewellery and related articles -CNAE 362, the Manufacture of games and toys - -CNAE 365, the Manufacture of footwear --CNAE 193, the Preparation and spinning of textile fibres - CNAE 171, and the Manufacture of knitted and crocheted articles - CNAE 177) do not stand out as being particularly knowledge-intensive industries. In the fourth column, the correlation between localization effects and Energy and primary sector inputs per € of salesi is reported. The coefficient of this regression is positive and
statistically significant. One standard deviation increase in this explanatory variable is associated with a 0.056 increase in i
loc
βˆ which is equivalent to 18% of a standard deviation in this variable. This suggests that part of the observed localization effects is explained by first-nature agglomeration effects. Finally, column 5 reports the regression results obtained when all industry characteristics are considered simultaneously. The qualitative and quantitative (bivariate) findings reported in columns 1 to 4 remain largely unchanged.
We now turn to the description of the urbanization economies effects reported in Table 4b. We find that the effects of urbanization economies are neither lower nor higher in industries that use workers with more industry-specific skills. Likewise, we find that urbanization economies are neither more nor less important in industries that use manufactured inputs more intensively. By contrast, there is evidence that urbanization effects are more important in those industries with high proportions of skilled workers. In particular, one standard deviation increase in the share of graduates implies a 0.16 increase in i
urb
βˆ which accounts for 40% of a standard deviation in this estimated variable. In fact, among the five industries with the largest urbanization effects, three (Manufacture of electric motors, generators and transformers (CNAE 311), the Reproduction of recorded media (CNAE 223), the Manufacture of instruments and appliances for measuring, testing and navigating (CNAE 332) are among the most knowledge-intensive manufactures. These results suggest that firms co-locate in large urban areas to reap the benefits of inter-industry knowledge spillovers.The results in column four document a negative correlation between urbanization economies and the Energy and primary sector inputs per € of salesi variable. This is unsurprising given that
large urban areas do not tend to coincide with the locations of energy and primary sector industries. The implied effect is not small. One standard deviation increase in Energy and primary sector inputs per € of salesi is associated with a 0.12 increase in βˆ (accounting for 31% urbi
of a standard deviation in this variable).
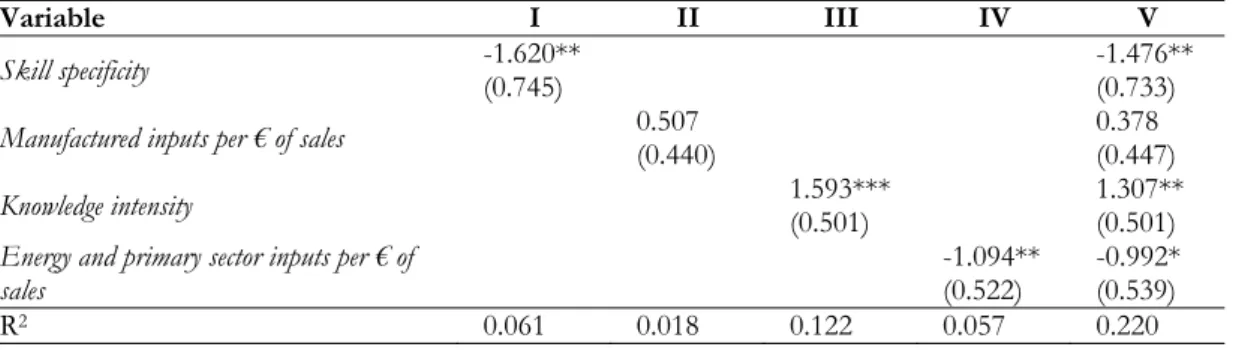
To account for the fact that in some industries, localization (and urbanization) effects are estimated with more precision than in others, in Tables A2 and A3, deferred to the annex, we report weighted least squares regression results with weights given by the
inverse of the standard errors of i
loc
βˆ and i
urb
βˆ respectively. The main qualitative and
quantitative results remain unchanged although the positive effect of Energy and primary sector inputs per € of salesi on βˆloci is no longer statistically significant whereas the coefficient
capturing the effect of skill specificityi on βˆurbi decreases and becomes statistically significant.
Henderson et al (1995), Combes (2000), Viladecans-Marsal (2004) and Jofre-Monseny (2009) have previously noted a tendency for localization (urbanization) effects to be more (less) important in traditional (advanced) industries. The results reported here provide a systematic documentation of these relationships. Graphs 3a and 3b provide further visual evidence of these relationships.
Based on our results, firms in industries where knowledge is less important not only avoid large cities but also tend to co-locate with same industry firms in specialized economic environments. A possible explanation for this behaviour, according to our findings, might be related to their ability to share a pool of specialized workers. An alternative (and complementary) explanation could be that same industry firms co-locate in specialized areas to share input suppliers. However, in contrast with Overman and Puga (2010), we find no support for this hypothesis. The latter authors report that industries that are intensive in their use of manufactured inputs produced by geographically concentrated industries are, in turn, geographically concentrated17.
These findings connecting knowledge intensity and skill specificity with the relative importance of localization vis-à-vis urbanization effects in industries can be rationalized in terms of Duranton and Puga’s (2001) ‘nursery cities’ model, in which innovative firms concentrate in diverse (and large) urban areas where inter-industry knowledge flows spur firm innovation. Once an activity matures and its production technology becomes standardized, the agglomeration advantages of large urban areas are offset by congestion costs. At this point, activities relocate to specialized economic areas to benefit from industry-specific, cost-reducing agglomeration effects
6. Conclusions
The objective of this paper has been to shed light on the underlying causes of localization and urbanization economies. To this end, and drawing on data describing new firm locations in Spain, we have characterized industries for which localization and urbanization economies are important. In line with the literature, we find strong evidence of localization and urbanization effects on new firm location in most industries. However, a negative correlation is found between localization and urbanization effects at the industry level, suggesting that urbanization effects tend to be unimportant in industries where localization effects are important and vice versa. As for the factors that explain differences in localization and urbanization effects across industries, we have found that firms locate in large urban areas to reap the benefits of inter-industry knowledge spillovers whereas firms
17 In line with this study, we have interacted the variable Manufacturing inputs per € of sales with a measure of the degree to which the input suppliers of each industry are geographically concentrated. The slope of this interaction term is statistically insignificant and close to zero.
that locate in specialized economic environments do so (partly) to share a pool of specialized workers.
The results reported in this paper would appear to have important policy implications. First, they indicate that firms do not locate in specialized economic environments to reap intra-industry knowledge spillovers. This implies that policy initiatives that seek to promote local specialization in knowledge based activities are largely misguided18. Second, if cluster policies can be justified, they are more likely to be effective
in traditional sectors where specialization can generate advantages such as a shared pool of specialized workers or proximity to specialized input suppliers.
References
Andersson, F., Burgess, S. and Lane, J.I. (2007), “Cities, matching and the productivity gains of agglomeration”, Journal of Urban Economics, 61, 112-128.
Arauzo-Carod, J.M. (2005), “Determinants of industrial location: An application for Catalan municipalities”, Papers in Regional Science, 84(1), 105-120.
Arauzo-Carod, J.M., Liviano, D. and Manjón, M. (2010), “Empirical studies in industrial location: an assessment of their methods and results”, Journal of Regional Science, 50, 685-711.
Agrawal, A., Cockburn, I. and Rosell, C. (2010), “Not invented here? Innovation in company towns”, Journal of Urban Economics, 67, 78–89.
Agrawal, A., Devesh, K. and McHale, J. (2008), “How do spatial and social proximity influence knowledge flows? Evidence from patent data”, Journal of Urban Economics, 64, 264–269.
Bartlesman, E., Caballero, R. and Lyons, R. (1994), “Customer and supplier driven externalities”, American Economic Review, 84, 1,075–1,084.
Boix, R., Galletto, V. (2006), “Sistemas Locales de Trabajo y Distritos Industriales Marshallianos en España”, Economía Industrial, 359, 165–184.
Broersma, L. and Oosterhaven, J. (2009), “Regional labor productivity in the Netherlands: Evidence of agglomeration and congestion effects”, Journal of Regional Science, 49, 483-511.
Buenstorf, G. and Klepper, S. (2010), “Why does entry cluster geographically? Evidence from the US tire industry”, Journal of Urban Economics, 68, 103–114.
Carlino, G. (1979), “Increasing Returns to Scale in Metropolitan Manufacturing,” Journal of Regional Science, 19, 363–373.
Carlton, D. (1983), “The Location and Employment Choices of New Firms: An Econometric Model with Discrete and Continuous Endogenous Variables”, Review of Economics and Statistics, 65, 440-449.
Combes, P.P. (2000), “Economic Structure and Local Growth: France, 1984–1993”, Journal of Urban Economics, 47,329-355.
Combes P.P., Duranton, G. and Gobillon, L. (2008), “Spatial wage disparities”, Journal of Urban Economics, 63, 723-742.
Costa, D. and Kahn, M. (2001), “Power Couples”, Quarterly Journal of Economics, 116, 1,287-1,315.
Crepon, B. and Duguet, E. (1997), “Estimating the innovation function from patent numbers: GMM on count panel data”, Journal of Applied Econometrics, 12(3), 243-263. De Blasio, G. and Di Addario, S. (2005), “Do Workers Benefit from Industrial
Agglomeration?”, Journal of Regional Science, 45, 797–827.
Dumais, G., Ellison, G. and Glaeser, E. (1997), “Geographic concentration as a dynamic process”, NBER Working Paper 6270.
Dumais, G., Ellison, G. and Glaeser, E. (2002), “Geographic concentration as a dynamic process”, The Review of Economics and Statistics, 84, 193-204.
Duncan, O. and Duncan, B. (1955), “A Methodological Analysis of Segregation Indexes”, American Sociological Review, 20, 210-17.
Duranton, G. and Puga, D. (2001), “Nursery cities: urban diversity, process innovation, and the life-cycle of products”, American Economic Review, 91, 1,454-1,477.
Ellison, G. and Glaeser, E. (1997), “Geographic Concentration in U.S. Manufacturing Industries: A Dartboard Approach”, Journal of Political Economy, 105, 889–927.
Ellison, G. and Glaeser, E. (1999), “The geographic concentration of an industry: Does natural advantage explain agglomeration”, The American Economic Review, 89(2), 311-316. Ellison, G., Glaeser, E. and Kerr, W. (2010), “What Causes Industry Agglomeration?
Evidence from Coagglomeration Patterns”, American Economic Review, 100, 1,195-1,213. Fallick, B., Fleischman, C. and Rebitzer, J.B. (2006), “Job hopping in the Silicon Valley: the
micro-foundations of an industry cluster”, Review of Economics and Statistics, 88, 472-481.
Fu, S. and Hong, J (2011), “Testing urbanization economies in manufacturing industries:
Glaeser, E., Kallal, H., Scheinkman, J. and Shleifer, A. (1992), “Growth in cities”, Journal of Political Economy, 100, 1,126–1,152.
Glaeser, E. and Kerr, W (2009), “Local industrial conditions and entrepreneurship: How much of the spatial distribution can we explain?”, Journal of Economics and Management Strategy, 18, 623-663.
Graham, D.J. (2009), “Identifying urbanisation and localisation externalities in manufacturing and service industries”, Papers in Regional Science, 88, 63-84.
Graham, D.J., Melo, P.S., Jiwattanakulpaisarn, P. and Noland, R.B. (2010), “Testing for causality between productivity and agglomeration economies”, Journal of Regional Science, 50, 935–951.
Guimarães, P., Figueiredo, O. and Woodward, D. (2003), “A tractable approach to the firm location decision problem”, Review of Economics and Statistics, 85 (1), 201–204.
Guimarães, P., Figueiredo, O. and Woodward, D. (2004), “Industrial location modelling: extending the random utility framework”, Journal of Regional Science, 44, 1–20.
Henderson, J.V. (2003), “Marshall's Scale Economies”, Journal of Urban Economics, 53, 1-28. Henderson, V., Kuncoro, A. and Turner, M. (1995), “Industrial development in cities”,
Journal of Political Economy, 103, 1,067–1,085.
Hesley, R.W. and Strange, W.C. (1990), “Agglomeration economies and matching in a system of cities”, Regional Science and Urban Economics, 20, 189–212.
Holmes, T. (1999), “Localization of Industry and Vertical Disintegration”, Review of Economics and Statistics, 81(2), 314-325.
Holmes, T. and Stevens, J. (2002), “Geographic Concentration and Establishment Scale”, Review of Economics and Statistics, 84(4), 682-691.
Jaffe, A., Trajtenberg, M. and Henderson, R. (1993), “Geographic Localization of Knowledge Spillovers as Evidenced by Patent Citations”, Quarterly Journal of Economics, 108, 577-598.
Jofre-Monseny, J. (2009), “The scope of agglomeration economies: Evidence from Catalonia”, Papers in Regional Science, 88(3), 575-590.
Jofre-Monseny, J., Marín-López, R. and Viladecans-Marsal, E. (2011), “The mechanisms of agglomeration: Evidence from the effect of inter-industry relations on the location of new firms”, Journal of Urban Economics, 70, 61-74.
Li, B. and Lu, Y. (2009), “Geographic concentration and vertical disintegration: Evidence from China”, Journal of Urban Economics, 65, 294-304.
Martin, P., Mayer, T. and Mayneris, F. (2011), “Spatial Concentration and Firm-Level Productivity in France”, Journal of Urban Economics, 69, 182-195.
Overman, H. and Puga, D. (2010), “Labor pooling as a source of agglomeration: An empirical investigation”, in Glaeser, E. (Ed.), Agglomeration Economics, Chicago University Press, Chicago, IL.
Rosenthal, S. and Strange, W.C. (2001), “The Determinants of Agglomeration”, Journal of Urban Economics, 50, 191-229.
Rosenthal, S. and Strange, W.C. (2003), “Geography, industrial organization and agglomeration”, The Review of Economics and Statistics, 85(2), 377-393.
Rosenthal S. and Strange W.C. (2004), “Evidence on the nature and sources of agglomeration economies”, in Henderson, J.V. and J.F. Thisse (Eds.), Handbook of urban and regional economics, vol. 3, North-Holland, Amsterdam.
Sveikauskas, L., Gowdy, J. and Funk, M. (1988), “Urban Productivity: City Size or Industry Size”, Journal of Regional Science, 28, 185–202.
Van Soest D., Gerking S., van Oort, F. (2006), “Spatial impacts of agglomeration externalities”, Journal of Regional Science, 46, 881–899.
Viladecans-Marsal, E. (2004), “Agglomeration economies and industrial location: city-level evidence”, Journal of Economic Geography, 4, 565–582.
Table 1. New firms created in Spain 2002-2004; 75 three-digit manufacturing industries.
Industry firmsNew firms New
(%) Mean Maximum
Cities with zero births
(%) The five industries with the highest number of new firms
Manufacture of structural metal
products (CNAE 281) 2,188 15.65% 4.587 (Madrid) 167 26.21% Printing and service activities related
to printing (CNAE 222) 1,159 8.29% 2.430 (Madrid) 294 61.64% Manufacture of furniture (CNAE 361) 1,108 7.92% 2.323 (Valencia) 101 49.06% Publishing (CNAE 221) 971 6.94% 2.036 (Madrid) 329 73.38% Manufacture of other wearing apparel and
accessories (CNAE 182) 593 4.24% 1.243 (Madrid) 86 69.81% Median
Manufacture of luggage, handbags and the like,
saddlery and harness (CNAE 192) 73 0.52% 0.153 (Ubrique - Elda) 13 94.76% The five industries with the lowest number of new firms
Manufacture of motor vehicles (CNAE 341) 19 0.14% 0.040 (Barcelona - 3
Zaragoza) 96.86% Manufacture of grain mill products, starches and
starch products (CNAE 156) 18 0.13% 0.377 (Madrid) 2 96.44% Manufacture of sports goods (CNAE 364) 17 0.12% 0.356 (Barcelona) 6 97.90% Manufacture of leather clothes (CNAE 181) 16 0.11% 0.335 (Madrid) 4 97.48% Manufacture of insulated wire
and cable (CNAE 313) 16 0.11% 0.335
3 (BCN –
Table 2. Distribution of localization and urbanization estimates; 75 three-digit manufacturing industries.
Localization elasticity,βˆloci
Specification
without controls Baseline specification (equation 3)
Mean (SD) (0.268) 0.499 (0.313) 0.506 Minimum -0.124 -0.183 10th percentile 0.191 0.092 25th percentile 0.341 0.297 Median 0.505 0.489 75th percentile 0.686 0.724 90th percentile 0.809 0.922 Maximum 1.206 1.143 Significant at 5% 63/75 56/75
Urbanization elasticity, βˆurbi
Mean (SD) (0.322) 0.441 (0.399) 0.475 Minimum -0.244 -0.306 10th percentile -0.017 -0.014 25th percentile 0.229 0.242 Median 0.426 0.413 75th percentile 0.669 0.647 90th percentile 0.800 1.038 Maximum 1.242 1.570 Significant at 5% 57/75 47/75
Table 3. Summary statistics for industry characteristics; 75 three-digit manufacturing industries.
Variable Mean (S.D.) Median Maximum Minimum
Skill specificityi 0.370
(0.047) (Processing and preserving of 0.367 fruit and vegetables -CNAE 153)
0.492
(Manufacture of furniture - CNAE 361)
0.286
(Manuf. of machinery for the production and use of mechanical power - CNAE 291) Manufactured
inputs per € of salesi 0.305
(0.103) (Manuf. of other products of 0.307 wood, cork, straw and plaiting
materials - CNAE 205)
0.547
(Manufacture of knitted and crocheted articles - CNAE
177)
0.112
(Manufacture of dairy products - CNAE 155) Knowledge intensityi 0.126
(0.950) (Manufacture of ceramic tiles 0.097 and flags - CNAE 263)
0.474
(Publishing - CNAE 221) Manufacture of leather clothes - 0 CNAE 181) Energy and primary
sectorinputs per € of salesi
0.043
(0.075) (Manuf. of knitted and 0.008 crocheted fabrics CNAE 176)
0.412
(Production, processing and preserving of meat and meat products - CNAE 151)
0.0004
(Manuf. of office machinery and computers -CNAE 300)
Table 4a. The determinants of localization economies; N=75.
Variable I II III IV V
Skill specificity 1.722**(0.834) 1.745* (0.893)
Manufactured inputs per € of sales -0.197(0.430) -0.174 (0.414)
Knowledge intensity -0.954**(0.439) -0.817* (0.415)
Energy and primary sector inputs per € of
sales 0.751*** 0.679* (0.277) (0.368)
R2 0.066 0.004 0.084 0.032 0.172
Notes: 1) OLS estimates; 2) HC3 robust standard errors in parentheses; 3) ***, ** and * statistically significant at 1, 5 and 10%.
Table 4b. The determinants of urbanization economies; N=75.
Variable I II III IV V
Skill specificity -0.844(1.003) -0.892 (1.108)
Manufactured inputs per € of sales 0.549(0.489) 0.294 (0.446)
Knowledge intensity 1.677***(0.559) 1.524*** (0.566)
Energy and primary sector inputs per € of
sales -1.656*** -1.382***(0.460) (0.376)
R2 0.010 0.020 0.160 0.096 0.247
Notes: 1) OLS estimates; 2) HC3 robust standard errors in parentheses; 3) ***, ** and * statistically significant at 1, 5 and 10%.
Graph 1a. Localization elasticity estimates; 75 three-digit level industries.
-1 0 1 2
Notes: Dots are estimated coefficients of the localization economies variable -econometric specification described in (3). The dashed lines are the 95% confidence intervals based on robust standard errors.
Graph 1b. Urbanization elasticity estimates; 75 three-digit level industries.
-1 0 1 2 3
Notes: Dots are estimated coefficients of the urbanization economies variable -econometric specification described in (3). The dashed lines are the 95% confidence intervals based on robust standard errors.
Graph 2. Localization (vertical axis) versus urbanization (horizontal axis) elasticities; N=75. -0.3 0.1 0.5 0.9 1.3 -0.4 0 0.4 0.8 1.2 1.6
Notes: The solid line is the OLS fit given by i =
loc
βˆ 0.81-0.63⋅βˆurbi where the (HC3 heteroskedasticity robust) t-statistic and the R2 are -12.87 and 0.652 respectively.
Graph 3a. Localization elasticity (vertical axis) as a function of the industry share of graduate workers (horizontal axis); N=75.
-0.3 0.1 0.5 0.9 1.3 0 0.1 0.2 0.3 0.4 0.5
Notes: The solid line is the OLS fit corresponding to the estimates of column 3 in Table 4a.
Graph 3b. Urbanization elasticity (vertical axis) as a function of the industry share of graduate workers (horizontal axis); N=75.
-0.4 0 0.4 0.8 1.2 1.6 0 0.1 0.2 0.3 0.4 0.5
Notes: The solid line is the OLS fit corresponding to the estimates of column 3 in Table 4b.
Table A1. Poisson localization and urbanization estimates, baseline specification – equation (3)
CNAE 93
(Rev. 1) Industry description βˆloci
Robust s.e. βˆurbi
Robust s.e.
151 Production, processing and preserving of meat and meat products 0.797*** (0.066) -0.172** (0.071) 152 Processing and preserving of fish and fish products 0.856*** (0.141) 0.173 (0.200) 153 Processing and preserving of fruit and vegetables 0.473*** (0.096) 0.273** (0.131) 154 Manuf. of vegetable and animal oils and fats 0.791*** (0.124) 0.119 (0.125) 155 Manuf. of dairy products 0.419*** (0.122) 0.257* (0.150) 156 Manuf. of grain mill products, starches and starch products 0.908** (0.371) 0.279 (0.298) 157 Manuf. of prepared animal feeds 0.731*** (0.210) 0.344** (0.168) 159 Manuf. of beverages 0.800*** (0.048) -0.246*** (0.060) 171 Preparation and spinning of textile fibres 1.016*** (0.139) 0.030 (0.143) 172 Textile weaving 0.425*** (0.086) 0.546*** (0.115) 173 Finishing of textiles 0.586*** (0.088) 0.468*** (0.122) 176 Manuf. of knitted and crocheted fabrics 0.861*** (0.158) 0.091 (0.156) 177 Manuf. of knitted and crocheted articles 1.015*** (0.301) 0.240 (0.253) 181 Manuf. of leather clothes 0.064 (0.389) 0.961** (0.422) 182 Manuf. of other wearing apparel and accessories 0.791*** (0.061) 0.357*** (0.062) 183 Dressing and dyeing of fur and manuf. of articles of fur 0.646*** (0.139) 0.338** (0.144) 192 Manuf. of luggage, handbags and the like, saddlery and harness 0.931*** (0.073) 0.243* (0.140) 193 Manuf. of footwear 1.082*** (0.042) -0.306*** (0.073) 201 Sawmilling and planing of wood; impregnation of wood 0.418*** (0.123) 0.634*** (0.110) 202 Manuf. of veneer sheets, plywood, laminboard, particle board and boards 0.429*** (0.126) 0.391** (0.180)
203 Manuf. of builders’ carpentry and joinery 0.229*** (0.066) 0.614*** (0.064) 204 Manuf. of wooden containers 0.446*** (0.121) 0.390*** (0.125)
205 Manuf. of other products of wood, cork, straw and plaiting materials 0.375*** (0.068) 0.545*** (0.077) 211 Manuf. of pulp, paper and paperboard 0.149 (0.148) 0.647*** (0.166) 212 Manuf. of articles of paper and paperboard 0.725*** (0.124) 0.372** (0.145) 221 Publishing 0.645*** (0.150) 0.471** (0.211) 222 Printing and service activities related to printing 0.401*** (0.086) 0.719*** (0.113) 223 Reproduction of recorded media -0.147 (0.272) 1.374*** (0.267) 241 Manuf. of basic chemicals 0.310** (0.128) 0.647*** (0.157) 243 Manuf. of paints, varnishes and similar coatings, printing ink and mastics 0.217 (0.174) 0.711*** (0.244) 244 Manuf. of pharmaceuticals, medicinal chemicals and botanical products 0.291 (0.282) 0.738 (0.448) 245 Manuf. of soap, detergents; cleaning and polishing preparations, perfumes. 0.428*** (0.134) 0.638*** (0.183) 251 Manuf. of rubber products 0.393** (0.157) 0.817*** (0.199) 252 Manuf. of plastic products 0.715*** (0.060) 0.156** (0.070) 261 Manuf. of glass and glass products 0.351*** (0.095) 0.517*** (0.138) 262 Manuf. of non-construction, non-refractory ceramics; refractory ceramics 0.723*** (0.095) -0.044 (0.119) 263 Manuf. of ceramic tiles and flags 0.703*** (0.115) -0.118 (0.193) 264 Manuf. of bricks, tiles and construction products, in baked clay 0.573*** (0.143) 0.043 (0.200) 265 Manuf. of cement, lime and plaster 0.050 (0.201) 0.791*** (0.265) 266 Manuf. of articles of concrete, plaster and cement 0.374*** (0.081) 0.375*** (0.082) 267 Cutting, shaping and finishing of stone 0.743*** (0.048) 0.171*** (0.062) 268 Manuf. of other non-metallic mineral products 0.347* (0.202) 0.286 (0.205) 271 Manuf. of basic iron and steel and of ferro-alloys 0.163 (0.113) 0.681*** (0.148) 272 Manuf. of tubes 0.559 (0.342) 0.403 (0.354) 274 Manuf. of basic precious and non-ferrous metals 0.595*** (0.164) 0.363* (0.190) 275 Casting of metals 0.303** (0.149) 0.413** (0.185) 281 Manuf. of structural metal products 0.525*** (0.057) 0.373*** (0.059) 282 Manuf. of tanks, reservoirs and containers of metal, central heating radiators 0.505*** (0.134) 0.551*** (0.150) 284 Forging, pressing, stamping and roll forming of metal; powder metallurgy 0.444*** (0.140) 0.533*** (0.161) 285 Treatment and coating of metals; general mechanical engineering 0.518*** (0.070) 0.412*** (0.085) 286 Manuf. of cutlery, tools and general hardware 0.433*** (0.125) 0.507*** (0.155) 287 Manuf. of other fabricated metal products 0.423*** (0.062) 0.495*** (0.078) 291 Manuf. of machinery for the production and use of mechanical power 0.289* (0.153) 0.590*** (0.216) 293 Manuf. of agricultural and forestry machinery 0.639*** (0.160) -0.084 (0.157) 294 Manuf. of machine-tools 0.596*** (0.187) 0.326* (0.186) 295 Manuf. of other special purpose machinery 0.720*** (0.095) 0.107 (0.116) 297 Manuf. of domestic appliances n.e.c. 0.0393 (0.216) 0.941*** (0.320) 300 Manuf. of office machinery and computers 0.171 (0.228) 1.087*** (0.295) 311 Manuf. of electric motors, generators and transformers -0.057 (0.292) 1.446*** (0.377) 312 Manuf. of electricity distribution and control apparatus 0.086 (0.287) 0.965** (0.386) 313 Manuf. of insulated wire and cable 0.102 (0.248) 1.117*** (0.399) 315 Manuf. of lighting equipment and electric lamps 0.646*** (0.165) 0.261 (0.228) 321 Manuf. of electronic valves and tubes and other electronic components 0.625** (0.246) 0.825** (0.339) 322 Manuf. of television and radio transmitters, apparatus for line telephony 0.999** (0.457) 0.527 (0.579) 331 Manuf. of medical and surgical equipment and orthopedic appliances 0.157 (0.288) 1.156*** (0.395) 332 Manuf. of instruments and appliances for measuring, testing and navigating 0.247 (0.203) 1.321*** (0.300) 341 Manuf. of motor vehicles -0.183 (0.244) 1.177** (0.457) 342 Manuf. of bodies (coachwork) for motor vehicles, trailers and semi-trailers 0.185** (0.087) 0.512*** (0.131) 343 Manuf. of parts and accessories for motor vehicles and their engines 0.758*** (0.136) 0.148 (0.163) 351 Building and repairing of ships and boats 0.489*** (0.072) 0.635*** (0.127) 353 Manuf. of aircraft and spacecraft 0.644*** (0.165) 0.033 (0.262) 361 Manuf. of furniture 1.012*** (0.029) -0.051 (0.038) 362 Manuf. of jewellery and related articles 1.143*** (0.088) -0.063 (0.161) 364 Manuf. of sports goods -0.0479 (0.453) 1.570*** (0.531) 365 Manuf. of games and toys 1.135*** (0.235) 0.467 (0.329)
Table A2. The determinants of localization economies; N=75
Variable I II III IV V
Skill specificity 2.272***(0.561) 2.176*** (0.585)
Manufactured inputs per € of sales -0.084(0.359) -0.229 (0.357)
Knowledge intensity -1.066**(0.413) -0.677* (0.400)
Energy and primary sector inputs per € of
sales 0.283 0.358 (0.433) (0.430)
R2 0.183 0.001 0.083 0.006 0.238
Notes: 1) Weighted least squares estimates with weights given by inverse standard errors of βˆloci ; 2) ***, **
and * statistically significant at 1, 5 and 10%.
Table A3. The determinants of urbanization economies; N=75
Variable I II III IV V
Skill specificity -1.620**(0.745) -1.476** (0.733)
Manufactured inputs per € of sales 0.507(0.440) 0.378 (0.447)
Knowledge intensity 1.593***(0.501) 1.307** (0.501)
Energy and primary sector inputs per € of
sales -1.094** -0.992* (0.522) (0.539)
R2 0.061 0.018 0.122 0.057 0.220
Notes: 1) Weighted least squares estimates with weights given by inverse standard errors of i urb
βˆ ; 2) ***, ** and * statistically significant at 1, 5 and 10%.
SÈRIE DE DOCUMENTS DE TREBALL DE LA XREAP
2006
CREAP2006-01
Matas, A. (GEAP); Raymond, J.Ll. (GEAP)
"Economic development and changes in car ownership patterns" (Juny 2006)
CREAP2006-02
Trillas, F. (IEB); Montolio, D. (IEB); Duch, N. (IEB)
"Productive efficiency and regulatory reform: The case of Vehicle Inspection Services" (Setembre 2006)
CREAP2006-03
Bel, G. (PPRE-IREA); Fageda, X. (PPRE-IREA)
"Factors explaining local privatization: A meta-regression analysis" (Octubre 2006)
CREAP2006-04
Fernàndez-Villadangos, L. (PPRE-IREA)
"Are two-part tariffs efficient when consumers plan ahead?: An empirical study" (Octubre 2006)
CREAP2006-05
Artís, M. (AQR-IREA); Ramos, R. (AQR-IREA); Suriñach, J. (AQR-IREA) "Job losses, outsourcing and relocation: Empirical evidence using microdata" (Octubre 2006)
CREAP2006-06
Alcañiz, M. (RISC-IREA); Costa, A.; Guillén, M. (RISC-IREA);Luna, C.; Rovira, C.
"Calculation of the variance in surveys of the economic climate” (Novembre 2006)
CREAP2006-07
Albalate, D. (PPRE-IREA)
"Lowering blood alcohol content levels to save lives: The European Experience” (Desembre 2006)
CREAP2006-08
Garrido, A. (IEB); Arqué, P. (IEB)
“The choice of banking firm: Are the interest rate a significant criteria?” (Desembre 2006)
SÈRIE DE DOCUMENTS DE TREBALL DE LA XREAP
CREAP2006-09
Segarra, A. (GRIT); Teruel-Carrizosa, M. (GRIT)
"Productivity growth and competition in spanish manufacturing firms: What has happened in recent years?”
(Desembre 2006)
CREAP2006-10
Andonova, V.; Díaz-Serrano, Luis. (CREB)
"Political institutions and the development of telecommunications” (Desembre 2006)
CREAP2006-11
Raymond, J.L.(GEAP); Roig, J.L.. (GEAP)
"Capital humano: un análisis comparativo Catalunya-España” (Desembre 2006)
CREAP2006-12
Rodríguez, M.(CREB); Stoyanova, A. (CREB)
"Changes in the demand for private medical insurance following a shift in tax incentives” (Desembre 2006)
CREAP2006-13
Royuela, V. (AQR-IREA); Lambiri, D.;Biagi, B.
"Economía urbana y calidad de vida. Una revisión del estado del conocimiento en España” (Desembre 2006)
CREAP2006-14
Camarero, M.; Carrion-i-Silvestre, J.LL. (AQR-IREA).;Tamarit, C.
"New evidence of the real interest rate parity for OECD countries using panel unit root tests with breaks” (Desembre 2006)
CREAP2006-15
Karanassou, M.; Sala, H. (GEAP).;Snower , D. J.
"The macroeconomics of the labor market: Three fundamental views” (Desembre 2006)
SÈRIE DE DOCUMENTS DE TREBALL DE LA XREAP
2007
XREAP2007-01
Castany, L (AQR-IREA); López-Bazo, E. (AQR-IREA).;Moreno , R. (AQR-IREA) "Decomposing differences in total factor productivity across firm size”
(Març 2007)
XREAP2007-02
Raymond, J. Ll. (GEAP); Roig, J. Ll. (GEAP)
“Una propuesta de evaluación de las externalidades de capital humano en la empresa" (Abril 2007)
XREAP2007-03
Durán, J. M. (IEB); Esteller, A. (IEB)
“An empirical analysis of wealth taxation: Equity vs. Tax compliance” (Juny 2007)
XREAP2007-04
Matas, A. (GEAP); Raymond, J.Ll. (GEAP)
“Cross-section data, disequilibrium situations and estimated coefficients: evidence from car ownership demand”
(Juny 2007)
XREAP2007-05
Jofre-Montseny, J. (IEB); Solé-Ollé, A. (IEB)
“Tax differentials and agglomeration economies in intraregional firm location” (Juny 2007)
XREAP2007-06
Álvarez-Albelo, C. (CREB); Hernández-Martín, R.
“Explaining high economic growth in small tourism countries with a dynamic general equilibrium model” (Juliol 2007)
XREAP2007-07
Duch, N. (IEB); Montolio, D. (IEB); Mediavilla, M.
“Evaluating the impact of public subsidies on a firm’s performance: a quasi-experimental approach” (Juliol 2007)
XREAP2007-08
Segarra-Blasco, A. (GRIT)
“Innovation sources and productivity: a quantile regression analysis” (Octubre 2007)
SÈRIE DE DOCUMENTS DE TREBALL DE LA XREAP
XREAP2007-09
Albalate, D. (PPRE-IREA)
“Shifting death to their Alternatives: The case of Toll Motorways” (Octubre 2007)
XREAP2007-10
Segarra-Blasco, A. (GRIT); Garcia-Quevedo, J. (IEB); Teruel-Carrizosa, M. (GRIT) “Barriers to innovation and public policy in catalonia”
(Novembre 2007)
XREAP2007-11
Bel, G. (PPRE-IREA); Foote, J.
“Comparison of recent toll road concession transactions in the United States and France” (Novembre 2007)
XREAP2007-12
Segarra-Blasco, A. (GRIT);
“Innovation, R&D spillovers and productivity: the role of knowledge-intensive services” (Novembre 2007)
XREAP2007-13
Bermúdez Morata, Ll. (RFA-IREA); Guillén Estany, M. (RFA-IREA), Solé Auró, A. (RFA-IREA) “Impacto de la inmigración sobre la esperanza de vida en salud y en discapacidad de la población española”
(Novembre 2007)
XREAP2007-14
Calaeys, P. (AQR-IREA); Ramos, R. (AQR-IREA), Suriñach, J. (AQR-IREA) “Fiscal sustainability across government tiers”
(Desembre 2007)
XREAP2007-15
Sánchez Hugalbe, A. (IEB)
“Influencia de la inmigración en la elección escolar” (Desembre 2007)