University of Gothenburg
Chalmers University of Technology
Department of Computer Science and Engineering
Alarm management for intrusion detection systems
Prioritizing and presenting alarms from intrusion detection systems.
Master of Science Thesis, Computer Science Programme
SEBASTIAN KLÜFT
EVA LINA STAAF
The Authors grant to Chalmers University of Technology and University of Gothenburg
the non-exclusive right to publish the Work electronically and in a non-commercial
purpose make it accessible on the Internet.
The Authors warrant that they are the authors to the Work, and warrant that the Work does
not contain text, pictures or other material that violates copyright law.
The Authors shall, when transferring the rights of the Work to a third party (for example a
publisher or a company), acknowledge the third party about this agreement. If the Authors
have signed a copyright agreement with a third party regarding the Work, the Authors
warrant hereby that they have obtained any necessary permission from this third party to
let Chalmers University of Technology and University of Gothenburg store the Work
electronically and make it accessible on the Internet.
Alarm management for intrusion detection systems
Prioritizing and presenting alarms from intrusion detection systems.
Sebastian Klüft
Eva Lina Staaf
© Sebastian Klüft, December 2010.
© Eva Lina Staaf, December 2010.
Examiner: Erland Jonsson
Supervisor: Magnus Almgren
University of Gothenburg
Chalmers University of Technology
Department of Computer Science and Engineering
SE-412 96 Göteborg
Sweden
Telephone + 46 (0)31-772 1000
Department of Computer Science and Engineering
Göteborg, Sweden December 2010
Abstract
Intrusion detection systems (IDSs) are important tools helping the network and system administrators to detect intrusions, but have the drawback of many false positives. Due to increasing bandwidth, an IDS must process a vast amount of data, which results in an ever increasing amount of alarms. For a system ad-ministrator to be able to handle the alarms they must be aggregated, correlated and ordered into a manageable form and presented in a way which is easy to overview.
In this thesis we study aggregation, correlation, filtering and ranking as methods for managing alarms from IDSs. We have implemented a ranking functionality in the graphical user interfaceSnorby, a front end to the open source IDSSnort. Each alarm starts with a basic rank of 0 and the user is able to prioritize or down prioritize the alarm by pressing either a ’+’ button or a ’-’ button, thus influencing its current rank. The rank is calculated from several features, i.e. source IP, destination IP, destination port and alarm signature.
Based on our studies we suggest that ranking systems supported by user votes have several advantages. First, they allow the user to dynamically change the way the IDS lists the alarms through a very simple means. Second, it shortens the time required to locate the more important ones, thus reducing the likelihood that a serious attack will be missed.
Keywords: intrusion detection, IDS, correlation, fusion, aggregation, filtering, ranking, alarm management
Sammanfattning
Intr˚angsdetekteringssystem (IDS) ¨ar ett viktigt verktyg som hj¨alper n¨ atverks-och systemadministrat¨orer att uppt¨acka och f¨orebygga intr˚ang, men har en nack-del i m˚anga falsklarm. P˚a grund av den v¨axande bandbredden m˚aste ett IDS bearbeta en stor m¨angd data, vilket resulterar i ett st¨andigt ¨okande antal larm. F¨or att en n¨atverks- eller systemadministrat¨or ska ha en m¨ojlighet att bearbeta detta m˚aste larmen aggregeras, korreleras och ordnas till en hanterbar form och presenteras p˚a ett s¨att som ¨ar l¨att att ta till sig.
I den h¨ar rapporten studerar vi agregering, korrelering, filtrering och rankning som metoder f¨or att hantera alarm fr˚an ett IDS. Vi har implementerat ett rank-ningssystem i det grafiska gr¨anssnittet till Snorby, som ¨ar ett web-gr¨anssnitt till Snort. Varje alarm b¨orjar p˚a rank 0 som anv¨andaren av systemet sedan kan h¨oja eller s¨anka med hj¨alp av tv˚a knappar: ’+’ och ’-’. Varje alarms prio-ritet baseras p˚a fyra egenskaper: k¨all-IP, destinations-IP, destinations-port och alarmsignatur.
Baserat p˚a vad vi har kommit fram till i v˚art arbete kan vi dra slutsatsen att ett system som rankar alarm baserat p˚a hur anv¨andarna r¨ostar har flera f¨ordelar. F¨or det f¨orsta l˚ater det anv¨andaren dynamiskt p˚averka hur IDS:et listar alarmen, genom v¨aldigt enkla medel. F¨or det andra minskas tiden det tar att hitta de viktiga alarmen, och minskar s˚aledes risken f¨or att en allvarlig attack ska f¨orbises.
Preface
First of all, this thesis would not have been possible without our mentor and guiding starMagnus Almgren. We are deeply grateful and awed by the effort you have put into this. The Energizer bunny doesn’t hold a candle to you. We would also like to thank the following people:
H˚akan Nohre, security expert at Cisco, who although being very busy still took the time to answer our questions and giving us an interesting tour through the different intrusion detection systems from Cisco.
Pierre Kleberger for giving us figures of IDS systems and helping us when we had trouble installing BASE.
Emilie Lundin BarseandOla S¨oderstr¨omfor giving us some insights into the world of being an IDS administrator and answering our questions in person. Also an extra thanks to Ola for providing us with some statistics we could use to run our simulations.
Ulf Larson for answering our questions in an entertaining way and giving us a lot of ideas to think about.
Erland JonssonandWolfgang Johnfor attending our presentations, giving critique, and asking relevant questions that helped us find a better focus in our work.
Eva Lina wishes to thank her own little cookie monster, spiritual alka-seltzer and gifted toe stepper, Tomas Olovsson, for not asking too often how this project was coming along and for knowing who Carl Barks is. Also, thanks for enlightening and entertaining conversations and being an all around nice guy.
Contents
List of Definitions 11 1 Introduction 13 1.1 Background . . . 13 1.2 Problem description . . . 14 1.3 Goal . . . 14 1.4 Limitations . . . 14 1.5 Document Organization . . . 142 Intrusion Detection Systems 15 2.1 General Overview . . . 15 2.1.1 Placement . . . 16 2.1.2 Detection Schemes . . . 19 2.1.3 Key Concepts . . . 20 2.1.4 Motivation . . . 21 2.2 Available systems . . . 21 2.2.1 Snort . . . 22 2.2.2 BASE . . . 23 2.2.3 Snorby . . . 24 2.2.4 Cisco MARS . . . 26 3 Previous Work 27 3.1 Aggregation . . . 27 3.2 Correlation . . . 28 3.2.1 Using conditions . . . 29 3.2.2 Using probabilities . . . 30
3.3 Finding the normal . . . 30
3.4 Ranking . . . 31
3.5 User input . . . 33
4 Methodology 35 4.1 How to implement ranking . . . 36
4.2 Time based weighing of votes . . . 38
4.3 Implementation of whole system . . . 41
4.3.1 Snort database structure . . . 42
4.3.2 How votes are counted . . . 44
4.3.3 Ruby on Rails . . . 45
CONTENTS
4.3.5 Displaying the alarms . . . 49
5 Simulations 51 5.1 Alarm generation . . . 51 5.2 Simulating clicks . . . 52 5.3 Details of configuration . . . 53 6 Results 57 6.1 Simulations . . . 57 6.1.1 Density . . . 58 6.1.2 Ordering . . . 60 6.2 Snorby . . . 63 7 Discussion 67 7.1 Ranking system . . . 67
7.1.1 Issues outside of the system . . . 68
8 Future Work and Conclusions 69 8.1 Future Work . . . 69 8.2 Conclusions . . . 70 Bibliography 72 A Box Plots 77 B Specification of Requirements 79 C Source Code 81 C.1 click test . . . 81 D Interviews – Q&A 87 D.1 H˚akan Nohre . . . 87 D.2 Ola S¨oderstr¨om . . . 89
D.3 Emilie Lundin Barse . . . 100
List of Figures
2.1 Architecture of a generic IDS [25]. . . 16
2.2 Architecture of a NIDS. . . 17
2.3 Architecture of a HIDS. . . 18
2.4 Architecture of a DIDS. . . 18
2.5 BASE home screen. . . 24
2.6 Snorby . . . 25
3.1 The Bayesian network used when calculating the final rank score for alarms in the M-correlator by Porras et al. [30]. . . 33
4.1 Conceptual design of check boxes for interaction with the ranking system. . . 37
4.2 The thumbs up button and the thumbs down button to press for liking respectively disliking a video on YouTube. . . 37
4.3 Final design of buttons for negative and positive feedback. “+” is for positive and “-” is for negative. . . 38
4.4 Figure illustrating how voting measurements can fluctuate over time. . . 39
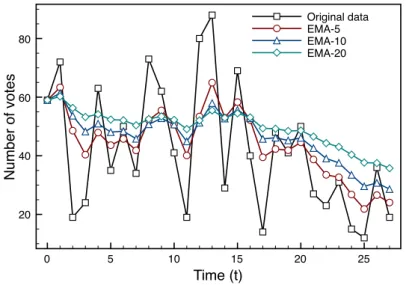
4.5 Plotted curves showing the effect of using different smoothing factors. . . 40
4.6 Figure showing how fast previous observations lose their influence in the EMA formula with three different weights. X-axis is the number of time periods since the observation occurred, and the Y-axis is the influence in percent that the observation has over the EMA value. . . 42
4.7 The Snorby database structure. This figure does not show the whole database structure, but only the parts that are affected by our implementation of the ranking model. Items marked in red indicate tables and values added to the already existing database structure. . . 43
4.8 The event view in Snorby showing events fetched from the Snort database sorted in the order they where captured. . . 48
5.1 An example showing how the score for an alarm is calculated. . . 53
6.1 Density of all ten test runs and the average after ranking. . . 59
6.2 Density of all ten test runs and the average before ranking. . . . 60
LIST OF FIGURES
6.4 Ordering of alarms of test run four. . . 61
6.5 Ordering of alarms of test run seven. . . 62
6.6 Intervals of the twelve most important alarms. . . 63
6.7 Unmodified version of Snorby displaying the event view. . . 64
6.9 Three links that allow the user to choose how alarms should be sorted. . . 64
6.8 The buttons that where added to the Snorby interface. . . 64
List of Tables
6.1 Number of important alarms generated each test run. . . 57 6.2 The IPs and alarm types chosen as important. Whenever an
alarm shows up carrying any of these attributes, it gets a simu-lated click. . . 57 6.3 Density of important alarms listed afteripositions. . . 59
List of Definitions
Definition 1. Aggregation is the process of grouping alarms together based on certain user-defined criteria found in alarms. (p. 27)
Definition 2. Correlationis the process of building data models from alarms using external knowledge not found within the information carried by the alarms themselves. (p. 28)
Definition 3. An important alarm, also referred to as a clicked alarm, is an alarm with attributes of interest to the user. When the user spots this alarm, she is surmised to click on it, showing her interest. (p. 58)
Definition 4. Anunimportant alarm, sometimes referred to as anunclicked
alarm, is an alarm lacking attributes of interest to the user. When the user
spots this alarm, she is surmised to leave it unclicked, showing her disinterest.
(p. 58)
Definition 5. The density D(i), of ranked alarm position i, is the ratio of important alarms found at positions 1 up to i compared to the total number of alarms found at positions 1 up toi, wherei≤ position of last listed important alarm.
(p. 58)
D(i) =# important alarms at positions1 to i # alarms at positions1 to i
Definition 6. Collateral ranking is the act of awarding unimportant at-tributes with higher rank due to their association with important atat-tributes. That is, unimportant attributes get points by simply being present in the same alarms as important attributes. (p. 67)
Chapter 1
Introduction
1.1
Background
Since 1966, the syrupy sweet song “It’s a small world after all” have been sung over and over again in the Disney theme parks by the little dolls in the attraction bearing the same name as the song [33]. This sentiment is truer today than ever. The birth of Internet has let us bridge physical distance with the click of a button. Whether you live in Australia, South Africa or the UK makes little difference, as with the click of a button millions of computers can be attacked and infected by malware. By the same notion that the world is getting smaller it is also growing; unfathomable proportions of information is being pumped into networks connected to the Internet. Individuals, companies, organizations and governments store their lives, financial records, data and secret documents on social communities and databases.
Much has happened in the world of malware since the Morris worm in 1988 [17]. Where Morris operated out of curiosity there are now multi-million dollar opera-tions organized by criminal networks all over the world. Tools for attacking and penetrating networks are easily bought over the Internet. The “small world” we now live in and the illegal industry dealing in malware and hacking tools all make it dangerous to simply connect a network cable to your computer. As a publicly available company or a public authority, a connection to the Inter-net is mandatory and crucial. If you cannot be found on the InterInter-net you might as well not exist and without an Internet connection, how are your employees supposed to do their jobs? But a way out is also a way in. Traditional antivirus programs and firewalls are only able to detect and remove files containing code associated with malware and manage incoming and outgoing network communi-cations respectively. There is no way for either of them to discover e.g. password guessing since the activity in itself is neither concerned with malicious code nor network communications.
What is needed is something auditing the system with a holistic perspective. That something is an intrusion detection system (IDS).
1.2. PROBLEM DESCRIPTION
1.2
Problem description
For an intrusion detection system (IDS) to properly perform its task, it has to process a huge amount of information from firewalls, logs and audit records. The detection rules of the IDS will only single out a small part of the daily events as suspicious and raise an alarm, but a small part of a huge amount may still be a lot. As attacks in general are meant to go undetected, attackers try their best to masquerade their appearance. To accommodate this, the detection rules are defined in a slightly vague fashion. Unfortunately this vagueness increases the chance of legitimate actions being labeled as suspicious, a prevailing problem known asfalse positives.
In many current IDSs, it is the operator that must manually distinguish between true and false positives.1 The fact that false positives easily outnumber the true alarms does not, in general, make the operator any happier. Finding the real threats can be the equivalence of finding a needle in a haystack.
1.3
Goal
To investigate the problem described in 1.2 and to see what can be done about it we intend to:
1. study current methods for reducing the number of alarms. 2. improve and implement one of these methods in an available IDS.
1.4
Limitations
This thesis is not an evaluation of IDSs and their effectiveness, nor is it about how to detect suspicious activities in a host or network. The method survey is not a complete or exhaustive survey and the chosen reports should be viewed as representatives of their respective areas.
1.5
Document Organization
Chapter 2 presents a general overview of the workings of an IDS, as well as a presentation of the IDS Snort and two of its most common interfaces, BASE and Snorby.
Chapter 3presents a limited survey of methods used for prioritizing and re-ducing alarms.
Chapter 4presents the methodology behind our work.
Chapter 5presents our findings and conclusions.
Chapter 2
Intrusion Detection
Systems
This chapter describes Intrusion Detection Systems (IDSs), how they work in general and a brief overview of systems available today.
2.1
General Overview
An IDS is similar to an antivirus program scanning files for malicious code. But where the traditional antivirus program only scans the content of a file the IDS parses and interprets network traffic and/or host activities. An IDS can use data collected from network packet analysis, logs from routers, firewalls, servers, local systems and system calls to mention a few [1]. Just like the antivirus program an IDS has a set of rules or a database containing known attack signatures. The IDS compares the signatures against patterns of activity, traffic or behaviour deduced from the data and issues an alarm when the pattern or behaviour is a close match. Besides from just issuing an alarm an IDS may in some cases also take active countermeasures such as shutting down Internet links, launch back-traces or make other attempts to identify the attacker and gather evidence. Specifically, an IDS detects unauthorized use of or attacks on a system or network. An IDS can, just like a firewall, either be software-based or hardware-based.
Figure 2.1 shows an overview of a generic IDS.Target system refers to where the sensor is situated, i.e. a router or an ordinary host. Sensor is a piece of software responsible for collecting data for the IDS. The data can originate from a multitude of sources each with its own format. Thepre-processoris responsible for weeding out the data required for analysis and transforming it into a format that can be understood by the IDS. The analysis enginevets the data against the rules and policies to determine whether it is benign or malicious. Post-processing involves correlation of alarms, or construction of attack scenarios, or collection of alarms from other analysis engines. The response unit decides for each alarm if the reaction to it should be active or passive [25]. A passive
2.1. GENERAL OVERVIEW
Figure 2.1: Architecture of a generic IDS [25].
response includes generation of alarms or log entries but other than that it does not interfere with the traffic in any way. An active response on the other hand, may reset the TCP connections in order to disrupt communications, simply drop traffic if the IDS is inline, add the malicious host to blocking lists, or in any other way disturb the attacker [1].
The typical IDS will not prevent an attack, its function is to detect and alert. However, some IDSs do have this attack-preventing feature and are called IPSs, intrusion prevention systems. But they are a minority, the typical IDS should be viewed as a complement to a firewall, antivirus software, and such and not as a replacement.
2.1.1
Placement
There are generally three different kinds of IDS,
• Network-based IDSs (NIDSs), monitors network links and backbones look-ing for attack signatures.
• Host-based IDSs (HIDSs), monitors the operating system and file system for signs of intrusion.
• Distributed IDSs (DIDSs), a number of IDSs used as remote sensors re-porting to some kind of central management system.
There are also IDSs specifically dedicated to gateways monitoring the traffic passing in and out of the home network and IDSs dedicated to application-specific traffic understanding the flow of the application logic and the underlying protocols.
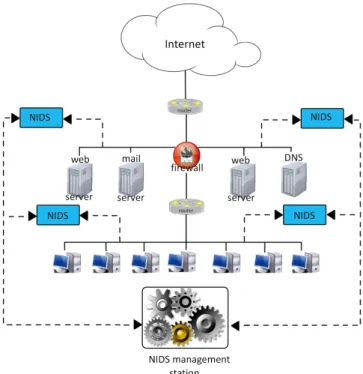
NIDS (Network-based IDS)A NIDS is an IDS that can monitor an entire segment of the network (see figure on page 17). It is placed on (an) appropriate
CHAPTER 2. INTRUSION DETECTION SYSTEMS
Figure 2.2: Architecture of a NIDS.
segment(s) of the network. All traffic seen by the network interface card (NIC) is passed on to the IDS. The advantages of a NIDS is the fact that it does not affect either the systems of the network or the network itself since it just passively records any traffic seen by the NIC. One disadvantage is that it only sees the traffic by its NIC. Packets taking a different route through the network will be missed. Therefore, a NIDS does not always see the whole picture.
HIDS (Host-based IDS)A HIDS protects only the host on which it is situated (see figure on page 18). Due to its location it has access to other types of data than just network information, including local information such as system calls, file system modifications, and system logs. A plus with the HIDS is the fact that it is possible to adapt the ruleset in great detail for each host. The ruleset only has to deal with the services specific for that host. A NIDS must have rulesets to deal with everything since it will see everything in traffic on the network. The fine tailored ruleset for HIDS reduces processor overhead and enhances performance for each host. The drawback of a HIDS is the fact that it steals computing power from its host, unlike a NIDS.
DIDS (Distributed IDS)The standard DIDS is part of a manager/probe ar-chitecture (see figure on page 18). NIDS and/or HIDS sensors placed throughout the network report to a centralized management station which compiles the re-ports. Attack logs can be uploaded and new attack signatures downloaded from the central management to the sensors as needed. The benefit of a DIDS is the holistic view it presents supplementing the NIDS, unaware of the state of hosts, and the HIDS, unaware of the state of the network. Since all systems have their drawbacks, so has also this one. The DIDS uses the internal network to com-municate with the centralized management, and if the network is incapacitated, so is the holistic view.
2.1. GENERAL OVERVIEW
Figure 2.3: Architecture of a HIDS.
CHAPTER 2. INTRUSION DETECTION SYSTEMS
2.1.2
Detection Schemes
There are two different approaches an IDS can take when deciding if an event should be reported as an alarm or not,anomaly detectionand misuse de-tection.
Anomaly detection, also known as statistical detection, strives to define nor-mal, expected behaviour [35]. It is based on the idea that attacks and intruders displays different behaviour than the normal legitimate user. E.g. a trojan set-ting up a high number of connections where the normal user would yield only a handful of connections will result in an alarm [24]. To be able to decide what actions are anomalous a baseline of normality for user behaviour and sys-tem activity has to be established. The baseline is either predefined by the system developers or constructed using statistical sampling, specification-based approaches or neural networks [1]. Recording and deciding normal behaviour is a complicated process. It is hard to exhaustively define normal behaviour since it is dynamic and changes over time. Homogeneous systems with a moderate number of users where the same actions are performed repeatedly are much more readily described than a heterogeneous system with maybe thousands of users, say a university network. It is also hard deciding what is an anomaly and what is a minor deviation in the behaviour of the user. To partly compensate for this uncertainty, the decision function works with intervals and boundary values. The behaviour is allowed to slide a bit from the expected value without triggering alarms. When an alarm is triggered, the alarm is accompanied by a certainty value depending on how far off the behaviour is. This helps when quickly deciding if an event should be considered as to be a true or false positive, although caution should be exerted. Inappropriately set threshold values are a potential disaster. Set too high and attacks are be missed, set too low and the level of false positives skyrockets.
Policing all activities is a costly endeavour since the extensive logging needed by the system to perform has a significant impact on the performance of the host. This makes anomaly detection less suitable for real-time systems [1]. Anomaly detection has its benefits and drawbacks. Anomalous behaviour does not have to be an indication of an attack, the explanation for the altered be-haviour could be as simple as new assignments for the user or a new service on the network. This results in costlyfalse positiveswhich have to be examined [24]. But this weakness is also the strength of anomaly detection. Although unaware of the ways of novel attacks an anomaly detecting IDS is still able to produce alarms for the novel attacks - as long as the attacks results in a system behaviour different from the normal. Unfortunately this is not the only obstacle to be conquered. When choosing the parameters to build the baseline, one has to make a correct selection of parameters and not choose too few or too many. Too few will result in an incomplete model missing attacks and too many will unnecessarily burden the host system.
Misuse detection, also known as signature-based detection or rule-based de-tection, strives to define improper behaviour [35]. It follows the same principles as an antivirus program. Patterns of misuse called attack signatures are stored in a database and the audited area, may it be log files or network traffic, is
2.1. GENERAL OVERVIEW
vetted against these and any match will result in an alarm. A signature can be i.e. a string to search for in packets or a sequence of actions. Intrusion schemes are, just like malware, ever changing; the signatures must therefore be constantly updated as not to miss any attack. Most IDSs adhere to the misuse principle [24].
This method has both advantages and disadvantages if compared with anomaly detection. Where misuse detection cannot catch novel attacks, anomaly detec-tion can. Where anomaly detecdetec-tion can never be quite certain of an intrusion, misuse detection can. Misuse detection suffers from similar definition problems as anomaly detection. The problem with attack signatures is how to define them and still be able to catch all misdeeds without causing false positives to trigger off on normal traffic.
To summarize; an IDS can adhere to a known-good (anomaly detection) or a known-bad (misuse detection) policy [1]. Known-good has configuration files with the acceptable behaviour explicitly stated. All else yields alarms. Known-bad is much simpler since it does not require a comprehensive model of al-lowed input. Known-bad trigger alarms only on traffic that is known to be bad. Known-bad and known-good both have drawbacks and benefits. Known-bad is easier on the processors, alerting only when something matches a rule. Unfor-tunately it can only alert on what is stated in the rules. Anything else sails through. Known-good has the benefit of being able to alert on novel attacks as long as they yield a behaviour deviating from the configured acceptable be-haviour. The drawback of known-good is the impossible task of modelling all behaviour that is acceptable which results in many false positives. On top of that, it is completely normal for a user’s behaviour to change over time. Also if the system is able to cope with a slowly changing behaviour, who is to say an intruder would not slowly accustom the system to a behaviour which would mask the planned intrusion? Most IDSs use a combination of the two.
2.1.3
Key Concepts
Atrue positiveis an alarm correctly indicating an attack. Atrue negativeis an event correctly classified as benign.
Afalse positiveis an alarm issued for a benign event mistaken for an attack. This is not uncommon in an anomaly detection system where all events not explicitly marked as approved issues an alarm [24]. Misuse detection is also plagued by erroneous alarms, the cause being badly written detection rules or benign traffic sporting a high similarity to malicious traffic [16]. Buggy software and badly configured hardware adds to the load for both systems, effectively drowning the true positives. This is a big problem today [3], and a lot of research and effort goes into finding a way to minimize the effects false positives have on an operator’s work situation and the system dealing with alarms.
A high level of false positives is normal for “young” IDSs and drops off with the tweaking of the system over time [1].
Afalse negativeis an attack the system fails to detect and is much more seri-ous than a false positive [24]. Whereas false positives may obscure the view, the
CHAPTER 2. INTRUSION DETECTION SYSTEMS
true positives are still there, are still logged and retrievable from the database. An undetected attack is not logged anywhere and thus when and if the intru-sion is detected there is no way of knowing for how long the system has been compromised, what data to trust, which backup is clean or how much havoc has been wreaked.
2.1.4
Motivation
So why bother having an IDS as it seems like a lot of headache? E.g. say a company one day discovers that someone has gained unauthorized access to their database. If they have no IDS, how can they know if they can trust their data? Find out when the breach happened? And if any of the backups can be trusted?
An IDS, hopefully, grants the ability to discover reconnaissance attempts, at-tempted system compromise or other malicious activity and this can mean the difference between being compromised or not. If no one is aware of the attacker trying to break into the system, how can she be stopped? With an IDS able to warn the administrator of a successful attack, the administrator can take measures to limit the damage or take the system offline to examine the extent of the breach.
Another reason to have an IDS is its data mining properties helping the adminis-trator finding subtle trends in large amount of data, which would be impossible for a human to find unaided. Correlation between alarms and hosts helps the administrator to see patterns otherwise hidden.
No matter how big a help the IDS is, skilled analysts will always be needed to sift through the alarms the system produces. They have to be able to separate the real alarms from false positives. No matter how much the system learns, it will never be able to assess the level of a threat like a skilled and experienced analyst knowing her network.
2.2
Available systems
There are a great many IDS, IPS, and GUI available today from many different software companies. Many are commercial systems targeted at consumers and their home computers such as antivirus and firewall applications offered by Symantec, ESET and others. The systems that we are interested in in this thesis are however not targeted at home computers. They are designed to handle loads much greater than what a home computer ever will encounter, and require knowledge that most people do not have. During the course of our work we have studied a few of them, and most of them are open-source systems as we do not have the funds to buy any licenses.
2.2. AVAILABLE SYSTEMS
2.2.1
Snort
Snort [34] is an open source network intrusion detection and prevention system now developed by Sourcefire and was originally released in 1998 [31]. It has three modes of operation. Packet sniffer mode reads packet headers and displays them on the console. Packet logger mode will log received packets to a file. Network intrusion detection mode will analyse incoming packets and detect intrusion attempts. Snort analyses network traffic with the help of predefined rules containing detailed descriptions of what kind of traffic should be considered harmful to the network. In other words it uses the misuse-based paradigm. These rules may also contain actions to be taken when a specific attack is detected. Appropriate actions can be to log the alarm to a database, send an email to an administrator or terminate the offending connection. With the help of these rules Snort looks at all parts of incoming network packets (header and payload) to determine whether each individual packet should be considered malicious or not. If a packet is considered malicious the appropriate action for that type of alarm will be taken.
The alarms that are captured by Snort are by no means guaranteed to be actual attacks or intrusion attempts made by an adversary. Snort is only designed to recognise possible attempted attacks on the network. This means it is essentially just a dumb sensor filtering out traffic matching a set of predefined rules. In turn this means that there is a relatively high chance that a majority of the alarms are going to be false positives (depending on how large a target for attacks the network is). The hard work then of analyzing the alarms and see the correlation between different alarms is left entirely to the operator to handle.
Snort sensors are most commonly placed in front of the firewall protecting the local network so they can capture the unfiltered traffic coming from the Internet. Figure 2.2 on page 17 is a good example of such a sensor placement. If the local network is very big and divided into subnets it might be a good idea to also place Snort sensors at the border of those subnets. Placing more than one Snort sensor in the network can help tracking the attack as it progresses in the network. An attack most commonly start with someone attempting to penetrate the outer defences (firewalls), if this succeeds they might attempt to infect a computer on the inside. If the computer is successfully infected it will become their bridge into the network. Therefore it would be good to have more sensors inside the network to monitor traffic between computers. The Snort sensor at the border to the internet will only be able to see incoming and outgoing traffic and not traffic moving between the hosts of the internal network.
Preprocessors
Preprocessors are plug-ins which can be used with Snort to rearrange or modify incoming packets before they reach the filtering engine. The Snort preprocessors generally fall into two categories. They can be used to either examine packets for suspicious activity or modify packets so the detection engine can properly interpret them. An “examining” preprocessor has the ability to detect non-signature-based attacks that the detection engine cannot track down. Such
CHAPTER 2. INTRUSION DETECTION SYSTEMS
attacks include port-scans where a state has to be saved between many different connections to determine whether there is a port-scan occurring.
The second kind of preprocessor normalizes incoming traffic so the detection engine will be able to properly detect attacks. Incoming packets can for example be fragmented because the original packet was too large. This creates a problem for the detection engine since the harmful part of the package might be split into two different packets, which results in the detection engine failing to trigger an alarm. Preprocessors are here to mend this situation by stitching the two fragmented packets together again. Packet fragmentation usually happens when packets travel between different types of networks. I.e. if a packet travels into an Ethernet network and is larger than the MTU (Maximum Transmission Unit) for that network the packet will be split into two or more packets to be reassembled when it reaches its destination.
Rules
Snort rules are divided into two logical sections, the rule header and the rule options. The header contains the rule’s action, protocol, source and destination IP addresses and netmasks, and the source and destination ports information. The rule option section contains alarm messages and information on which parts of the packet should be inspected to determine if the rule action should be taken. Actions that can be taken include logging the activity, dropping the packet all together, reject it (with TCP, RST or ICMP port unreachable), and pass (ignore the packet).
1 a l e r t tcp any any - > 1 9 2 . 1 6 8 . 1 . 0 / 24 111 \
2 ( c o n t e n t : " | 0 0 01 86 a5 |"; msg :" m o u n t d a c c e s s ";)
Listing 2.1: Example Snort rule
Listing 2.1 defines a rule to generate an alarm if there is traffic coming from any ip or port to a local address 192.168.1.0/24 on port 111 with a payload containing the binary data “00 01 86 a5”. The binary sequence “00 01 86 a5” can be located anywhere within the payload for a match to occur. When that happens an alarm will be logged with the message “mountd access”. Backslash is used to divide the rule onto multiple rows, the default interpretation is otherwise one row one rule.
2.2.2
BASE
BASE [15] stands for Basic Analysis and Security Engine and is designed to read and display the logged alarms Snort has generated. Alarms are displayed to the user via a web interface written in PHP.
Figure 2.5 gives a statistical overview of what has been logged by the differ-ent sensors such as the distribution of differdiffer-ent protocols of the logged alarms. There are also links to the most common views that an administrator will be interested in keeping an eye on, e.g. most recent alarms and most common alarms. The views can be further specialised by using the search function where
2.2. AVAILABLE SYSTEMS
Figure 2.5: BASE home screen.
the administrator can be more precise about what he/she is looking for in the database.
BASE also gives the user the capability to add alarms to groups making it easier for the user to spot trends in the incoming alarms. Adding alarms to groups is an entirely manual process. Alarms that have been placed in a group can then be viewed in a special tab of their own.
To give the user a better overview of the most recent attacks, BASE generates graphs using statistics Snort has gathered. The user controls what is displayed in the graph via comprehensive controls. Simple graphs, such as number of attacks over time can be generated as well as more in-depth graphs only displaying statistics for a single host or port.
2.2.3
Snorby
Snorby [27] (Figure 2.6) is, like BASE, a web-interface for Snort and has many of the same features. It is developed using Ruby on Rails [38] and uses many of the modern web development techniques available today, such as Ajax and Flash. The main difference to BASE is that Snorby is built with collaboration between users in mind. All users have two main collaboration tools at their disposal, marking events with a star and leaving comments.
Marking events with a star is similar to placing a bookmark. The user simply clicks on the star icon associated with that particular event to mark it. Starred events are gathered in a separate list common to all users, meaning if one user stars an event everyone else will be able to see it as well. This promotes col-laboration in that all users can work together to find interesting or important
CHAPTER 2. INTRUSION DETECTION SYSTEMS
2.2. AVAILABLE SYSTEMS
events and investigate these further. This also works well with the other collab-oration tool in Snorby, the commentary system. When starring an event, the user can leave a comment explaining why that particular event is of interest or need further investigation. At a later time, when an administrator logs on to the system she can view those starred alarms, read the comments, review them, and take an appropriate action.
Snorby also has the ability to generate automated reports that are mailed to the system administrator. These reports contain summary statistics about what kind of alarms the Snort sensor has generated the previous week as well as more in-depth information about important alarms.
2.2.4
Cisco MARS
MARS [4] stands for Monitoring, Analysis, and Response System, and is a network security suite developed by Cisco. In contrast to Snort, BASE, and Snorby this system costs money to buy and install in a network. But it also has much more to offer than the previous systems. MARS is more than just a network sensor that looks for malicious traffic on the network. It is more like a command central for all systems that have a security role in the network, such as firewalls, network sensors, antivirus programs, and much more. It combines information from many different sources into one interface that is easier to overview, and more than that it also correlates the collected information. By correlating the information, MARS can detect chains of events that are re-lated to each other across all the different sensors. If an attacker starts attacking a computer and tries to gain root access this can potentially be detected in a number of different places. The attacker might try to exploit a vulnerability on a mail server, which is visible from outside the network. Before the attack reaches the mail server it has to pass the firewall and probably a network sensor similar to Snort. If it gets past the first firewall, the mail server itself might have a firewall of its own. Lastly the mail server will have a system log that stores messages about local events, i.e. if someone tries to login on the computer a log message will be created. MARS is fed all this information from all these different sources and correlates them into a form more easily overviewed. The operator can then see exactly what has happened from start to finish in the attack, and even if it succeeded or not. MARS will also try to give suggestions about where the attack can be mitigated most effectively so it does not happen again.
Cisco MARS also has the ability to collaborate with other similar MARS systems that are deployed around the world. Useful information about attacks are shared between these to help detect new and unknown attacks. For example, blacklists used to block spam mail are also used to detect suspicious incoming traffic. Traffic sent from a computer known to be a spammer gets logged and reported to an operator automatically. This can be useful to know as much of the spam mail sent today are sent from bot nets operated by criminals. Knowing if such traffic suddenly increases might give an early warning that something bad is about to happen and counter measures can be deployed in time.
Chapter 3
Previous Work
This chapter presents different methods helping the operator of an IDS handle the amount of alarms produced, with a focus on false positives.
The algorithms behind the methods presented below are nothing new and have been used within research since the 80s. One can follow how the area matures in the literature through the decades. The same methods used to find anomalies [36, 10, 22, 14, 11, 32, 21, 20] and detect misuse [36, 13, 23, 19, 37, 18] are used today to form more abstract higher level alarms out of specific lower level alarms.
Reducing the amount of data is not a novel idea either [12]. Focus has shifted though with the growing hardware capacities, from reducing the amount of data for the benefit of the system to the benefit of the operator. Frank [12] also breathes the hope that with good enough rules, systems and/or training examples, false positives and false negatives can be brought down to a minimum. This hope is rebutted by Axelsson [3] where he makes calculations on the base-rate fallacy and points out the consequence, that false alarms are something we will probably never get rid of as the false alarm rate will have to be impossibly low for that to happen. This seems to be a generally accepted truth and the way to reduce false positives today is to apply the methods presented below thus hopefully minimizing the effect from false positives.
3.1
Aggregation
The meaning of aggregation varies greatly between reports and we therefore feel the need to define the word ourselves.
Definition 1. Aggregation is the process of grouping alarms together based on certain user-defined criteria found in alarms.
Alarms can be aggregated based on any attributes found in alarms such as: destination IP, alarm type, content of data portion.
3.2. CORRELATION
Of the methods presented in this chapter, aggregation is the most low level and straight forward of them all. Hence, it is not common in the literature to focus solely on aggregation. Aggregation is now more of a ubiquitous step in any scheme processing alarms.
Debar and Wespi are among the few still explicitly mentioning aggregation even though very little attention is given to it, mainly focusing on correlation [9]. They describe how to aggregate and correlate alarms with the ACC – aggrega-tion and correlaaggrega-tion component. The task of which is to present a condensed view of the input received from multiple sensors and ACCs. Incoming events are processed by extracting common information and finding a match in pre-vious observations. Correlation relationships are then formed by looking for
duplicatesandconsequences.
A duplicate is an alarm whose cause have already been taken into account by the ACC algorithm. How alarms are judged to be duplicates is specified in a configuration file. A consequence is an alarm that under some conditions gives reason to expect others to follow. For a following alarm to be considered a part of the consequence chain it must occur within a given interval of its predecessor. As with duplicates, consequence chains are declared in a configuration file. Lastly, the correlated alarms are aggregated intosituations, where alarms have certain characteristics in common. This step is performed since isolated events are often considered insignificant. A situation is defined by four terms: alarms class, source, target and severity level. The user is presented the situations
which are fewer in number than the original unprocessed alarms.
3.2
Correlation
Aggregation of alarms still leaves a lot of alarms to be inspected and further methods have been explored to crop the number of alarms presented to the user. The term correlation is used for a variety of methods to compress the number of alarms displayed for the user. To eliminate ambiguity we again feel the need to make a definition.
Definition 2. Correlationis the process of building data models from alarms using external knowledge not found within the information carried by the alarms themselves.
External knowledge might be such as how alarms appear together, or the im-pact attacks have on the network. The idea is that correlation will suppress the impact of false positives by lifting the alarms to a higher level of reason and putting them into context. False positives are marginalized and the true positives are put into focus.
In this chapter, two methods of correlation are presented, correlation using
CHAPTER 3. PREVIOUS WORK
3.2.1
Using conditions
Correlation using conditions continues the chain of thought presented by Debar and Wespi [9] for aggregation, some alarms areconsequencesof others. The idea is that most intrusions are not isolated and are part of a chain of actions where earlier actions are preparing for later. Each alarm is associated with a set of pre-conditions to be fulfilled for the attack to succeed, and a set of post-conditions describing the aftermath of the attack, if succeeded. Attack chains are formed by connecting the pre-conditions of one alarm with the post-conditions of one or several other alarms. The attack chains are meant to 1) result in fewer items for the operator to inspect and 2) remove false positives since they do not belong to any attack chain.
As with the definitions of aggregation and correlation, there is no consensus regarding denomination. Ning et al. [28] have developed a framework using
prerequisitesandconsequencesas opposed to pre- and post- conditions. The alarms and their connections are modelled onto graphs where nodes corresponds to alarms and edges represents the relationships between them. If an alarm has been decided to prepare for another, they are connected by an edge.
The resulting chains are intended to be analyzed by human users to understand the correlated alarms as well as the strategies behind them. But the graphs can get fairly big due to the amount of alarms. For a user to be able to manage the graphs they have to be cropped. Ning et al. propose filtering out irrelevant alarms and aggregating alarms of the same type as means. Here, aggregation shows up as a vital part of the process without being given the same focus as in Debar and Wespi [9].
Cuppens et al. [6] have developed something similar to Ning et al. [28] but do not use graphs as a means to model alarms and relationships. As part of the project MIRADOR, CRIM was developed as a cooperative module for IDSs. It manages, clusters (groups alarms into sets corresponding to the same occurrence of an attack), merges (creates a new alarm that is representative of the information contained in the various alarms belonging to this cluster) and correlates alarms.
Since an intruder, most likely, has to carry out several attacks in a certain order to reach his goals, Cuppens et al. defines the task of the correlation function as anticipating the intrusion plan. A set of candidate plans of the current intrusion is returned by the function. The plans are denominated candidate since the intruder might not have reached his goal yet. The result is used by the reaction function to help the operator take the best course of actions against the intruder.
When an alarm is received, the database is checked to see if the pre- conditions of the new alarm can be linked to any post-conditions of stored alarms. If it can, the correlation conditions are checked. An algorithm is then applied to the pair to see if it might be merged into an existing attack scenario, if not a new is started.
Another variation of this theme is therequires/provides model by Zhou et al. [39]. Whereas CRIM by Cuppens et al. [6] and the model suggested by
3.3. FINDING THE NORMAL
Ning et al. [28] use predicates to describe the state of the network, Zhou’s model is based on capabilities which describe what the attacker can access on the network. Inference rules are drawn between the capabilities, and if all capabilities ofrequires(cf. pre-conditions of Cuppens et al. and prerequisites of Ning et al.) can be inferred from the capabilities of provides (cf. post-conditions of Cuppens et al. and consequences of Ning et al.) the two alarms are correlated.
3.2.2
Using probabilities
The use of conditions for correlation, see previous section of Ning et al. [28], Cuppens et al. [6] and Zhou et al. [39], is a black and white procedure. Either all of the conditions for correlation are fulfilled and the alarms are correlated, or it fails. Correlation using probabilities adopts a grayer view of the correlation process. Instead of all or nothing, the probability of an alarm being correlated to another is calculated. That probability is then used when deciding if the alarms belong together.
Dain and Cunningham [8] have developed an algorithm for fusing and combining alarms intoscenarios. A scenario is described as a sequence of alarms grouped together as they share a common cause. Whole scenarios are labeled as false instead of individual alarms thus simplifying for the operator. Each new alarm is compared to the existing scenarios using data mining techniques and the probability of the alarm belonging to that scenario is calculated. The alarm is then added to the most likely candidate, the scenario yielding the highest probability. If none exists a new one is created.
The most flexible way to fuse an alarm into a scenario would be to consider all possible ways of combining each new alarm with all previously collected, recal-culating for each alarm how the biggest scenarios can be formed. This would quickly become computationally infeasible. Obviously, this is not possible. In-stead an atom model is proposed. The new alarm is compared to all so far constructed scenarios and merged with the one returning the highest probability of correlation. If all scenarios return a probability lower than a preconfigured threshold, the alarm joins a new scenario. Once assigned a scenario the alarm is not reconsidered or reassigned, hence the term, atom model. This procedure might generate errors but greatly simplifies deciding how to assign alarms.
3.3
Finding the normal
Up to 90% of all alarms have benign causes such as misconfigured hardware and buggy software [16]. By “finding the normal” we refer to the process of finding the alarms caused by benign events. To be able to identify and remove these before applying the correlation methods mentioned in previous section holds a lot of promise. The amount of data that is processed by the models is significantly decreased, as well as the data presented to the user.
A very straight forward method is applied by Gengo and Clifton [5]. By us-ing a data minus-ing technique called frequent episodes, common and recurrus-ing
CHAPTER 3. PREVIOUS WORK
sequences of alarms for a given site are identified. These are then manually an-alyzed to see whether they result from normal operations. With the help from these alarms, site-specific filters can be constructed which may help reducing the amount of alarms presented to the administrator.
Julisch [16] is of the same idea as Gengo and Clifton but attacks the problem from a higher level of abstraction. Alarms are grouped in clusters and for each cluster a meta-alarm, a generalized alarm, is derived. A generalized alarm is a pattern which the alarm created by the IDS must match in order to belong to that cluster.
Julisch focuses on bringing alarms into clusters where each cluster represents theroot causebehind the alarms. A root cause is defined as a “problem that affects components and cause them to trigger alarms”.
To be able to generalize alarms a single rooted and connected directed acyclic graph (DAG) called a generalization hierarchy is constructed over each attribute, of the alarm. Each parent node in the graph is a more generalized attribute than any of its children nodes. To generalize an alarm, its attributes are located in the DAG. The attributes of the alarm are then replaced by the parents. The problem with DAGs is that there might be more than one parent to a node. When generalizing alarms one can face problems when there is more than one choice. Julisch proposes two strategies to resolve this:
• choose-one- user-defined rules decides which parent to choose.
• explore-all - pursues all possible generalizations in parallel and retains the one that first leads to a generalized alarm of a user defined size. A somewhat different approach is used by Manganaris et al. [26] Instead of filtering out or removing the benign alarms as Julisch [16] and Clifton and Gengo [5] do above, they are viewed as something normal. The idea is presented as applying anomaly detection on the output from a misuse detection system. A base template of what the normal alarms are and how they behave is established, when the “normal” alarms suddenly change in frequency or in sequence, an alarm is raised. The basic idea Manganaris et al. have is that repetitive behavior over long periods of time is in all likelihood normal. Combinations of certain alarms occurring in close temporal proximity of each other and always in the same order, for an extended period of time are deemed less suspicious than a sudden burst of novel alarms. To discover the sets of benign alarms occurring frequently, association analysis is used on the bursts of alarms.
3.4
Ranking
Correlation in Section 3.2 and filtration in Section 3.3 helps the operator a great deal, reducing the number of items to go through. They do not however help the operator to rank and process the result in regard of importance. This is addressed by Almgren and Jonsson [2] and Porras et al. [30]. The two reports have diametrically opposed methods to rank alarms.
3.4. RANKING
Almgren and Jonsson [2] pose the question: “is it possible to capture the pref-erences of the site security officer (SSO) by monitoring her normal interaction with the IDS?” or put a little differently: “is it possible to prioritize alarms based on the feedback from the user?” Their aim is to develop a system that learns how to rank alarms based on the input from the user and local operational conditions. This model assumes the use of a graphical user interface to display the alarms and interaction from the user in the form of clicking on alarms. Four interaction modes are presented:
• Clicking - the system stores information on what alarms the user clicks on. Assumes that alarms clicked on is of greater interest than those not touched. Ranks those with a larger amount of clicks higher than those with a lesser amount.
• Directed learning - this is an extended form of clicking. On top of the normal procedures the user has the choice of specifying to the system why she finds this particular alarm interesting.
• Feedback - the system ranks the alarms and specifies for each a reason why it is raked the way it is. The user then has the option of either agreeing or disagreeing with the ranking. This is in a way directed learning in reverse. Instead of the user telling the system, the system is telling the user.
• Explicit questions- this is another extension of clicking where the sys-tem occasionally asks the user how to rank an alarm.
Almgren and Jonsson estimate the first interaction mode, clicking, to be the base case of all proposed interaction modes and concentrate on this first. The work flow of the base case is intended to follow
1. alarms are presented based on the current ranking function.
2. the SSO reviews the ranked list to assess the most important alarms. 3. the SSO investigates the most important alarms by clicking on them. 4. the system evaluates the current ranking function by checking what alarms
were clicked and if these indeed were ranked highest. If not, the system reevaluates the ranking function using the feedback from the clicks for improvement.
5. a new view is presented to the user based on the new sample ranking function.
The system presented by Almgren and Jonsson operates on an on-the-fly con-figuration. The ranking M-correlator devloped by Porras et al. [30] operates on utterly opposite premises. It is dependent on configuration files describing the topology of the system, the most critical assets and alarms of interest for the operator.
As can be seen above, the final ranking score is dependent upon a multitude of variables. The correlator starts though with filtering out alarms the operator has expressed low interest in. On the alarms passed by the filters a relevance score is calculated for each, this corresponds to therelevancenode in the graph. Each alarm is compared against a map of the topology of the network containing
CHAPTER 3. PREVIOUS WORK
Figure 3.1: The Bayesian network used when calculating the final rank score for alarms in the M-correlator by Porras et al. [30].
information about such things as running applications, OS, services, open ports, to see how relevant the alarm is to the network. The M-Correlator includes an
Incident Handling Fact Base which provides information about vulnerability dependencies. E.g. an alarm pertaining to a Microsoft Server would yield a low relevance score in an environment running Apache. The map of the network is automatically generated by the toolNmap. The M-Correlator moves on to calculate the priority of the alarm. This relies on two variables (prioritynode in the graph). One is to what degree the alarm is targeting data assets and services most critical for the client users. These are enumerated in a configuration file by the operator. The other concers which alarms are of greatest interest to the operator. This is also specified by the operator in a configuration file. Lastly, anincident rank is assigned to each alarm based on the previously calculated relvance and priority scores, reflecting the possible impact the attack would have on the system and the likelihood of its success (outcomein the graph). Once an alarm has been given an incident rank the M-Correlator tries to merge related alarms together into higher-level security incidents which in turn are ranked. This is done by aid from the Incident Handling Fact Base which also carries information about what types of alarms can be merged.
The relevance score, priority calculation and incident rank are all computed by using a variation of the Bayes framework for belief propagation in trees.
3.5
User input
Only a few reports mention user input and only Almgren and Jonsson [2] focus exclusively on the interaction between system and operator. The interaction
3.5. USER INPUT
can be passive with the system simply observing the user and trying to draw conclusions from these observations and any possible user input, or it can be active posing specific questions to the user, initiating the interaction. This makes the system dynamic in the sense that the algorithm behind the ranking possibly changes by every interaction.
The time the correlation system of Cunningham et al. [7] is exposed to the user is limited only to the user tagged sets it is trained upon before launch. This is the only interaction with the system, making it a static one, since beyond the initial training set, there are no modifications to how the algorithm processes the alarms.
Attempting to reduce the number of false positives Pietraszek [29] first lets the user classify a set of alarms, then machine learning techniques are used on training examples the system derives from the original set of user classified alarms to generate rules of how to classify. The alarms classified by the rules are then sent to the user for optional scrutiny. Alarms are re-classified as needed. Although the user is very involved in the process of classifying alarms, this is very little highlighted by Pietraszek. Nothing is mentioned about the process of classifying the starting set of alarms, or the process of reclassifying, or about how the interaction functions, or what kind of input the system expects and what kind of feedback it gives.
As mentioned in Section 3.4, the mission based system of Porras et al. [30] involves the user, although quite extensively, only during start-up, similar to Cunningham et al. [7]. The user has to enumerate critical data assets and services and specify an interest profile describing which classes of alarms are of greater concern. However, there is no interaction with the user once the system is on line and there is no discussion about giving feedback to the system or what to do if the user is dissatisfied with the ranking. However, Porras et al. describe an adaptive mode concerning the conditional probability tables (CPTs) under the section describing the Bayes calculation. Here the analyst presents simulated alarms to the system which are then ranked. For each alarm, the ranking is either accepted or changed to a more accurate one by the analyst. The effect will be that the CPTs change to some extent to better mirror the preferences of the analyst. This adaptive mode is never evaluated or mentioned again in the remainder of the report.
All schemes have user input somewhere in the chain. Somewhere and some-place there has to be a human involved in the process to either analyze an alarm, describe the critical aspects of a network, evaluate performance, sepa-rate unimportant alarms form the important or deciding if it is a true or false positive. Clifton and Gengo [5] described in Section 3.3 need the user to deter-mine whether a frequent episode is benign. The same goes for Julisch [16] in the same section. The generalization hierarchies must all be defined by the user and contains the knowledge of the user about the system and about alarms in general.
In the next chapter we discuss how the methods presented here relate to our solution and what aspects were taken under consideration.
Chapter 4
Methodology
In order to investigate current methods of prioritizing and managing alarms, we have studied current research in form of published reports and books, as described in Chapter 3. We have also interviewed four professionals.1 Based on this material, we had a number of options to choose from when deciding on a possible improvement to an existing IDS. The choice finally settled on the implementation of a ranking functionality in the architecture Snort/Snorby.
Choosing method for implementation
Aggregation was the first to be rejected due to its simple and confined nature. Correlation (see Section 3.2) is a labour intensive and time consuming method in regard to identifying and defining pre-conditions and post-conditions. This makes correlation an activity incompatible with the continuous task of inspect-ing incominspect-ing alarms. As our interest lies with the everyday interaction a user has with the IDS, correlation is rejected. Set up of filters is done prior to the de-ployment of the IDS. The setup process is in no way part of everyday operations making this less interesting.
Ranking is a necessary step whether the system employs aggregation, correla-tion, ranking or a collaboration of them all. As long as there are more than one alarm to inspect, the operator has to make a choice in which alarm to in-spect first. That choice is the essence of ranking - which is the most important alarm to look at? For these reasons we have chosen to implement a variation of ranking.
Choosing architecture to make implementation on
To be able to make improvements to an existing IDS we needed access to the source code, which is easier with open source projects. Snort is an obvious choice because of its longevity and dominance within its field. Of the interfaces available for Snort only two seem to be in use today, BASE and Snorby, where
4.1. HOW TO IMPLEMENT RANKING
we chose the latter for this project. BASE is written in PHP and Snorby in the framework Ruby on Rails. The latter facilitates implementation and leaves more time to concentrate on the logic of the implementation. Finally, Snorby is actively developed, meaning that our contributions may be used in future releases.
4.1
How to implement ranking
There are two distinct methods for ranking, either heavily configured [30] or on-the-fly configuration [2]. Out of these, the approach by Almgren and Jonsson [2] seemed the most interesting, focusing on the ongoing interaction between user and system. The system in Porras et al. [30] has a life-cycle similar to filtering, only deployed once in the beginning. Any changes made to the configuration files results in a restart of the system. We believe a dynamic system that can learn is more useful to the operator.
The first two problems immediately encountered after settling on Almgren’s and Jonsson’s [2] mode of interaction, were how to communicate to the system why certain alarms are important and what information of the alarm to use when deciding on a rank. There is of a lot of information such as destination IP, source IP, destination port, source port, alarm signature, and/or patterns in payload that might be of interest to a ranking system. A number of ways, more or less time consuming were discussed during the course of finding a good interaction model with the IDS. These are described in the following. For the final method, see method 3 on page 37.
Interaction method 1: check boxes
One of the discussed and rejected suggestions was the use of check boxes (Fig-ure 4.1). I.e. each alarm is presented with some check boxes, one each for the attributes chosen for analysis. As we have chosen to follow the attributes des-tination IP, source IP, desdes-tination port and alarm signature, our case results in four boxes. The check boxes corresponding to the reason of interest are checked and the result submitted to the IDS. The same suggestion was also presented by Emilie Lundin Barse during her interview.2 Hopefully, this will let the IDS make rather precise predictions about new alarms, whether the operator will find them important or not. Over time the IDS will gather more information and improve its performance, saving time for the operator as the critical alarms will already be flagged. This holds a great benefit over the original clicking method proposed by Almgren and Jonsson [2] where the system did not know why an alarm was clicked and in a sense had to guess how to rank the alarms. The problem and the ultimate reason for its rejection, is that we wanted the necessary interaction to be as minimal as possible. If this model is extended to track additional attributes, more check boxes will have to be added and the users interaction with the system will become more complicated and time consuming.
2Emilie Lundin Barse (information security consultant, Combitech, interviewed in person
CHAPTER 4. METHODOLOGY
Figure 4.1: Conceptual design of check boxes for interaction with the ranking system.
Interaction method 2: only clicking
A better approach would be to gather information in the background in a more non-intrusive way but still get adequate information to make meaningful pre-dictions. The first method suggested by Almgren and Jonsson [2], clicking, fits our objective. It silently records on what alarms the user clicks and tries to make predictions about rank.
Clicking in its original description has a shortcoming. It is only described as an incrementing value, meaning a value either grows with clicking or remains as is. But what if one would like to lower the priority of something? I.e. there is a server with a serious security flaw. All alarms of a certain type targeting the server is now of immense interest. In all, a few weeks pass by where all such alarms are dutifully clicked and examined, until the vendor of the server software releases a patch. All of a sudden, the previously important alarms are now a hindrance. Here, it would be very beneficial to be able to rank these alarms down and stop them from cluttering the view.
Interaction method 3: positive and negative feedback
The solution decided on, is used in a number of community news sites such as Digg and Reddit and also by the video-sharing website YouTube. It gives the user the ability to give positive and negative feedback to the system through two buttons associated with each item. The system will change the rank of that item according to the vote. News stories and videos appreciated by a lot of votes will be ranked higher than other news stories and videos.
Figure 4.2: The thumbs up button and the thumbs down button to press for liking respectively disliking a video on YouTube.
Our ranking model works in a similar manner, but instead of ranking news stories it ranks alarms generated by Snort. There are two buttons associated with each alarm, a “+” button and a “-” button. If the user clicks on one of the buttons she gives that alarm a higher or lower priority respectively. In reality, alarms are not clicked because of a single attribute.3 Instead, it is
![Figure 2.1: Architecture of a generic IDS [25].](https://thumb-us.123doks.com/thumbv2/123dok_us/1373361.2683880/20.892.230.743.215.452/figure-architecture-of-a-generic-ids.webp)