Language Change as a Social Process: Diffusion Patterns of
Lexical Innovations in Twitter
REBECCA MAYBAUM University of Haifa
One of the major concerns of sociolinguists is to better understand and explain the mechanisms driving language change, in particular the process by which innovative variants appear and subsequently spread throughout a population. Questions regarding the diffusion of new variants over time have been explored from a variety of perspectives (most prominently in socio- and historical linguistics), and a consistent finding is that the diffusion of innovative variants through the linguistic system forms an S-shaped curve with respect to time (Labov 2001).
Similar observations are reported from the field of innovation diffusion research, an interdisciplinary area of the social sciences concerned with how, why, and at what rate innovative ideas and technologies spread through social systems. Studies from innovation diffusion research have shown that the rate of diffusion of (non-linguistic) innovations—including medical, agricultural, political, and technological examples—also forms an S-shaped curve with respect to time (Rogers 1995).
The similarities between findings from language change research and innovation diffusion research suggest that language change may be explained by the same mechanisms that govern the social diffusion of non-linguistic innovations. In this paper I apply the theoretical framework of innovation diffusion research to an instance of language change. By approaching the diffusion of linguistic innovations as a social process, I hope to gain insights into the mechanisms of language change from a new perspective.
sociolinguistic and the innovation diffusion perspectives, highlighting similarities as well as critical differences between the two models. Section 2 introduces the dataset and gives an overview of the research design. Section 3 presents the results of the analysis. Section 4 discusses the implications of the results, in particular how the innovation diffusion model can be used to uncover nuances in the innovation-decision process of language users. Finally, section 5 outlines some conclusions.
1 Background: S-Curves of Diffusion
1.1 Innovation Diffusion Research
Sociologists and anthropologists in the 1920s and 1930s were already investigating the process of innovation diffusion in various domains on the premise that the spread of new ideas and products had to do with social connections and informal communication among people in a society (Katz et al. 1963). A major breakthrough came when Ryan and Gross (1943) reported that the diffusion of innovative agricultural technology formed an S-shaped curve— following a “slow-quick-slow” pattern—with respect to time. Since then, studies in medicine (Coleman et al. 1966), family planning (Rogers and Kincaid 1981), and other areas have provided more evidence that the S-curve pattern of innovation diffusion is generalizable to all different types of socially diffused innovations.
Threshold models (Granovetter and Soong 1988; Valente 1996) have been proposed to explain why diffusion occurs in an S-curve pattern. These models propose that there is a “tipping point,” both within individuals and the population as a whole. In the case of an individual, a very low adoption threshold would mean that the individual would only need superficial exposure to the innovation in order to adopt it, whereas a high adoption threshold would require many other members of the individual’s social network to adopt before arriving at his or her tipping point. At the level of the population, the threshold refers to the critical mass of overall adoption among the population before the rate of diffusion begins to accelerate.
A related concept is the innovation-decision process (Rogers 1995), which recognizes that an individual’s decision to adopt an innovation is not instantaneous, but progresses through five stages: 1) knowledge, 2) persuasion, 3) decision, 4) implementation, and 5) confirmation (Rogers 1995). At any point in the innovation-decision process, the individual may reevaluate his or her previous behavior and choose to adopt or reject the innovation.
In spite of the evidence showing that the S-curve is the most typical pattern for innovation diffusion, Rogers (1995) points out that this pattern is only predicted for successful innovations, while in fact a great many innovations never
reach a critical mass of adoption and fail to diffuse widely. Furthermore, even in the case of successful innovations, some diffusion patterns may not form an S-shaped curve due to specific conditions related to the social system or to the innovation itself. The exact shape of the diffusion curve must be empirically determined for each individual innovation; deviations from the prototypical S-shaped curve may be interpreted based on the idiosyncratic conditions of the specific innovation and the specific social system.
1.2 Sociolinguistic Research
Sociolinguists have classically studied the process of language change by correlating linguistic variation with social factors, such as class (Labov 1964; 1994), gender (Ochs 1992; Bucholtz 1999; Cameron and Kulick 2003), age (Sankoff and Blondeau 2007), ethnicity (Cukor-Avila and Bailey 2001), and social network structure (Labov 1972; Milroy and Milroy 1985; Eckert 2000; Paolillo 2001). The progression of linguistic change over time has typically been analyzed using either the apparent time construct (comparing language use by speakers of different ages at a single point in time) or real time data (comparing language use by matched speakers at different points in time). While these two approaches have indeed spawned advancements in language change theory, the time gaps between cohorts are often too coarsely grained to allow in-depth analysis of the precise diffusion pattern over time.
A parallel stream of language change research has developed that sidesteps the size limitations of the traditional variationist study by employing computer modeling to try to understand language change on a large scale. Landsbergen and Lachlan (2004) use a computer simulation to model the historical semantic shift of English will and Dutch willen. Nettle (1999) used computer simulations modeled on Social Impact Theory to test various social and network parameters that may influence the spread and adoption of linguistic changes. And Ke, Gong, and Wang (2008) draw from and improve upon Nettle’s model by comparing simulations using different types of network structures. The cumulative body of sociolinguistic research, from both the computational modeling and simulation stream and the empirically based real- and apparent time research tradition, consistently reports an S-shaped curve of linguistic diffusion over time (Bailey 1973; Labov 1994, 2001; Denison 2002; Tagliamonte and D’Arcy 2009).
In spite of the superficial similarities between the sociological and sociolinguistic S-curve models of diffusion, however, there is a crucial difference between the two constructs: one measures diffusion through a linguistic system, while the other measures diffusion through a social system. This difference is illustrated in (1), which shows idealized S-curves of diffusion in the socio-historical linguistic traditions (on the left), as well as in the tradition of sociological diffusion of innovation (on the right).
(1) Diffusion through a linguistic system (left) and social system (right)
In both graphs the x-axis indicates time; the y-axes, however, represent different measures. On the left, the y-axis represents all occurrences of a particular linguistic context y—a context in which evidence of variation of some sort has been identified, and which is the suspected locus of a change in progress. Each point in the curve represents the percentage of all instances of context y that are realized as variant z, at each point in time (for instance, the percentage of ne deletion in negation contexts in Montreal French).
On the right, the y-axis represents the population of potential adopters—that is, individuals within the community who could conceivably be exposed to the innovation and might eventually adopt it themselves. Each point in the curve represents the percentage of the total potential adopter population who have adopted the innovation at each point in time.
The distinct y-axis labels in both graphs mean that the S-curves of diffusion discussed in sociolinguistics and innovation diffusion in fact measure two entirely different concepts. Socio- and historical linguists too often fail to make this distinction, referring to the increase of a linguistic variant relative to the text data as social diffusion, when in fact social diffusion is measured by the proportion of individual language users who adopt the variant.
2 Data and Research Design
2.1 Twitter Data
The study is based on a 19-million-word corpus collected from the online microblogging service Twitter, consisting of all Twitter posts containing the following community-specific lexical innovations: tweeps, tweeties, tweeple, tweethearts, tweople, twerps, tweetheads, twitterbugs, tweebs, and twittertwatters. These variants, henceforth referred to as Twitter People variants, all share the approximate meaning “twitter friends.” For example, tweople combines “Twitter” and “people” (2), tweeps comes from “Twitter peeps” (3), and “Twitter sweethearts” becomes tweethearts (4):
(2) How many Tweople got hair cut today?
(3) For all you working tweeps out there...apparently tweeting at work is a good thing
(4) Time for bed - busy day tomorrow. Goodnight Tweethearts! Thanks for the fun and tweet dreams:)
One advantage of using Twitter data to investigate language change stems from the existence of automatically collected digital archives, containing complete records of past Twitter posts (tweets). In most cases, sociolinguistic researchers are able to identify a change in progress only in advanced stages of the diffusion process. Yet using archived collections of historical Twitter data, it is possible to identify variants of interest at later stages of the change in progress, and then subsequently trace the diffusion trajectory backward in time to the earliest appearances of the innovative variants. In this way, the Twitter dataset collected for the present study provides a rare opportunity to examine the early stages of the innovation and diffusion process.
The use of Twitter as a data source also avoids some of the practical limitations encountered by previous research into the diffusion of linguistic innovations over time. Most of the sociolinguistic studies investigating the spread of innovative variants are based on empirical, real-world language data collected from a relatively small number of speakers (e.g. Milroy and Milroy 1985; Eckert 2000), requiring time-consuming methodologies that effectively limit the overall sample size of the study. Another thread of research has begun using computer models to simulate large-scale diffusion of linguistic innovations (Nettle 1999; Ke et al. 2008), utilizing powerful statistical tools to gain insight into aspects of language change that are undetectable on a small scale. The Twitter data capitalize on the advantages of both streams of research described above, combining empirical language data with large quantities of time-stamped data.
2.2 Research Questions
The paper addresses the following research questions: 1) Do the Twitter People variants follow an S-curve pattern of social diffusion? If so, that would suggest that language change shares characteristics with other kinds of social processes, and may be governed by the same mechanisms that shape the social diffusion patterns of non-linguistic innovations. 2) Are the diffusion patterns consistent across all Twitter People variants? If not, are these differences correlated with other factors, such as the relative success/failure of the variant (as measured by overall frequency)? 3) How many times must a user post a Twitter People variant to be considered an adopter? And, 4) is the shape of the diffusion curve affected
by the criteria used to define adoption? (See below for discussion of adopter criteria.)
2.3 Corpus Overview
The Twitter People Corpus consists of all Twitter posts that contained any of the Twitter People variants listed previously, posted from 2006 through 2011. The data collected includes the full text of the tweets, the user name of the author, a timestamp of the publication accurate to the second, and a variety of additional metadata. Table (5) displays the word count, number of tweets, and number of individual users for each Twitter People variant subcorpus.
(5) Twitter People variants—word count, tweet count, and user count
In total the corpus contains close to 19 million words. By far the most popular and most widespread variant of the group is tweeps, appearing in more than 800 thousand tweets. At the other extreme is twittertwatters, appearing just 16 times throughout the entire time period represented by the corpus.
2.4 Time of Adoption
One possible way to represent the rate of diffusion would be to calculate the raw frequencies of each keyword based on the total number of occurrences in the corpus. However, the diffusion rate of a socially-diffused innovation is more often—and more usefully—measured based on the time at which individuals adopt the innovative term, with no regard to the times of subsequent productions. For the individual Twitter People variant diffusion graphs, time of adoption is defined by the Unix timestamp that corresponds to the earliest tweet of each unique user in each variant subcorpus.
2.5 Accounting for Twitter Population Growth
Traditional mathematical models of innovation diffusion have generally assumed a stable overall population size. This assumption, while convenient conceptually and mathematically, often fails to represent the reality (see Mahajan and Peterson 1978). In the current example, the Twitter population is far from constant; on the contrary, it has increased—and continued to increase—over time, as more and more people continue to sign up for new Twitter accounts.
Twitter has not published official records of its population increase over time, although numerous external observers have calculated the approximate population increased based on a variety of secondary information. In this investigation I used Twitter population data calculated by Pelzer (2012). The data were published in graphical form, but the raw population numbers are not publicly available. I converted the visual Twitter population data into numerical coordinates to reproduce the corresponding population data.
Figure (6) shows the total Twitter population increase in monthly increments, from January 2007 through December 2012 (reanalyzed from Pelzer 2012 visualization). The most dramatic increase in population growth occurred in February 2009, though there is also a noticeable increase in March 2007. The population growth continued to increase through the end of 2011.
(6) Twitter Population over Time, 2007–2011
In order to account for this growing potential adopter population in Twitter, I calculated proportional frequency of adopters over time, rather than using the raw frequency of individual adoption. Proportional adoption rates were calculated by dividing the raw frequency of adopters in each Twitter People variant subcorpus by the number of overall Twitter users, for each point in time along the x-axis.
The resulting value represents proportional adoption rates of each variant adjusted for the simultaneous increase in the total population of potential adopters.
2.6 Adopter Criteria Conditions
The question of how to define adoption in the context of Twitter People variants in Twitter is one that must be carefully considered, as it may have significant consequences for the analysis itself and for the interpretations of the results. The simplest and most straightforward definition would be to consider any single use of the variant in question as adoption. However, it is possible that some users adopted a Twitter People variant on a trial basis (as part of the innovation-decision process) process before subsequently rejecting it. In this case, a single post containing the variant would not constitute final adoption. Two adopter criteria conditions, based on number of posts per user (all users vs. multiple-post users only), are assessed in the diffusion analysis.
3 Results
The results of the analysis are displayed using graphical representations of the adoption/diffusion patterns of each Twitter People variant, as well as the entire group of Twitter People terms combined, over the time period represented by the data.
Although the data collection spanned the time range from March 2006 through January 1, 2012, none of the variants appeared prior to 2007. Because of this, all of the diffusion graph results are presented with an x-axis time scale of January 2007 until January 2012. The y-axis range varies according to the overall frequency of each variant for best visual comparison of the overall trajectories of the diffusion curves.
3.1 Overall Diffusion Patterns
When looking at the diffusion patterns for the Twitter People variants based on all users, two common patterns emerge. The first pattern resembles the prototypical S-curve predicted by both the sociolinguistic and the innovation diffusion literature. Examples of this pattern are shown in (8). The theoretical S-curve model measures cumulative frequency of the innovation over time, which would mean that the y-value can never decrease over time. However, because the diffusion curves of this study are based on proportional frequency relative to a simultaneously increasing Twitter population, it is possible for the number of potential adopters to increase more rapidly over time than the number of cumulative adopters, as seen in (7).
(7) S-Curve Diffusion Pattern (All Users)
Examples of non-S-curve diffusion patterns are shown in (8). These diffusion curves are stepwise or near-linear in pattern, and are characterized by continuous increase over time, in some cases interspersed with periods of stable proportional frequency.
(8) Non–S-Curve Diffusion Pattern (All Users)
Table (9) shows the distribution of diffusion patterns for all variants. (9) S-curve Summary of Twitter People Variants (All Users)
0.000%$ 0.002%$ 0.004%$ 0.006%$ 0.008%$ 0.010%$ 0.012%$ 0.014%$ 0.016%$ 0.018%$ Jan -0 7$ May -0 7$ Se p-0 7$ Jan -0 8$ May -0 8$ Se p-0 8$ Jan -0 9$ May -0 9$ Se p-0 9$ Jan -1 0$ May -1 0$ Se p-1 0$ Jan -1 1$ May -1 1$ Se p-1 1$ Jan -1 2$ Tweepl e !u sers! (a s!%! of !to ta l!T w i0 er !p op ul a2 on ) &
Tweeple!–!adop2on!over!2me!(all!users)&
0.000%$ 0.005%$ 0.010%$ 0.015%$ 0.020%$ 0.025%$ 0.030%$ Jan ,0 7$ May ,0 7$ Se p,0 7$ Jan ,0 8$ May ,0 8$ Se p,0 8$ Jan ,0 9$ May ,0 9$ Se p,0 9$ Jan ,1 0$ May ,1 0$ Se p,1 0$ Jan ,1 1$ May ,1 1$ Se p,1 1$ Jan ,1 2$ Twee$es !u sers! (a s! %! of !to ta l!T w i0 er !p op ul a2 on ) &
Twee$es!–!adop2on!over!2me!(all!users)&
0.00%$ 0.01%$ 0.02%$ 0.03%$ 0.04%$ 0.05%$ 0.06%$ 0.07%$ 0.08%$ Jan 00 7$ May 00 7$ Se p00 7$ Jan 00 8$ May 00 8$ Se p00 8$ Jan 00 9$ May 00 9$ Se p00 9$ Jan 01 0$ May 01 0$ Se p01 0$ Jan 01 1$ May 01 1$ Se p01 1$ Jan 01 2$ Tweeps !u sers! (a s! %! of !to ta l!T w i0 er !p op ul a2 on )! Tweeps!–!adop2on!over!2me!(all!users)! 0.000%$ 0.001%$ 0.002%$ 0.003%$ 0.004%$ 0.005%$ 0.006%$ 0.007%$ 0.008%$ Jan 00 7$ May 00 7$ Se p00 7$ Jan 00 8$ May 00 8$ Se p00 8$ Jan 00 9$ May 00 9$ Se p00 9$ Jan 01 0$ May 01 0$ Se p01 0$ Jan 01 1$ May 01 1$ Se p01 1$ Jan 01 2$ Tweethearts !u sers! (a s! %! of !to ta l!T w i0 er !p op ul a2 on ) ) Tweethearts!–!adop2on!over!2me!(all!users))
3.2 Adopter Criteria
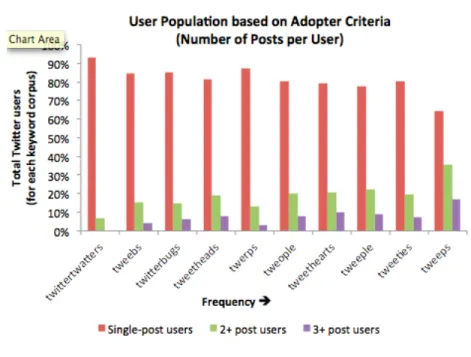
As discussed in Section 2, the criteria used to determine whether a Twitter user is, in fact, an adopter of the Twitter People variants may be adjusted based on the total number of posts per user. Over 70 percent of users posted only once, while less than 14 percent posted three or more times.
Figure (10) shows the proportion of adopter type (based on total posts per user) in each Twitter People variant subcorpus, arranged in order of overall frequency from left to right. The graph shows a positive correlation between overall frequency of the variant (indicating relative success of diffusion) and the percentage of users with multiple posts (2+ and 3+ post users), and a negative correlation between overall frequency of the variant and the percentage of users who posted only a single time throughout the period represented in the corpus. (10) User Population by Adopter Criteria
3.3 Diffusion Patterns—Users with Multiple Posts
When the adopter criteria are limited to include only those users who posted multiple times (2+ and 3+ users), the resulting diffusion curves are altered. More of the Twitter People variants exhibited S-shaped diffusion curves under the multiple-posts-per-user condition than in the all-users condition. Figure (11) shows the diffusion curves for tweeps and tweethearts for users with three or more posts each. The same variants that did not produce S-shaped diffusion curves in the all-user filter (8) now follow the “slow-quick-slow” S-curves under the multiple-posts-per-user filter.
(11) S-curve Pattern (3+ Post Users)
Figure (12) summarizes the diffusion patterns for Twitter People variants in the multiple-posts-per-user filter. (Twittertwatters was excluded because there are not enough data points for multiple-post users to produce a diffusion curve for that variant.) The only variant that does not follow an S-curve is tweetheads. (12) Diffusion Pattern Summary, Multiple-post Users Only
4 Discussion
In this section I discuss the significance of the main findings for the diffusion analysis, beginning with the S-shaped diffusion patterns for the all-user adopter criteria exemplified in (7) and (8), and summarized in (9). Although Rogers (1995) claims that the S-curve pattern occurs only in cases of successful diffusion, the results show an even distribution of S-curve versus non–S-curve diffusion patterns across the range of frequencies of the variants. I found no significant difference between the likelihood of a popular slang term (e.g. tweeps) vs. an unpopular slang term (e.g. twittertwatters) to diffuse in an S-shaped pattern.
While it is not a trivial finding that five out of ten of the Twitter People variants follow the S-curve pattern of diffusion—this at least partially confirms the hypothesis that language change may diffuse socially via the same mechanisms as non-linguistic innovations—neither is it overwhelmingly
0.00%$ 0.00%$ 0.00%$ 0.01%$ 0.01%$ 0.01%$ 0.01%$ 0.01%$ 0.02%$ Jan *0 7$ May *0 7$ Se p*0 7$ Jan *0 8$ May *0 8$ Se p*0 8$ Jan *0 9$ May *0 9$ Se p*0 9$ Jan *1 0$ May *1 0$ Se p*1 0$ Jan *1 1$ May *1 1$ Se p*1 1$ Jan *1 2$ Tweeps !u sers! (a s! %! of !to ta l!T w i0 er !p op ul a2 on )! Tweeps!–!adop2on!over!2me!(3+!post!users)! 0.000%$ 0.000%$ 0.000%$ 0.000%$ 0.000%$ 0.001%$ 0.001%$ 0.001%$ Jan )0 7$ May )0 7$ Se p)0 7$ Jan )0 8$ May )0 8$ Se p)0 8$ Jan )0 9$ May )0 9$ Se p)0 9$ Jan )1 0$ May )1 0$ Se p)1 0$ Jan )1 1$ May )1 1$ Se p)1 1$ Jan )1 2$ Tweethearts !u sers! (a s! %! of !to ta l!T w i0 er !p op ul a2 on ) ) Tweethearts!–!adop2on!over!2me!(3+!post!users))
conclusive. With the introduction of the varying adopter criteria, however, the results become much more telling.
The clear majority of all Twitter users in the corpus only authored a single post employing the Twitter People variant. In other words, most of the Twitter users tried out the new slang term once, but never fully integrated it into their permanent lexicon. This raises the question of the degree of perceived trialability—the ability to try out an innovation on a trial basis without making a commitment—of Twitter People variants. This allows the individual to judge the merits and/or consequences of the innovation under real conditions. In this case, a Twitter user can try out one of the innovative Twitter People variants one time with a minimum of risk or inconvenience. The attribute of trialability is positively correlated with rate of adoption (Rogers 1995), meaning the Twitter People variants (and likely for the same reasons, other innovations within Twitter and on the Internet as a whole) are predicted to diffuse rapidly.
The relationship found between the number of posts per user and overall frequency of the variant (10) also supports the interpretation that single-post users were engaging in a trial period before deciding whether or not to adopt the innovation. The more popular variants retained more adopters after the trial period than did the less popular variants, thus the more successful variant subcorpora have a higher proportion of repeat posters than the less successful variants.
The innovation-diffusion process (Rogers 1995), briefly described in Section 1, conceptualizes the act of adoption as a five-stage process. The first stage is knowledge, or exposure to the innovation, followed by persuasion, when the individual forms an initial favorable or unfavorable attitude toward the innovation. The third stage is the decision stage, and it is here that the trialability of an innovation comes into play. The first time a Twitter user tries out a Twitter People variant (or any other innovative element), he or she is engaged in a decision-stage activity with the purpose of informing the decision to adopt or reject the innovation. If at this point the individual decides to adopt the innovation, this stage is followed by implementation (with possible re-invention) and confirmation. Rejection can occur at any stage in the innovation-diffusion process.
The minimum requirement for an individual to be considered an adopter is the implementation (post-trial) stage; in the Twitter People data, this can be defined as a user’s second post using the same Twitter People variant. We can be even more confident of the adopter classification, however, if the individual has advanced through the confirmation stage—signaled by a user’s third post. Following this model, single-post users should not be considered adopters.
A comparison of (8) and (11) illustrates the effect of altering the adopter criteria to exclude non-adopter single-post trial users from the diffusion data. The most dramatic transformation occurred for the most successfully diffused variant in the corpus, tweeps. The summary of diffusion patterns for Twitter People variants using the multiple-posts-per-user adopter criteria (12) reveals that all but
one variant—tweetheads—followed the S-curve “slow-quick-slow” pattern of diffusion. A look inside the tweetheads corpus quickly uncovers the reason for its exception: the “Twitter People” meaning of tweethead is overshadowed by the posts and references to public persona @tweethead. As such, it is to be expected that the tweetheads corpus not follow the typical pattern of innovation diffusion, since the primary context of tweethead is not as an innovative lexical item but rather as a personal and/or shared culture referent.
5 Conclusion
The results of the Twitter People diffusion analysis lend support to the view that language change is a socially driven process, and can be successfully analyzed using methods and theoretical frameworks from social science disciplines beyond linguistics. While some of the details of the Twitter People analysis varied from specific assumptions of the innovation diffusion theoretical framework (for instance, the failed Twitter People variants were as likely as successful ones to follow an S-curve pattern of diffusion), the major tendencies found across innovation diffusion studies held true for the Twitter People variants. The established concepts of the innovation-decision process and innovation attributes (in particular the notion of trialability) also provided a cohesive framework and valuable explanations for interpreting the results.
Applying classic innovation diffusion research methods to the study of language change gives sociolinguists a powerful tool for verifying and interpreting the results of both theoretical simulations of large-scale linguistic diffusion and in-depth empirical research investigating real-world language change on a smaller scale. Although some quantitative methods were used, this has remained essentially a qualitative study of diffusion over time. In the future, a fully quantitative research design may be able to more precisely compare the diffusion patterns than was possible here. The intersection between innovation diffusion and language change is a relatively unexplored area, which will benefit from the analysis of new data sources, as well as further theoretical development. As a whole, this study represents the successful application of a new (to linguistics) approach that can add another dimension to the study of the mechanisms of language change as a social process.
References
Bailey, Charles-James N. 1973. Variation and Linguistic Theory. Washington, DC: Center for Applied Linguistics.
Bucholtz, Mary. 1999. “Why be Normal?”: Language and Identity Practices in a Community of Nerd Girls. Language in Society, 28(2):203–223.
Cameron, Deborah, and Don Kulick. 2003. Language and Sexuality. Cambridge: Cambridge University Press.
Coleman, James S., Elihu Katz, and Herbert Menzel. 1966. Medical Innovation: A Diffusion Study. Indianapolis: Bobbs-Merrill Co.
Cukor-Avila, Patricia, and Guy Bailey. 2001. The Effects of the Race of the Interviewer on Sociolinguistic Fieldwork. Journal of Sociolinguistics, 5(2):252–270.
Denison, David. 2002. Log(ist)ic and Simplistic S-curves. In R. Hickey, ed., Motives for Language Change, 54–70, Cambridge: Cambridge University Press. Eckert, Penelope. 2000. Linguistic Variation as Social Practice: The Linguistic
Construction of Identity in Belten High. Oxford: Wiley-Blackwell.
Granovetter, Mark, and Roland Soong. 1988. Threshold Models of Diversity: Chinese Restaurants, Residential Segregation, and the Spiral of Silence. In C. C. Clogg, ed., Sociological Methodology, 69–104, Washington, DC: American Sociological Association.
Katz, Elihu, Martin L. Levin, and Herbert Hamilton. 1963. Traditions of Research on the Diffusion of Innovation. American Sociological Review, 28(2):237–252. Ke, Jinyun, Tao Gong, and William S.-Y. Wang. 2008. Language Change and
Social Networks. Communications in Computational Physics, 3(4):935–949. Labov, William. 1964. Phonological Correlates of Social Stratification. American
Anthropologist, New Series, 66(6):164–176.
Labov, William. 1972. Sociolinguistic Patterns. Philadelphia: University of Pennsylvania Press.
Labov, William. 1994. Principles of Linguistic Change, vol 1: Internal Factors. Oxford: Wiley-Blackwell.
Labov, William. 2001. Principles of Linguistic Change, vol 2: Social Factors. Oxford: Blackwell.
Landsbergen, Frank, and Robert F. Lachlan. 2004. A Cultural-Evolutionary Perspective on Semantic Change: The Role of Non-Social Factors in the Spread of Innovations. In Proceedings of the Sixth Annual High Desert Linguistics Society Conference, 6:47–58. Presented at the High Desert Linguistics Society Conference, Albuquerque, New Mexico.
Mahajan, Vijay, and Robert A. Peterson. 1978. Innovation Diffusion in a Dynamic Potential Adopter Population. Management Science, 24(15):1589– 1597.
Milroy, James, and Leslie Milroy. 1985. Linguistic Change, Social Network and Speaker Innovation. Journal of Linguistics, 21(02):339–384.
Nettle, Daniel. 1999. Using Social Impact Theory to Simulate Language Change. Lingua, 108:95–117.
Ochs, Elinor. 1992. Indexing Gender. In A. Duranti and C. Goodwin, eds., Rethinking Context: Language as an Interactive Phenomenon, 335–358, Cambridge: Cambridge University Press.
Paolillo, John C. 2001. Language Variation on Internet Relay Chat: A Social Network Approach. Journal of Sociolinguistics, 5(2):180–213.
Pelzer, Adriaan. 2012, February 20. Twitter Will Break Through the 500 Million User Mark on Wednesday. Message posted to http://wewillraakyou.com/ . Rogers, Everett M. 1995. Diffusion of Innovations. New York: Simon and
Schuster.
Rogers, Everett M., and D. Lawrence Kincaid. 1981. Communication Networks: Toward a New Paradigm for Research. New York: The Free Press.
Ryan, Bryce, and Neal C. Gross. 1943. The Diffusion of Hybrid Seed Corn in Two Iowa Communities. Rural Sociology, 8(1):15–24.
Sankoff, Gillian, and Hélène Blondeau. 2007. Language Change across the Lifespan: /r/ in Montreal French. Language, 83(3):560–588.
Tagliamonte, Sali. A., and Alexandra D’Arcy. 2009. Peaks Beyond Phonology: Adolescence, Incrementation, and Language Change. Language, 85(1):58–108. Valente, Thomas. W. 1996. Social Network Thresholds in the Diffusion of
Innovations. Social Networks, 18(1):69–89. Rebecca Maybaum
Department of English Language & Literature University of Haifa
Mount Carmel
199 Aba-Hushi Avenue
Haifa 31905