SHRP2 Project C03
Interactions between Transportation Capacity,
Economic Systems and Land Use: Final Report
Highway Economic Impact
Case Study Database and
Analysis Findings
Prepared by:Economic Development Research Group, Inc.
with:ICF International, Inc.
Cambridge Systematics, Inc.
Wilbur Smith Associates, Inc.
Texas Transportation Institute
Susan Jones Moses & Associates
Highway Economic Impact Case Study Database & Analysis Findings
Table of Contents
Preface ... i
P1. Project Products and Reports ... i
P2. Acknowledgements ... ii
P3. Guide to this Document ... ii
Executive Summary ... 1
1. Study Issues and Process ... 1
1.1 Project Background and Overview ... 1
1.2 Stakeholder Interview Process ... 2
1.3 Stakeholder Needs for Decision-Making ... 3
1.4 Refining Economic Impact Concepts ... 4
1.5 Study Design ... 6
2. Classification of Project Types and Settings ... 9
2.1 Types of Projects ... 9
2.2 Types of Project Setting ... 10
3. Case Selection and Data Collection ... 15
3.1 Case Study Selection Process ... 15
3.2 Process for Collection of Empirical Data... 16
3.3 Case Study Interviews ... 18
3.4 Organizing Data for Analysis ... 20
4. Data Tabulation Findings ... 21
4.1 Project Profiles ... 21
4.2 Economic Impact Metrics ... 22
4.3 Magnitude of Economic Impact ... 25
4.4 Job Impact Ratios ... 29
4.5 Role of Project Motivation ... 30
Table of Contents
Highway Economic Impact Case Study Database & Analysis Findings
5. Statistical Analysis of Job Impacts ... 35
5.1 Structure of Regressions ... 35
5.2 Statistical Analysis of Job Impact... 36
5.3 Statistical Analysis of Job Impact per Dollar ... 38
5.4 Calculations in the TPICS Web Tool... 42
6. Lessons Learned for Case Study Interpretation ... 44
6.1 Types of Benefits and Impacts Covered ... 44
6.2 Use of Case Studies ... 47
6.3 Avoiding Misuse of the Database ... 49
7. Lessons for Future Project Planning... 55
7.1 How Project Details Affect Outcomes ... 55
7.2 Land Use Policies and Conditions ... 55
7.3 Proactive Government Actions ... 59
8. Conducting Future Case Studies ... 63
8.1 Data Collection ... 63
8.2 Analysis ... 65
8.3 Construction of a Narrative ... 66
8.4 Challenges ... 66
9. Conclusions and Next Steps ... 69
9.1 Analysis Findings ... 69
Highway Economic Impact Case Study Database & Analysis Findings Page i
P
REFACE
P1. Project Products and Reports
Report on Case Study Database and Analysis Findings. This report describes research and findings from SHRP2 Project C03, entitled “Interactions between Transportation Capacity, Economic Systems and Land Use.” It describes the development of a national database of highway project case studies that contains pre/post information to portray associated changes in economic growth and land development. It summarizes analysis findings from that database and lessons learned for future case study development.
TPICS Data Base. Another product produced by this study is a web-based tool called “TPICS” (Transportation Project Impact Case Studies). The database contains 100 case studies of the economic and development impacts of highway projects, along with analysis tools for screening, viewing and analyzing information pertaining to those cases. That web site can be accessed in two ways.
via the SHRP2-sponsored web site: Transportation for Communities - Advancing Projects through Partnerships (TCAPP), which can be found at www.transportationforcommunities.com (click on the TPICS link at the bottom of the page)
or directly from the project web site: Transportation Project Impact Case Studies, which can be found at: www.tpics.us
Other Technical Documents. This project produced a series of additional technical reports, which can all be viewed and downloaded from the internet. They can also be accessed from the TPICS web page by selecting the tab on top labeled “More Info.” These reports include:
TPICS Case Study
TPICS Web Tool: Instructions for Use
TPICS Data Dictionary (Database Documentation) Research Methods
Preface
Highway Economic Impact Case Study Database & Analysis Findings Page ii
P2. Acknowledgements
Contract. This work was conducted as part of the second Strategic Highway Research Program (SHRP2), administered by the Transportation Research Board of the National Academies. It represents a product of the SHRP2 Capacity Program, Project C03.
Supervision. The project was managed by David Plazak and Stephen Andrle of the Strategic Highway Research Program.
Contractors. The research reported herein was conducted by a team comprised of Economic Development Research Group and subcontractors: Cambridge Systematics, Wilbur Smith Associates, Texas Transportation Institute, ICF International and Susan Jones Moses & Associates. The TPICS (Transportation Project Impact Case Studies) database and web tool were designed and developed by Economic Development Research Group, and implemented by ICF International.
Authors. The primary authors for this study were Glen Weisbrod, Steven Landau, Stephen Fitzroy, Margaret Collins and Adam Winston of Economic Development Research Group; Christopher Wornum of Cambridge Systematics; Paula Dowell and Eric McClellan of Wilbur Smith Associates; Sharada Vadali of the Texas Transportation Institute; Jeff Ang-Olson, Sergio Ostria, Anjali Mahendra and Stephen Ziegler of ICF International; and Susan Jones Moses of Susan Jones Moses and Associates.
P3. Guide to this Document
This document is organized in terms of three parts that together contain 9 chapters. Part A describes the study design that underlies the data collection and database development processes. Part B presents findings from analysis of the dataset. Part C presents lessons learned for interpretation of existing case studies, development of future case studies and use of the web tool for planning and decision-making.
PART A: CASE STUDY DESIGN
Chapter 1 presents an overview of the study objectives and design.
Chapter 2 presents the classification of transportation project types and settings.
Chapter 3 describes the process for selecting and conducting case studies. PART B: ANALYSIS FINDINGS
Chapter 4 presents findings from tabulations of case study data.
Chapter 5 presents findings from statistical analysis of job impact factors. PART C: GUIDELINES & LESSONS LEARNED
Chapter 6 presents lessons learned for case study interpretation. Chapter 7 provides lessons for highway project planning. Chapter 8 discusses guidelines for conducting new case studies. Chapter 9 summarizes study conclusions.
Highway Economic Impact Case Study Database & Analysis Findings Page ES- 1
Executive Summary (SHRP2 Project C03)
Highway Economic Impact Case Study
Database & Analysis Findings
Study Overview
The US Strategic Highway Research Program (SHRP) funded development of 100 pre/post case studies of the economic development and land development impacts of highway and highway/intermodal projects, along with development of a database and web tool for viewing and using their findings.
The study developed standards for a national database of pre/post case studies that included requirements for: (a) pre/post impact comparison, (b) coverage of both local and regional level impacts, (c) a wide range of alternative perspectives for viewing and measuring impacts, (d) comparison of local changes over time relative to reference sources such as state trends, and (e) reliance on both quantitative data and qualitative observations regarding local economic conditions.
The study sought to include all major project types, including intercity highways, urban beltways and local access roads, as well as bridges, highway interchanges and intermodal road/rail terminals. The projects spanned all regions of the continental US, both urban and rural settings and different economic distress levels. A small number of English language studies from Canada and abroad were also included in a format that would enable continuing expansion over time. Five categories of data were assembled for each case study:
(1) Project characteristics -- type of facility, years built, cost, size and level of use; (2) Project objectives -- congestion reduction, access enhancement, etc.;
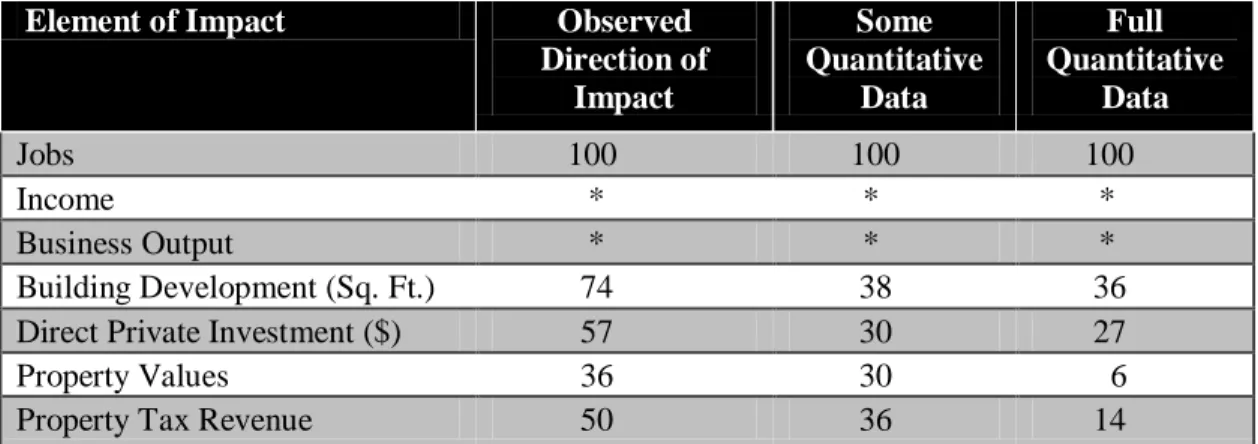
(3) Impact metrics – pre/post change in employment, income, business output, land values, building development, tax revenues;
(4) Quantitative explanatory data – location (region, metro /rural), topography, economic distress level, etc.
(5) Qualitative explanatory data –local interview findings on land use plans and
policies, business climate and support programs, other factors affecting outcomes. Analysis Findings
The case studies were analyzed through both statistical analysis of empirical data, and an effort to extract common themes from the qualitative interview reports. Key findings are listed below:
Transportation projects lead to multi-faceted forms of economic development impact, which may include effects on employment, income, land use, property values or building construction. The form of impact varies by type of project and its setting.
Executive Summary
Highway Economic Impact Case Study Database & Analysis Findings Page ES- 2 Impacts unfold over time, so no single project will necessarily show every type of impact at the same time. For that reason, multiple impact measures and an appropriate period of observation are needed to fully capture economic development impacts. Overall, 85% of the projects show evidence of positive economic impacts, while the
rest show either no net impact or a small negative impact. However, the impacts were measured at different spatial scales depending on the size and breadth of the project -- which varied in length from two-mile short access roads to major interstate highways spanning several hundred miles.
There are systematic differences in both project cost and job growth impacts that vary by project size, type and location.
Project location matters. Larger numbers of jobs are being generated by project in metro settings than by projects in rural settings. Rural projects tend to have lower costs and take less time to build than those in metro settings, though job growth in rural areas also tends to take longer to unfold than in metro areas.
The economy and business climate of the project impact area are critical factors affecting the magnitude of project impacts. Projects in economically vibrant areas with complementary infrastructure and zoning regulations tend to generate more long-term jobs than projects in areas where those factors are not yet in place.
Motivations for developing projects differ, and projects with a coordinated economic development effort (involving complementary policies) generally facilitated more long-term job growth than projects that lack local supporting policies.
Practical Use
The TPICS web tool provides transportation planners with a way to search for relevant case studies by type of project and type of location setting. Details of the projects, their impacts, and factors affecting those outcomes are all provided in the case studies. The web tool also provides users with an option to specify a given type of proposed project, and then see the range of impacts that would be expected based on case study experience to date. These features have three important uses.
First, they can have value for early stage policy or strategy development, in which it can be useful to initially identify the magnitude and types of impact tradeoffs to be considered.
Second, they can be useful for early stage "sketch planning" processes, in which it can be useful to identify the types of local barrier and success factors that will need to be addressed in later, more detailed planning steps.
And third, the case study findings can be useful in public hearings, as they provide a way of responding to the hopes of proponents and fears of opponents, with
Chapter 1: Study Issues and Process
Highway Economic Impact Case Study Database & Analysis Findings Page 1
1.
S
TUDY
I
SSUES AND
P
ROCESS
1.1 Project Background and Overview
Project. The Strategic Highway Research Program II (SHRP2), Capacity Project C03 was entitled: Interactions between Transportation Capacity, Economic Systems, and Land Use. The project included development of interviews, case studies, a database and web tool for assessing the economic and land development impacts of highway capacity investments. This document represents the final report of the project. It describes the data collection process, results of statistical analysis and study findings.
Motivation. The project was funded by SHRP2 to enhance the effectiveness of highway project planning, prioritization and selection processes, by providing more complete and accurate information on the nature of economic impacts typically occurring as a consequence of highway capacity expansion projects. The designs of the data collection process, the database tool and reporting on analysis findings were all focused on enhancing the effectiveness of local and state public meetings, policy discussions and planning processes.
The research study therefore focused on assembling information for the range of highway projects that would be expected to generate economic impacts. These are classified as “capacity expansion projects” and typically they either (a) extend highway access to new areas, or (b) enhance the throughput (flow) of existing highway facilities to enable greater speed, reliability and volume of movement. For these types of highway projects, the research study assembled pre/post information to observe the facets of economic and land development impacts that occur in affected areas, and how those impacts tend to vary by type of project or local setting.
It should be noted that there are other types of highway investments that were not covered in this study because they do not typically lead to economic impacts. These include both (a) safety improvements and (b) facility reconstruction, rehabilitation and preservation investments. Both of these latter two types of highway projects do lead to notable user benefits, either in the form of reduced deaths and injuries (in the case of safety projects) or avoided facility performance degradation (or closure).
Case Study Database. The most notable accomplishment of this project was the development of 100 case studies of highway projects, which (a) compared pre-project and post-project changes in economic and land development conditions, (b) contrasted them with corresponding conditions for a base of comparison, and (c) included both quantitative impact measures and qualitative assessments based on local interviews.
This collection of case studies, completed in 2010, was compiled with the goal of representing the full range of highway-related project types, distributed across all regions of the US and urban/rural settings. An effort was also made to build upon work done in prior highway impact studies in the US and Canada, to the extent that earlier studies fit within the case study selection design, which is discussed further in Section 1.5.
Chapter 1: Study Issues and Process
Highway Economic Impact Case Study Database & Analysis Findings Page 2 TPICS Web Tool. The case studies were put into a web-based viewing and analysis system called “TPICS” – “Transportation Project Impact Case Studies.” This system includes: (a) a search function that allows for user-defined screening and selection of relevant cases, (b) a case study viewer that provides user access to impact measures, discussion text, maps and related documents, and (c) an impact estimation calculator that shows the expected range of impact associated with any user-defined project profile.
The TPICS system was designed to assist transportation agencies in project planning and evaluation, by providing agency staff and interested stakeholders with a means for establishing the range of job, income and development impacts typically associated with various types of transportation projects in different settings.
1.2 Stakeholder Interview Process
Motivation. At the outset of this project, the study team held discussions with state and regional transportation planning officials to obtain additional information on their needs and concerns regarding current methods for assessing economic development impacts of highway projects, and the potential use of case study research. Key findings are summarized here.
Topics. The specific topics of conversation fell into four groups:
1) Level of interest in economic impact analysis found among stakeholders: levels of awareness of economic impact issues, and issues of major concern for impact measurement, assessment and forecasting;
2) Uses made of economic impact analysis by stakeholders: uses made of those impact estimates (for planning and decision-making), and types of impact metrics that they find most useful
3) Situations where economic impact analysis is most relevant: types of projects and situations where those impact measures are most needed, timing of when those impact measures are useful, and audiences for them
4) Perception of needs for improvement: perceived problems with the definition of currently available impact measures, gaps in their reliability and credibility, and weaknesses in how they are being used.
Interviewees. The discussion findings were compiled by staff of Economic Development Research Group, ICF International, Wilbur Smith Associates, Cambridge Systematics, Texas Transportation Institute and Susan Jones Moses & Associates. For this study, the team members assembled findings from their conversations with state and regional agency staff, including new interviews conducted for this study supplemented by recent conversations from other related projects.
Staff of the research team reported on discussions held with representatives from transportation planning agencies in the states of Iowa, Texas, California, North Carolina, New York, Wisconsin, Michigan, Oregon, Maine, Montana, New Mexico and the Appalachian Regional Commission. In addition, a focus group of consultants was held to
Chapter 1: Study Issues and Process
Highway Economic Impact Case Study Database & Analysis Findings Page 3 determine the factors that they collectively felt were most critical for improvement to the state of practice.
1.3 Stakeholder Needs for Decision-Making
The stakeholder interviews and focus group led to the following findings:1) Importance of Economic Development Impacts. Among state and regional transportation planning officials and staff, there is widespread recognition that economic development is a legitimate and important public policy goal, and that transportation investment can (at least sometimes) have an impact on it. However, there are many among them who are not sure how economic development impacts and opportunities can be reliably and legitimately measured. While a growing number of state and regional agencies do use economic impact models or tools, there is some remaining concern about the empirical basis of those tools. There is also uncertainty about how to interpret information on wider economic impacts and use it without double-counting transportation system benefits. Nearly all of the interviewees saw the project effort (to build a national database of case study research on economic impacts of highway projects) as providing a solid base of empirical information to help address those concerns.
2) Types of Information Needed in Decision-Making. Much of the disagreement about measuring economic development impacts, and much of the concern about their use can be traced back to confusion about the intended purpose of economic impact analysis. For DOT staff and other decision-makers, there are distinctly different types of information and communication needed at different stages in the planning and decision-making process. Yet there is no simple way to match economic impact tools or results to those stages in the decision-making process. With better guidance and case study examples, though, such problems can be addressed and the mis-application of evaluation tools can be reduced.
3) Differing Analysis Needs at Planning and Decision Stages. The interviews identified at least six distinct stages in the planning process at which economic development impacts become a consideration. At each stage, the issues concerning economic development and the necessary form of input information are different. These stages conform roughly to key decision points in the separate SHRP2 study of the collaborative decision-making process, and are summarized below.
Chapter 1: Study Issues and Process
Highway Economic Impact Case Study Database & Analysis Findings Page 4 Key Phases in Transportation Planning and Decision-Making
1. Policy/Funding Allocation Stage 2. Planning Strategy Stage
3. Programming (including funding) Stage 4. Prioritization Stage
5. Project Development/EIS Stage
6. Preservation, Operations and Maintenance Stage
There was wide divergence among interviewees as to which of these stages most needed economic development impact analysis. Actually, that is not surprising; given that they had different positions and played different roles in planning and decision-making. For instance, several interviewees noted that some projects are motivated by economic development (rather than merely congestion reduction or safety), and that can play a major role in their stated “purpose and need.” Others noted that analysis of economic development impacts is particularly useful for public information and public participation purposes. Yet others noted that there can be value in examining economic development impacts as a way to gain insight into cost recovery opportunities, or to give recognition to long-term mobility and capacity needs at a regional level (that goes beyond impacts of individual projects). Clearly, the form of analysis needed to address each of these issues can vary widely, and no single method or tool can be equally applicable for all of them.
4) Consideration of Wider Economic Benefits. Consultants and academics (rather than planners or officials) tended to be most aware of the recent European advances in formally recognizing what they call WEBs -- “wider economic benefits” -- in decision-making. Whereas economic impacts have often been seen in the US as a way of justifying projects that would otherwise not pass the traditional user benefit/cost test, the WEB approach shows how economic development assessment can also encompass land use and development considerations and serve to either increase or decrease estimates of the payback from transportation investments. By recognizing the broader range of impacts occurring in case study examples, this study can help development of a more systematic and appropriate set of economic benefit metrics for investment decision-making in the US.
1.4 Refining Economic Impact Concepts
The interviews with practitioners identified, from a practitioner’s perspective, key needs to enhance available analysis methods for assessing economic development impacts of transportation investments. They are:
(1) Need for Case Studies of Economic Development Impacts. There is a hunger and need for establishing realistic expectations about economic impacts of transportation
Chapter 1: Study Issues and Process
Highway Economic Impact Case Study Database & Analysis Findings Page 5 projects at the earliest possible point in the sequence of planning and decision steps. Staff of state DOTs continually experience unrealistically high expectations of positive job creation benefits from proponents, and also unrealistically high alarm about loss of land values and uses from opponents. These situations can increase the resources required and the time period involved in overall planning, analysis and public discussion processes. They drive demand for analysis of potential economic development impacts, though they also “raise the bar” in need for transparency in defining impact measures and estimating their values. Case study examples, selected from a national database, can help provide a more realistic range of likely impact expectations for projects being considered in early stage planning discussions.
(2) Defining and Measuring Economic Development Impact. More than one interviewee noted that the definition of economic development impacts is not a simple matter. The most common forms of economic development impact analysis focus on measuring economic activity expansion – through measures of jobs, income, GDP (value added) and/or business sales. However, public groups sometimes broaden it to encompass a wider range of societal goals for economic development, which can encompass economic standards (e.g., unemployment rate, average wage, standard of living and job skill level), and business factors (productivity and competitiveness). They may also be combined into broader measures of social quality of life (including safety/security, air quality and carbon footprint). The most common economic impact concepts can include:
Jobs
Income (or Gross Regional Product) Productivity
Property Values
Competitiveness (relative costs)
Quality of Life (air quality, safety, etc.)
Most agencies now focus on jobs because they are most easily understood by the public and do not require potentially confusing inflation adjustments. However, a number of interviewees from different agencies noted the importance of tax base and property values for public sector decision-making, while another set of interviewees expressed interest in the competitiveness and productivity to enable better economic evaluation. Case studies can potentially examine all of these impact elements.
(3) Time and Space Aspects of Economic Development Impacts. Urban planners have noted that economic development impacts can unfold over time and over space in a sequence. The most common sequence of impacts has the following order:
Change in land prices/valuation (as demand grows for some locations)
Change in property sales volume and prices (as land is purchased for new or more intensive uses)
Chapter 1: Study Issues and Process
Highway Economic Impact Case Study Database & Analysis Findings Page 6 Change in amount of construction spending (as building investment is made for
new or more intensive uses)
Change in employment, and associated wages and total business sales (as buildings are occupied)
Change in public sector tax revenues (as business activity occurs in the new buildings).
This sequence leads to a wide set of potentially relevant indicators of economic development impacts, and a wide set of potential spatial areas for measuring those impacts. However, error can be introduced when post-project studies attempt to measure some of the later forms of impact prematurely, or when they focus on too narrow of a spatial area. Error can also be introduced when pre-project forecasts focus on an overly narrow indicator or they are defined for an overly narrow or wide study area.
(4) Errors Caused by Multiple Indicators. The proliferation of multiple ways of measuring economic impacts also leads to confusion among analysts and users of this information. There is clearly confusion over pre-project impact forecasting methods that attempt to focus on just one impact indicator (e.g., jobs) without acknowledging the potential for other forms of impact (e.g., land use). There is also concern about double counting of impacts by combining overlapping impact measures.
1.5 Study Design
Following completion of the initial stakeholder interviews and focus group (as described in the preceding sections 1.2 – 1.4), the project team developed 100 case studies of highway impacts on local and regional economic development. The cases were carefully selected within a study design that ensured a wide range of different project types in different settings (as described in Chapters 2 – 5). The case studies, and accompanying database and TPICS (Transportation Project Impact Case Studies) web tool, were designed with the specific intent of addressing issues raised by stakeholder interviews. This included the following key elements:
(1) Coverage of Projects, Contexts and Impact Measures. The stakeholder interviews underscored the need to distinguish impacts among a wide range of different types of transportation projects and settings. The SHRP2 program is required to focus specifically on highways, but within that class, case studies were carefully selected to cover ten types of highway-related capacity projects, representing essentially the entire range of project types. These spanned all regions of the US and a wide range of urban/rural settings and economic conditions. These characteristics of the projects and their settings are represented in the case study database.
Economic impacts of the case study projects were then defined to include both quantitative data and qualitative observations on how economic conditions changed before and after completion of each highway project. Case studies sought to cover the full range of impacts on jobs, income, land values, building investment. Effort
Chapter 1: Study Issues and Process
Highway Economic Impact Case Study Database & Analysis Findings Page 7 was also made to distinguish the extent to which impacts occurred at a localized or regional level. In this way, the case studies highlighted the multi-faceted ways in which economic development impacts can occur, depending on the type of project and its setting. The TPICS web tool can provide tables of quantitative impact metrics as well as detailed discussion text to describe the different forms of economic development impact that have occurred. The only major limitation in terms of data coverage is that it was not possible to assemble information on how traffic conditions have changed over time. In nearly all cases, that was because pre-project data was not available.
(2) Explanation of Factors Affecting Observed Economic Results. The stakeholder interviews and focus group underscored a need to recognize (and to the extent possible) control for outside factors that also affected observed changes in economic development. Accordingly, the case studies included not only a comparison of pre- and post-changes in economic conditions, but they also included comparison of changes to reference areas to control for external business cycles, and interviews with local planners and business representatives to assess the extent to which observed changes were due to the highway project vs. other factors.
This has value in two ways. First, it provides a basis for distinguishing the extent to which the highway project was actually responsible for observed economic development impacts. Second, it serves to highlight the ways in which local economic and institutional factors served to either mute (reduce) or amplify (expand) the magnitude of observed economic development impacts. Thus, the case studies serve to establish the extent of causal connection between highway-related improvements and resulting economic impacts. However, the case study database cannot relate observed economic impacts to the magnitude of pre/post change in transportation conditions. Those relationships require more data (currently unavailable) on how transportation conditions have changed, and a more sophisticated economic model that can establish costs and benefits for various elements of the economy.
(3) Basis for Sketch Planning. The TPICS web tool provides transportation planners with a way to search for relevant types of projects in specific types of setting (region location, urban/rural population density, etc.). It also allows users an option to specify a given type of proposed project, and then see the range of impacts that have been actually observed in case studies to date. These features have three important uses. First, they can have value for early stage policy or strategy development, in which it can be useful to initially identify the magnitude and types of impact tradeoffs to be considered. Second, they can be useful for early stage “sketch planning” processes, in which it can be useful to identify the types of local barrier and success factors that will need to be addressed in later, more detailed planning steps. And third, the case study findings can be useful in public hearings, as they provide a way of responding to the sometimes outrageous hopes of proponents or fears of opponents, with information on the range of impacts that have actually occurred in the real world.
Chapter 1: Study Issues and Process
Highway Economic Impact Case Study Database & Analysis Findings Page 8 (4) Complementarity with Economic Development Impact Models. The case study results provide empirical evidence of the range of economic development impacts that have actually occurred as a result of past highway system improvement projects. Besides being directly useful for initial strategy development and public hearings, benchmarks of economic impact from past case studies (now available from this study) can also be used to help validate the reasonableness of predictions made by economic impact forecasting models for proposed future projects. Until now, there has been a paucity of such data available for validating predictive models.
However, it should also be clear that the case study database and TPICS web tool cannot serve as a substitute for predictive economic impact models. For, while predictive economic impact models forecast shifts in economic growth resulting from changes in transportation conditions (traffic levels, travel times, distances, access, reliability, etc.), the case studies lack such detailed information. That was unavoidable given the long time span of the economic impact case studies (often ten to twenty years) and the fact that data on pre-project transportation conditions was either never collected or is no longer available.
As a result, the case studies are useful for portraying the range of impacts observed from specific types of projects (e.g., bridge widening in urban areas or town bypass projects in rural areas). But they have neither the transportation data nor the statistical controls to show how variation in travel characteristics (travel times, costs and access features) affect economic impact outcomes. For this reason, the case study database is designed for use as a sketch planning tool that is most useful for initial policy or strategy development, while economic impact models are designed for to be most useful in later stages of planning and prioritization, where more details are available on the nature of proposed projects and their expected transportation system impacts.
Chapter 2: Classification of Project Types and Settings
Highway Economic Impact Case Study Database & Analysis Findings Page 9
2.
C
LASSIFICATION OF
P
ROJECT
T
YPES AND
S
ETTINGS
2.1 Types of Projects
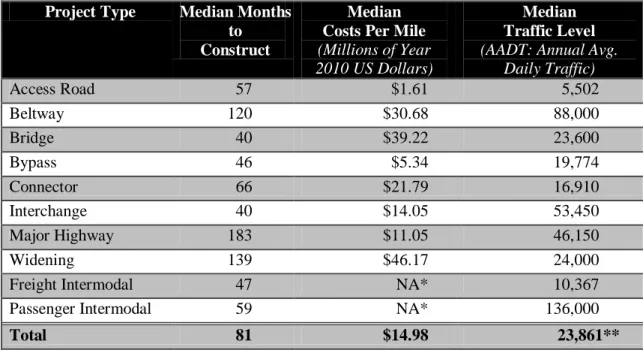
Project types are the single greatest differentiator among case studies, for different project types can have very different attributes in terms of (a) cost, (b) spatial footprint, (c) volume of activity and (d) performance characteristics. The most obvious differences are between small area projects such as interchanges and bridges, and large area projects such as major interstate highways. In between, there are various classes of beltways, town bypasses and connector routes.
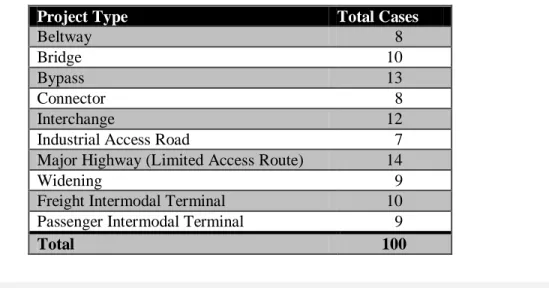
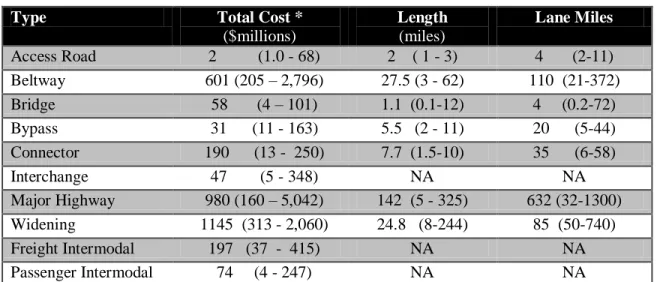
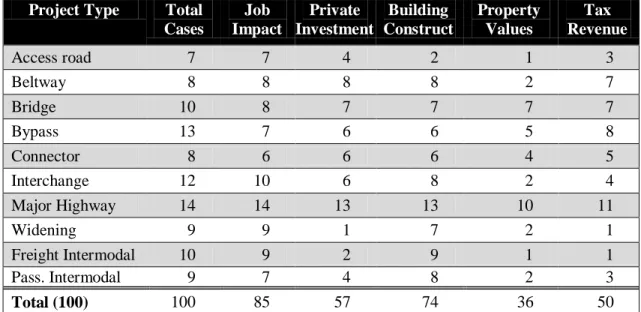
For this study, projects were classified into ten types representing different functions, spatial footprints and magnitudes of investment cost. The definitions adopted for purposes of this study are presented below. Case studies were selected to ensure a roughly even distribution of project types, dispersed among different settings and parts of the US. The number of case studies completed for each project type is shown in FIGURE 2-1 which follows.
1) Major Highways are multi-lane roadways designed to handle high vehicle volumes traveling at high-speeds. Travel lanes in either direction are separated by distance or crash barriers. Limited access highways are typically free of traffic lights and stop signs, and accessible only via periodic on/off ramps and interchanges with other Limited Access highways. Because they are designed to handle high volumes of traffic, limited access highways typically built to provide access to metropolitan markets from outlying areas, or access across metropolitan areas. Where they pass through rural areas, they do so primarily to connect metropolitan areas and/or to connect rural agricultural areas with metropolitan markets and intermodal terminals (such as airports, marine ports or rail terminals) often located in metropolitan areas. 2) Beltways are circumferential highways (typically freeways) typically built around the
fringe of major cities. They often are designed to link satellite activity centers – which can include housing, retail, and major employers – that spring up outside the center of cities.
3) Connectors provide highway access between two major highways, or between a highway and an attraction such as an airport or employment center.
4) Bypasses are highway realignments that divert traffic flow around built-up towns or other urbanized areas to allow long-distance through traffic to avoid mixing with slower local traffic. Typically an option to drive through the town center is maintained. Bypasses are designed to improve efficient traffic flow for long distance travel by keeping it away from areas with stop-and-go traffic, and to increase safety by reducing the mixing of long distance trucks with local pedestrians.
Chapter 2: Classification of Project Types and Settings
Highway Economic Impact Case Study Database & Analysis Findings Page 10 5) Bridges span natural environmental features, such as bodies of water and canyons as
well as manmade features including train tracks and other roadways.
6) Interchanges provide a connection between a limited access highway and another road that intersects with it. Interchanges are essentially a single point, or points in each direction of connection, with no length at all.
7) Industrial Access Roads are built for the specific purpose of providing access to new development sites, typically for industrial use. Some access roads support the development of a mix of employment-related uses, such as light industrial, office and commercial activity. Some are built to support the development of new industrial or business parks, and others are built to allow for the expansion of existing parks by providing access from a new direction.
8) Highway Widening Projects typically increase highway capacity by adding lanes. Widenings tend to be expensive, in part because they typically involve extensive right of way acquisition.
9) Intermodal Freight Terminals enable freight to be transferred between modes. The cases in this study all transfer freight between truck and rail modes.
10)Intermodal Passenger Terminals enable passengers to transfer between modes. The cases in this study all transfer passengers between car and rail transit modes.
TABLE 2-1 Number of Cases by Project Type
Project Type Total Cases
Beltway 8
Bridge 10
Bypass 13
Connector 8
Interchange 12 Industrial Access Road 7 Major Highway (Limited Access Route) 14
Widening 9
Freight Intermodal Terminal 10 Passenger Intermodal Terminal 9
Total 100
2.2 Types of Project Setting
Project setting is defined as the geographic, social and economic context in which a project is developed, which can have a major influence on the economic development outcomes of a project. Accordingly, the case study database has been structured to allow users to search projects with comparable settings to their local area. Elements of project setting include:
Geographical Setting – projects built in different regions of the country may be
influenced by regional differences in climate, topography, highway network density and distances between cities.
Chapter 2: Classification of Project Types and Settings
Highway Economic Impact Case Study Database & Analysis Findings Page 11 SocialSetting – impacts may vary with the density and socio-economic composition
of an area, regardless of geographic setting.
EconomicSetting – impacts of highway projects may also vary with difference in
underlying patterns of unemployment and economic growth/decline that are in effect at the time of project construction.
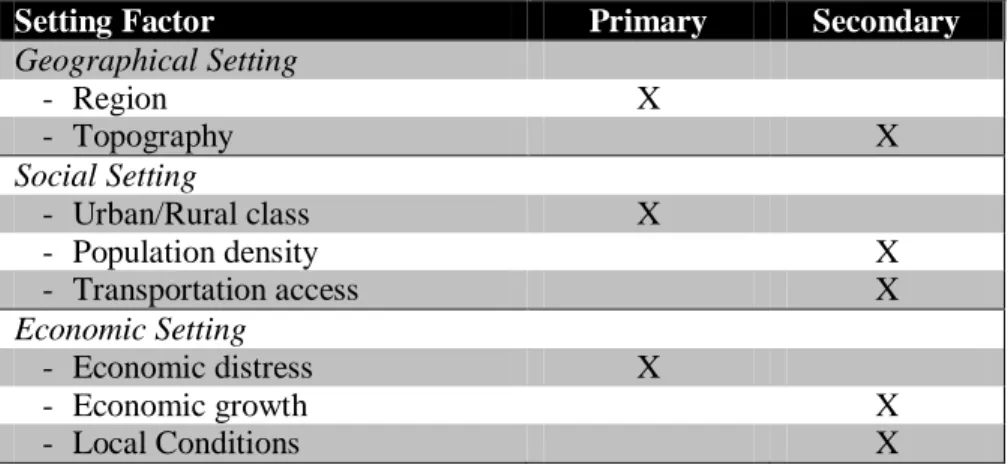
For this study, quantitative information was collected for eight aspects of project setting, which are listed in TABLE 2-2. An effort was then made to ensure that the selected case studies were representative of the full range of potential settings. To accomplish this, one key metric was selected for as the primarily indicator each of the three major dimensions of project setting, and that metric was used in the screening and selection process. Other metrics were designated as secondary elements and they are also available for use as further case study descriptors and search criteria.
TABLE 2-2 Project Settings
Setting Factor Primary Secondary
Geographical Setting - Region X - Topography X Social Setting - Urban/Rural class X - Population density X - Transportation access X Economic Setting - Economic distress X - Economic growth X - Local Conditions X
Note: The identification of primary and secondary factors and ways that they can affect economic impact were drawn from prior research studies developed by the Appalachian Regional Commission and its contractors. (See Sources of Regional Growth in Non-Metro Appalachia, three volumes, by Economic Development Research Group, Massachusetts Institute of Technology and Regional Technology Strategies, for the Appalachian Regional Commission, Washington, D.C., 2007.)
Primary Setting Indicators
Region. An important consideration in determining the comparability of projects is the regional location. The region can affect the observed impact of a project due to differences in climate, topography, land-use patterns, highway network density and travel distances in different parts of the US. This factor can thus help users compare cases in similar areas or those with similar characteristics to their own. The regions are defined on the basis of the US Dept of Commerce’s Bureau of Economic Analysis (BEA) regions -- which classifies the US into eight regions. The number of regions used for this study was reduced to five, as three pairs of regions were combined together (Far West & Rocky Mountain, Great Lakes & Plains, Mideast & New England). These regions are shown in
Chapter 2: Classification of Project Types and Settings
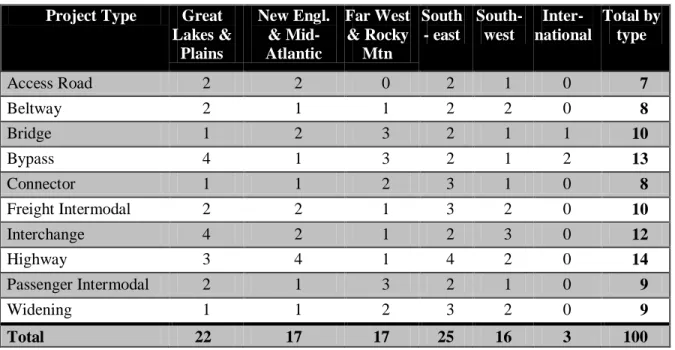
Highway Economic Impact Case Study Database & Analysis Findings Page 12 FIGURE 2-1. Effort was also made to ensure a reasonable representation of all project types in each region; that distribution is shown in TABLE 2-3.
FIGURE 2-1 Number of Cases by Geographic Region (total 100)
TABLE 2-3 Distribution of Project Types Among Regions Project Type Great
Lakes & Plains New Engl. & Mid- Atlantic Far West & Rocky Mtn South - east South- west Inter-national Total by type Access Road 2 2 0 2 1 0 7 Beltway 2 1 1 2 2 0 8 Bridge 1 2 3 2 1 1 10 Bypass 4 1 3 2 1 2 13 Connector 1 1 2 3 1 0 8 Freight Intermodal 2 2 1 3 2 0 10 Interchange 4 2 1 2 3 0 12 Highway 3 4 1 4 2 0 14 Passenger Intermodal 2 1 3 2 1 0 9 Widening 1 1 2 3 2 0 9 Total 22 17 17 25 16 3 100
Economic Market. The economic market context of a project’s location can be an important impact factor because the size of the market served by a given project would be expected to influence the magnitude of its economic impact. Market size is reflected in the metropolitan area concept as defined by the US Office of Management and Budget,
Chapter 2: Classification of Project Types and Settings
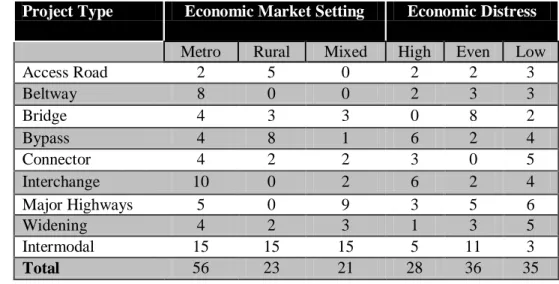
Highway Economic Impact Case Study Database & Analysis Findings Page 13 and adopted by the US Census. Every county that is part of an urban area with 50,000 or more inhabitants is classified as part of a “metropolitan area.” For this study. each highway-related project setting was classified by the county or group of counties in which the project was located. (Many of the highways covered in the case studies run through multiple counties.) If the project counties were all classified as metropolitan then the project setting was classified as “Metro.” If the project counties included both metropolitan and non-metropolitan counties, then the project setting was classified as “Mixed.” And if all project counties were non-metropolitan, then the project setting was classified as “Rural.” An effort was made to ensure a mix of most project types represented in each county setting class. (In some cases, it was not possible; for instance, urban beltways do not exist in rural areas.) The distribution is shown in Table 2-4.
Economic Distress. This measure can affect the timing and magnitude of economic impacts associated with a transportation project. Various agencies define economic distress on the basis of per capita income, unemployment, and/or percentage of population below the poverty line. However, this study specifically focused on unemployment since it is very easy to obtain is available at the community level from the US Census. The economic distress metric used for this project is one of relative position, defined by the ratio of adjusted local unemployment level to that of US level. This helps to avoid distress classification changes associated with economic booms and downturns, and thus allows pre/post characterizations of economic conditions for projects that are started and completed at different times. An effort was made to ensure a mix of most project types for each economic distress class, when possible. The distribution is shown in Table 2-4.
TABLE 2-4 Project Types and Settings
Project Type Economic Market Setting Economic Distress
Metro Rural Mixed High Even Low Access Road 2 5 0 2 2 3 Beltway 8 0 0 2 3 3 Bridge 4 3 3 0 8 2 Bypass 4 8 1 6 2 4 Connector 4 2 2 3 0 5 Interchange 10 0 2 6 2 4 Major Highways 5 0 9 3 5 6 Widening 4 2 3 1 3 5 Intermodal 15 15 15 5 11 3 Total 56 23 21 28 36 35
Secondary Setting Indicators
The secondary factors identified in TABLE 2-2 were not used in the selection of projects in the case study design, but information on them was collected. The information was used in the data analysis (reported in Chapter 6) and is also available in the TPICS database (search and selection criteria), including the following:
Chapter 2: Classification of Project Types and Settings
Highway Economic Impact Case Study Database & Analysis Findings Page 14 Topography. The extent of mountain terrain, wetlands and other land constraints can also potentially affect the nature of highway economic impacts. The US Geological Survey (from the Department of Interior) has a rating of land surfaces by county from 1 (flat) to 21 (very mountainous).
Population Density. This indicator is related to metropolitan area classification, though it can sometimes be useful as a more detailed means of distinguishing high density core counties in a large metropolitan areas from lower density outlying counties. Measures of population density are also readily available at the county level from the US Census.
Transportation and Market Access. Transportation projects can change access to intermodal (air, marine or rail) facilities and the size of an area’s labor market and same day truck delivery market. The effect can vary depending on the mix of industries in the affected area and their relative dependence on these elements of access. A directory of intermodal transportation terminals is available from the US Department of Transportation. Spatially detailed information on population and employment patterns is available from the US Census. These datasets, used in conjunction with highway network and GIS systems, allow measurement of current access times to intermodal terminals as well as commuter and delivery sheds. They can be directly calculated using the online ESRI GIS system. However, to calculate how these indicators have changed over time, it would be necessary to obtain historical highway network models and they are not widely available.
Economic Growth Trend. An area’s economic growth is an indicator of how its industries have been performing. In some cases, an area with a higher growth trend may tend to be better positioned to take advantage of new highway connections or capacity, or more in need of such improvements. Economic growth can be measured in terms of percentage change in any economic measure (output, value-added, income or employment) for any time interval. The percentage change in employment was used in this study since it offers the cleanest measure for comparison – all other measures are in dollars and, therefore subject to inflationary adjustments that vary over time. Employment data are available through the US Department of Commerce, including the US Census and the Bureau of Economic Analysis.
Local Conditions: Development Capacity. In order for business and population to expand there must be adequate land and utilities. This includes access to water/sewer lines, electricity, and zoning laws. However, these do not have standardized measures that allow for easy comparison; such information is best gathered through local research and interviews. Since this kind of data may not be readily available to users of the system, it cannot be used for screening potential case studies. Nonetheless, it is reflected in the case study narratives, and can be used to complement quantifiable measures.
Chapter 3: Case Selection and Data Collection
Highway Economic Impact Case Study Database & Analysis Findings Page 15
3.
C
ASE
S
ELECTION AND
D
ATA
C
OLLECTION
3.1 Case Study Selection Process
The case study selection process was based on the application of criteria described in the preceding chapters of this report. In addition, the project time period was considered insofar as it affected the availability of pre- and post-construction impact data. The result was a multi-stage process designed to ensure a representative mix of cases and meaningful range of project types for imputing economic impacts.
Identification of Candidate Cases. The first step in the case selection process was assemble a list of candidate highway capacity. To accomplish this, the project team queried state transportation departments for lists of highway projects that: (1) represented either new highways or major extensions, expansions or performance enhancements to existing highways; (2) were completed at least five years ago and (3) represented a significant magnitude of investment (defined as over $10 million in cost). Altogether, 138 candidate projects were identified in this ways.
Some highway projects were originally considered by the study team but ultimately not included because of the project timing. Major highway projects are often planned 5 to 10 years in advance, take 1-10 years to complete, and subsequent economic development impacts can unfold over another 5 to 10 years after construction completion. Projects completed less than 5 years prior were not considered because they were deemed too soon to fully observe impacts. And projects completed more than 20 years prior were dropped from consideration because of the difficulty collecting data on pre-project conditions, finding interviewees who could report on pre/post land use and development changes and disentangle observed changes from extraneous factors over time.
The second step was to identify previously conducted pre/post economic impact studies that could be candidates for updating and inclusion in the case study database. They were:
Major Highway Projects: Federal Highway Administration – 2005 study that included pre/post evaluation of seven rural interstate highway projects.
Urban Highway Interchange Projects: Pennsylvania Economy League – 2000 study that included pre/post assessment of 7 highway interchange projects.
Small Town Bypass Projects: California DOT – 2006 study that included pre/post meta analysis of 134 town bypass projects conducted in other states by Virginia DOT, Indiana DOT, Wisconsin DOT, California DOT and Montana DOT; Industrial Access Road Projects: Appalachian Regional Commission, Public
Works Program evaluations conducted in 1999 and 2007 that included pre/post evaluation of 199 access road projects in 13 states; plus Oregon Department of
3
Chapter 3: Case Selection and Data Collection
Highway Economic Impact Case Study Database & Analysis Findings Page 16 Economic Development, 2006 study that included pre/post evaluation of 56 access road projects.
Ranking. Candidate case studies were ranked by age, level of data completeness and expected level of effort required for completion of pre/post data. Some cases were discarded at this point; they were nearly all bypass and access road projects identified in the prior literature of meta analyses but were deemed too old or with too little detail to be considered for case study updating. Remaining cases were evaluated in terms of the availability of economic impact data. Rankings were done based on the number of impact measures available, and that led to three tiers of cases.
Tier 1 cases (totaling 70) were recommended for initial data collection. This included 24 cases that had data from previously conducted pre/post impact studies, or were deemed to be easily updated so that pre-post construction impacts could be quickly developed. It also included 46 where there was a reasonable amount of impact data available and both pre- and post-construction impacts were deemed likely to be collectable given the level of detail and documentation available from other sources. Tier 2 cases (totaling 21) were also considered viable case studies, though they would
involve a larger amount of research for impact measures and qualitative information. Tier 3 cases (totaling 87) were deemed to be less suitable for case study because they
lacked sufficient data for a case study, due to a lower availability of project documentation, as well as information on construction cost and timing.
Initially, 60 case studies were conducted; all were selected from tier 1. Subsequently, additional funding became available to add 40 more cases. They included 21 additional highway cases selected from tier 1 and tier 2, plus 19 intermodal terminals that were added later. All of these latter cases involved interchange between highway and rail modes, including both “passenger intermodal facilities” (which were rail transit stations with highway access) and “freight intermodal facilities” (which were truck/train transfer facilities for freight containers). The added cases were selected to maintain the same wide distribution among geographic regions and settings.
3.2 Process for Collection of Empirical Data
All of the case studies required empirical data on impact measures relating to economic development and land development. They also required empirical data on attributes of the projects and their settings. Specific types of empirical impact measures that are appropriate for the case studies are shown in the lists below, which were developed on the basis of recommendations in the FHWA Guide Using Empirical Information to Measure the Economic Impact of Highway Investments,2001.
Chapter 3: Case Selection and Data Collection
Highway Economic Impact Case Study Database & Analysis Findings Page 17 Project Data. The first type of data is the set of project descriptors:
1. Description of project (short paragraph)
2. Project type (highways, widening, bypasses, connectors, interchanges, bridges, beltway, access road, passenger intermodal, freight intermodal)
3. Project motivation (e.g. access, site development, labor/delivery markets, tourism, congestion mitigation).
4. Project cost (planned if available) 5. Construction start and end years 6. Project Sponsor (if applicable) 7. Case study author
8. Post-construction study date
9. Project magnitude (length, lane-miles) 10.GIS latitude/longitude coordinates 11.Related Links
12.Relevant Attachments
Location Classification. The next most critical set of project characteristics is the set of project location (setting) indicators, as these factors (along with project type) provide the core options for an initial search by a user of the TPICS system.
1. Region
2. Urban/Rural class (census designation)
3. Population density (population per square mile)
4. Economic distress (unemployment level relative to national average) 5. Employment growth rate (+/- percent annually)
6. Population growth rate (+/- percent annually)
7. Economic market size (population within 40 minutes) 8. Airport travel distance (minutes)
9. Travel distance to interstate (minutes) 10.Travel distance to major market
11.Extent of mountain terrain (Land surface rating: 1 to 21)
Impact Measures. Each team member collected pre/ post economic impact data and interviewee reporting of project impacts for as many impact elements as was practical. The impact elements are listed below. Through the local interview process, additional effort was made to estimate the portion of observed economic change that could be attributable to the highway project.
1. Per capita income
2. Economic Distress (unemployment level relative to national average) 3. Number of Jobs in the area (direct and total jobs impacts)
4. Population
5. Wages and other income (per capita or per worker; direct and total wage impact) 6. Business sales (output; direct and total output impacts)
7. Population density
8. $ Capital investment; direct and total investment
Chapter 3: Case Selection and Data Collection
Highway Economic Impact Case Study Database & Analysis Findings Page 18 10.State, local and federal tax revenues and costs (direct and total tax revenue)
11.Annual Average Daily Traffic count (AADT)
Wherever applicable, the data were collected at the local (metropolitan or smaller), county, and state area level.
3.3 Case Study Interviews
While a significant part of the empirical impact data was collected via public sources (as listed above) there are some types of impacts that required local information. The case studies also include information about causal factors affecting project impacts (including both transportation programs and non-transportation considerations). To obtain this local information, the case studies relied on interviews with local private sector and public sector participants and observers, as well as review of available local documents. The product of the interviews was to obtain additional information on impact measures and develop a coherent narrative describing project planning, implementation, and results.
Types of Interviewees. The interviews focused on filling in missing pieces of empirical information about highway impact outcomes, and additional explanatory insight into causal factors affecting those outcomes. A minimum of three interviews (one from each type below) conducted for each case study.
1. Staff of the transportation agency that built the project -- to provide project characteristics, pre/post transportation data, and information on notable aspects of project planning and implementation;
2. Staff of the local or regional planning agency – to provide information (and refer us to other appropriate data sources) on changes in local land use and
development, and relative roles of the highway project in affecting it; and 3. Staff of a chamber of commerce or local economic development agency – to
provide information on how the highway project affected business growth and investment, and its role relative to other local initiatives and factors.
Interview Questions. A number of questions were asked in order to gather more empirical data. If the pre/post data were already available, the project team asked the interviewee to validate or elaborate on it. When data were not available, interviewees were asked them to fill in the missing data. In both cases, it was useful to get qualitative information to either reinforce or substitute empirical measures. The questions included:
Describe the land use changes as a result of the project
How has the project affected property values? (pre and post measures)
How have property sales or building permits been effected by the project? (pre and post measures)
Has there been any new construction activity as a result of the project? (pre and post measures)
Chapter 3: Case Selection and Data Collection
Highway Economic Impact Case Study Database & Analysis Findings Page 19 How much of the pre and post impacts are attributed to the project? (go through the
list of available impacts data)
Do you have other before and after measures available? (go through list of impact measures that you do not have)
Do the direct impacts and total economic impacts accurately describe the influence the project has had on the area? (go through the list of economic impacts)
Special Aspects of the Project Setting and Planning. These questions focused on planning and development issues to provide more context for the project’s existence and impact.
What were the key motivations driving the need for this capacity improvement project?
Describe the societal or environmental implications of the project? (emissions, safety, sprawl)
How has the project affected the capacity for future development? Describe the local community involvement in the project.
What were the roles of various stakeholders & public agencies in supporting or modifying the project?
Describe the size of the project’s area of influence?
What were the economic and land considerations in project planning and implementation?
How were economic and land development considerations analyzed? (try to get a copy of any study that was done)
How were these considerations communicated to the public?
Describe any other key analysis issues or performance measures used in project prioritization and planning processes.
Lessons Learned. A final set of questions was included to help in gathering ideas for future research on transportation projects.
What impact measures or procedures do you think need to be addressed better or differently in the future?
What types of impact data do you think are missing or unreliable? Do you agree with how the impact measures were estimated?
Chapter 3: Case Selection and Data Collection
Highway Economic Impact Case Study Database & Analysis Findings Page 20
3.4 Organizing Data for Analysis
The information gathered for each case study was organized in a manner that could be entered into the electronic database and become accessible for users to view. For each project that a user selects, the following data were compiled:
Characteristics of the Project - description of the project, project type, length, AADT, year constructed, etc.
Intermodal volume: for passenger and freight intermodal projects, a description of freight volume or passenger movement at the project location.
Characteristics of the Project Setting – description of the project setting including the urban/rural, economic distress, etc.
Pre/Post Conditions – shows the pre and post measures for the region’s economy. Case Study Narrative – the full project narrative developed from the interviews. Project Impacts – a table of the specific economic impact findings for the project