An Exploratory Analysis of Control Sets
for Measuring E-Discovery Progress
Jeremy Pickens
Catalyst Repository Systems1860 Blake Street, 7th Floor Denver, CO 80202
[email protected]
ABSTRACT
Control sets, random selection of documents that are with-held from the supervised learning process in order to monitor the quality or progress of that training, are commonly used within the e-discovery community. They are meant to serve as measures of the quality or progress of training, as indi-cators when there is nothing left for the algorithm to learn and training may end. In this paper we offer a small ex-ploratory data analysis of control sets and find that they do not always successfully measure what they purport to mea-sure. We also offer one alternative to control sets and find encouraging results. Analyses presented are not meant as definitive; rather, they are meant as exploratory and should serve to prompt further investigation.
1.
INTRODUCTION
In recent years the e-discovery community has seen in-creasing adoption of supervised machine learning technolo-gies applied to the problem of document coding and review. A common protocol, known as TAR 1.0 or simple (active or passive) learning, i.e. SAL or SPL [5], is to train a super-vised machine learning algorithm until ”stability” and then use that inferred function to label or rank the remainder of the document corpus in a static, one shot application of the function. Of critical importance to such protocols is the ability to monitor the progress of the training so that the inferred function in its final state is able to perform as accu-rately as possible. Even in some of the newer CAL workflows in which training = review, and review = training, there is often a desire to monitor the progress of the review.
To that end, the common practice is to take a simple ran-dom sample, often referred to as areference set or control setand hold that set apart from training while observing the F1 score of the documents in that set as ranked or classified by each iteration of the learning algorithm. As the maxi-mum F1 score on the control set stops improving as training rounds continue, this slowdown or cessation in improvement is meant to indicate that the learning algorithm has gotten
Permission to make digital or hard copies of all or part of this work for personal or classroom use is granted without fee provided that copies are not made or distributed for profit or commercial advantage and that copies bear this notice and the full citation on the first page. To copy otherwise, to republish, to post on servers or to redistribute to lists, requires prior specific permission and/or a fee.
DESI VI2015 San Diego, CA
Copyright 20XX ACM X-XXXXX-XX-X/XX/XX ...$15.00.
as good as it can possibly get: No further improvement is possible. The algorithm is purportedly ”stable”.
The focus of this paper is on one aspect of the entire pro-cess. Specifically, we investigate the assumption that im-provement on the control set correlates with imim-provement on the task itself. Stated in another manner, we examine whether F1-based, randomly-selected control sets provide good indications of overall progress. We do not attempt to definitively answer this question; rather, we open an inves-tigation into the topic using exploratory data analysis [4].
2.
MOTIVATION
The motivation for this work comes from a few different observations. The first observation has to do with the man-ner in which control sets are created: simple random sam-pling. A random sample is a good way to assess the relative proportion of items of interest (e.g. responsive documents) within a collection. But to our knowledge, there is no guar-antee that a random sample will topically cover a collection, such that the coverage comprehensively reflects the whole. If the random sample does not reflect the whole, then rank-ing or classification changes within the collection as a whole may not be accurately reflected within the sample and vice versa.
We proffer the following thought experiment as an exam-ple of the difference between random sampling being used to estimate richness versus being used to assess training progress. We acknowledge in advance that the example is contrived, as thought experiments are wont to be. Neverthe-less, it serves to illuminate the nature of the problem that we are addressing.
Imagine for a moment a collection of documents in which every document is in a different language. Do a random sample on that collection and route each document to a language-appropriate reviewer. With such reviewers, a rele-vance assessment can be performed and a relative proportion of relevant documents calculated; collection richness can be estimated. However, as every document in the collection is in a different language, no words will be shared in common between any documents (whether between documents in the control set, documents in the remainder of the collection, or both). Any classifier that is learned by training on docu-ments in the collection will not be able to rank or classify the documents in the control set, because they do not share any terms in common. Whether the learned classifier is of high or low quality, whether it is stable or unstable, is some-thing that the control set will not be able to detect. Thus, just because the control set sample is randomly drawn does
not mean that it will be representative enough to monitor training progress.
A second motivation comes from Cormack & Grossman [5]. In that work, three learning and review protocols were compared: Simple Passive Learning (SPL), Simple Active Learning (SAL), and Continuous Active Learning (CAL). These protocols can be characterized along two dimensions: (1) simple vs continuous, and (2) passive vs active. The first dimension can be characterized by whether the training of supervised machine learning systems is halted relatively early in the process (simple) or whether training continues until all (or proportionally all) relevant documents are found (continuous). The second dimension can be characterized by whether an algorithm does (active) or does not (passive) se-lect the documents that it believes to be the most effective for moving the overall process forward. In general, passive selection is defined as any selection mechanism that is not active. In the paper, however, passive selection was imple-mented as simple random sampling.
The researchers found that the continuous protocols out-performed the simple protocols and that the active protocols outperformed the random sampling (n´ee passive) protocols. While the primary focus of [5] is on the training and review protocols themselves rather than on metrics for assessing the progress of that training and review (aka the stopping criteria), we began to suspect that there might be an inter-esting parallel. If random sampling was the least effective among the training protocols, might it have problems as the foundation for a progress metric?
One hypothesis for why random sampling is not the most effective as a training protocol is that it does not topically cover the collection in a way that some of the more active methods do. If true, then might not that be problematic for random sampling as a foundation for control sets, as well? In this paper, we do a simple exploratory data analysis of a randomly-selected control set based progress metric as an initial attempt to begin to answer this question.
3.
EXPERIMENTS
The following section describes the procedure by which we create the data for the exploratory analyses. At every point in a simulated e-discovery process two value are generated: (1) The value of the control set-based metric, in this case maximum F1 on the control set, and (2) The actual amount of effort, the combined total of both expended and remaining effort, to achieve the target, in this case 75% recall. With these two data points we may investigate the relationship between what the metric shows and what actually is.
The data set used for this exploratory analysis is Topics 201 and 202 from the TAR Toolkit [2]. It should be noted that in [5], The TREC participant judgments (rel.201.fil andrel.202.fil) are used for training and the official TREC judgments (prel.201andprel.202) are used for gold stan-dard evaluation. In our work, we use the TREC participant judgments for both training and final evaluation. The aver-age rate of learning and final outcome (effort to 75% recall) was similar across both conditions, but because the latter was a bit richer it allowed for the plotting of more data points.
In this work we present two main analyses. The first in Section 3.1 shows what happens when the size of the control set is varied, from a 500 document random sample up to an 8000 document random sample. The second in Section 3.2
shows what happens when the size of the control set is fixed (at 1000 documents), but the random sample itself is varied.
3.1
Varied Control Set Sizes
3.1.1
Experiment Setup
The first experiment involves varying the size of the con-trol set. The following process is used to generate simulation data points. The fileranfilis a random ordering of the en-tire collection and is available in the TAR Toolkit. The fileszz201andzz202are random orderings of the keyword search hits for each topic, respectively, as outlined in [5]. When documents are selected from these files, they are se-lected in the order listed in the files. Thus, as the order was randomly generated this selection is random, but also allows for the possibility of reproducibility [1].
1: Select matter (201 or 202)
2: Select control set sizek∈ {500, 1000, 2000, 4000, 8000} 3: Create the control set by selecting the firstkdocuments
fromranfil
4: Initialize the training set by selecting the first 100 doc-uments (”seeds”) from (zz201 or zz202) that are not already members of the control set
5: Infer a classifier (ranker) using the documents in the training set
6: Rank the control set using the classifier (ranker) and calculate the maximum F1 over this ranking
7: Rank the remainder of the collection using the classifier (ranker) and calculate the total effort to get to 75% recall 8: Create the data pointhx, yiusing Line 6 asx, and Line 7
asy; append the data point to an ordered list
9: Select the 100 highest rank documents from Line 7 that are not already members of the training set or control set and add them to the training set
10: If the combined number of responsive documents in the training set and control set is equal or greater than the number of documents necessary to achieve 75% recall, stop and return the ordered data point list. Otherwise, continue iterating by returning to Line 5.
There are a number of details to consider. For example, the total effort to get to 75% recall (Line 7) is a combination of the relevant documents already found in the training and control sets, plus the depth in the ranking over the as-yet unjudged portion of the collection at which is found that rel-evant document that puts the combined total at 75%. Since the control set is created before the initial training (”seed”) set, and the control set size across various runs increases, there is a chance that the documents in the seed set will not be the exact same ones from run to run. Thus each condition is not held completely constant. This could be al-leviated by creating the seed set before creating the control set, but then there would be a chance that the control set in each condition would be slightly different, thus also not con-stant. As there is ultimately no way around the problem of slight differences due to different control set sizes, we chose to create the control set first as this is the more common approach among e-discovery practitioners.
We also note that what is described here is essentially the CAL protocol [5] but with the addition of a control set whose members do not participate in training the algorithm. And whereas [5] created a seed set of 1000 documents with
1000 documents selected at each iteration, our simulation only uses 100 documents as seeds, with 100 documents se-lected at each iteration. The main reason for the reduction in selection sizes to allow for the plotting of more points, though we . We run the algorithm until 75% recall is hit rather than for a fixed number of iterations. Again, as the goal of this work is an exploratory analysis rather than a final algorithm for detecting stopping conditions, we assume an oracle knowledge of the state of the process.
Finally, we should note that the algorithms used to do the ranking do not come from the TAR toolkit [2], but rather from our proprietary quiver of ranking techniques. We did not investigate multiple algorithms, but it is certainly a pos-sibility that the ranking algorithm could have an effect on the results. However, since the purpose of this work is not to examine absolute ranking algorithm effectiveness but in-stead to investigate control set-based fidelity to actual task progress, the choice of ranking algorithm should not matter. A good metric should be able to successfully discriminate between progress and lack thereof, no matter the ranking algorithm.
In addition to the aforementioned control set-based runs we do one final exploratory comparison. Instead of using a control set to monitor the progress of the e-discovery process, we investigate the possibility of a ”rank change” metric that does not rely on having any document judgments:
1: Select matter (201 or 202)
2: Create a default ranking of the entire collection 3: Initialize the training set by selecting the first 100
doc-uments (”seeds”) from (zz201orzz202)
4: Infer a classifier (ranker) using the documents in the training set
5: Rank the remainder of the collection using the classi-fier (ranker) and calculate the total effort to get to 75% recall,
6: Calculate the change between the rankings in Line 5 and Line 2
7: Create the data pointhx, yiusing Line 6 asx, and Line 5 asy; append the data point to an ordered list
8: Select the 100 highest rank documents from Line 5 that are not already members of the training set and add them to the training set
9: If the number of responsive documents in the training set is equal or greater than the number of documents necessary to achieve 75% recall, stop and return the or-dered data point list. Otherwise, continue iterating by returning to Line 5.
Unfortunately, the exact details of the default ranking (Line 2) and rank change (Line 6) calculations cannot be disclosed, but the basic procedure is simple: At the begin-ning of the e-discovery process, a default or neutral ranking of the collection is created. Then, when more documents are added to the training set and the collection is re-ranked us-ing those trainus-ing documents, the new rankus-ing is compared against the default ranking. The measure of how different the two rankings are, i.e. the ”change” between the current ranking and the default ranking, is used in place of a max-F1, control set-based metric. In this approach, not only do no manually-judged documents need to be held out from training, but no additional effort to judge those documents is necessary.
3.1.2
Results
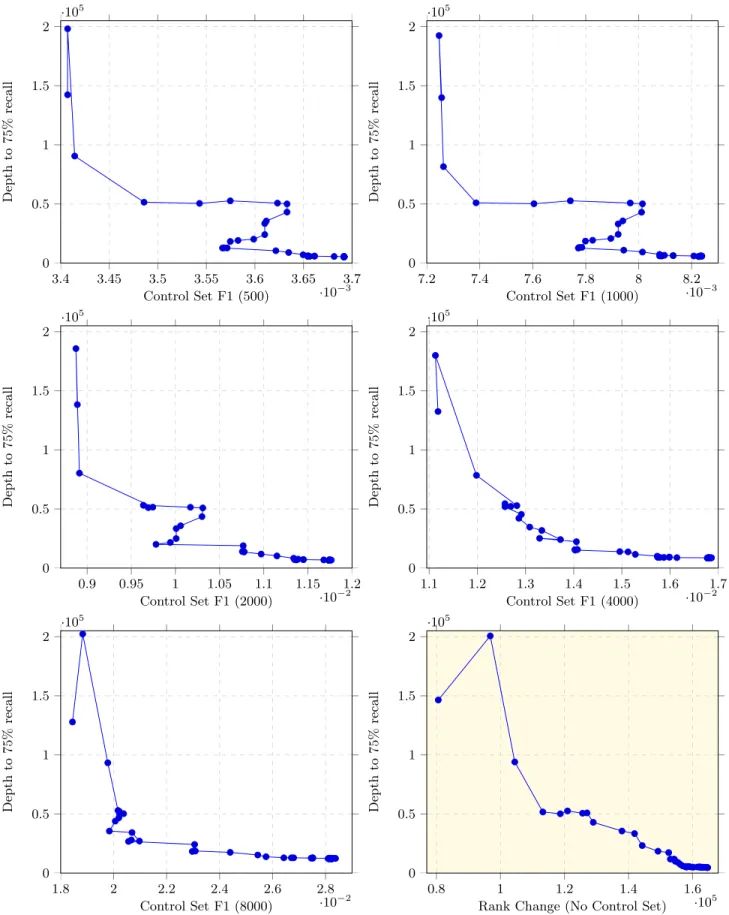
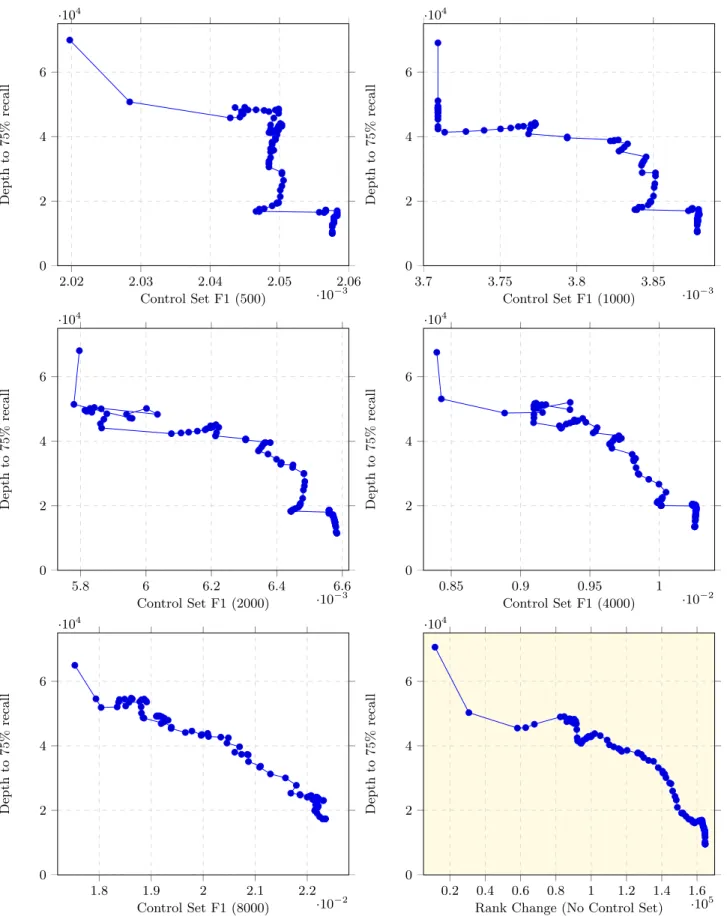
The results of this first analysis are found in Figures 1 and 2. Along the x-axis are the progress metric scores (whether max-F1 on control sets or rank change across the entire collection), and along the y-axis is the total effort to 75% recall, inclusive of the all relevant documents found to that point, including relevant documents in the control set if one has been used. Lines between the points indicate it-erative sequentiality.
A desirable property in a progress metric is that when the metric shows improvement the actual state is improving, and when the metric shows lack of improvement, perhaps even degradation, the actual state is also not improving, perhaps even degrading. In other words, we postulate that a good metric, when visualized in the manner shown in Fig-ures 1 and 2, will have a diagonal slope, downward and to the right. Movement along one axis should correlate inversely with movement along the other axis.
However, from the figures, we see that many of the control set-based metrics, especially at k=500 and 1000, some of the lower sizes often used in practice, do not conform to this diagonal behavior. At certain points in the iteration the plot is vertical: there is virtually no movement along the x-axis (no change in the metric), but vast changes in the actual state of the process, the effort required to get to 75% recall. At other points the plot is horizontal: there are vast changes (improvements) in the metric itself, but little actual change in the effort needed to get to 75% recall.
There is even strong visual evidence that at certain points, the max-F1 control set metric shows the process getting worse at the same time that in reality it is getting bet-ter. The diagonal is sloped in the wrong direction, an anti-correlation. This is most evident for Topic 201 (Figure 1 with control sets of size 500, 1000, and 2000) and for Topic 202 (Figure 2 with control sets of size 500, 1000, 2000, and to a lesser extend 4000). Clearly this is problematic if such a metric is being used to assess algorithm training progress. Generally, as the size of the control set increases the quality of the metric increases as well. However, the improvement is not always monotonic. For example, for Topic 201 the 4000 document control set is slightly more diagonal than the 8000 document control set.
In comparison, the rank change approach appears to be competitive with some of the larger control sets. There are still small, local pockets of non-diagonal (horizontal and ver-tical) relationships between the rank change metric and ac-tual task progress, but in general the visual relationship ex-hibits the desired property of improvement along one axis correlating with improvement along the other.
However, as this is an early stage exploratory analysis, one should not draw too many conclusions from the finer details in these figures. Nevertheless, at a broad level, the patterns in these figures indicate that measuring e-discovery progress using a max-F1 based control set may not be the most effective approach and that alternatives to control set approaches may be possible.
3.2
Varied Random Samples
3.2.1
Experiment Setup
In the second experiment we vary the documents in con-trol set itself, rather than the size of the concon-trol set. The same procedure as in Section 3.1.1 for generation of data
3.4 3.45 3.5 3.55 3.6 3.65 3.7 ·10−3 0 0.5 1 1.5 2 ·105 Control Set F1 (500) Dep th to 75 % rec a ll 7.2 7.4 7.6 7.8 8 8.2 ·10−3 0 0.5 1 1.5 2 ·105 Control Set F1 (1000) Dep th to 7 5% rec a ll 0.9 0.95 1 1.05 1.1 1.15 1.2 ·10−2 0 0.5 1 1.5 2 ·105 Control Set F1 (2000) Dep th to 75 % rec a ll 1.1 1.2 1.3 1.4 1.5 1.6 1.7 ·10−2 0 0.5 1 1.5 2 ·105 Control Set F1 (4000) Dep th to 7 5% rec a ll 1.8 2 2.2 2.4 2.6 2.8 ·10−2 0 0.5 1 1.5 2 ·105 Control Set F1 (8000) Dep th to 75 % rec a ll 0.8 1 1.2 1.4 1.6 ·105 0 0.5 1 1.5 2 ·105
Rank Change (No Control Set)
Dep th to 7 5% rec a ll Figure 1: Topic 201
2.02 2.03 2.04 2.05 2.06 ·10−3 0 2 4 6 ·104 Control Set F1 (500) Dep th to 7 5% rec a ll 3.7 3.75 3.8 3.85 ·10−3 0 2 4 6 ·104 Control Set F1 (1000) Dep th to 7 5% rec a ll 5.8 6 6.2 6.4 6.6 ·10−3 0 2 4 6 ·104 Control Set F1 (2000) Dep th to 7 5% rec a ll 0.85 0.9 0.95 1 ·10−2 0 2 4 6 ·104 Control Set F1 (4000) Dep th to 7 5% rec a ll 1.8 1.9 2 2.1 2.2 ·10−2 0 2 4 6 ·104 Control Set F1 (8000) Dep th to 7 5% rec a ll 0.2 0.4 0.6 0.8 1 1.2 1.4 1.6 ·105 0 2 4 6 ·104
Rank Change (No Control Set)
Dep th to 7 5% rec a ll Figure 2: Topic 202
points during a simulation is followed except for two key differences. The size of the control set in Step (2) is set to 1000 each time, and the control set itself is selected via a simple random sample that is generated on the fly, rather than from the ordering inranfil. Furthermore, simulation is repeated 25 times per topic to get a sense of what effect different randomly selected control sets have on the relation-ship between max-F1 and actual performance.
3.2.2
Results
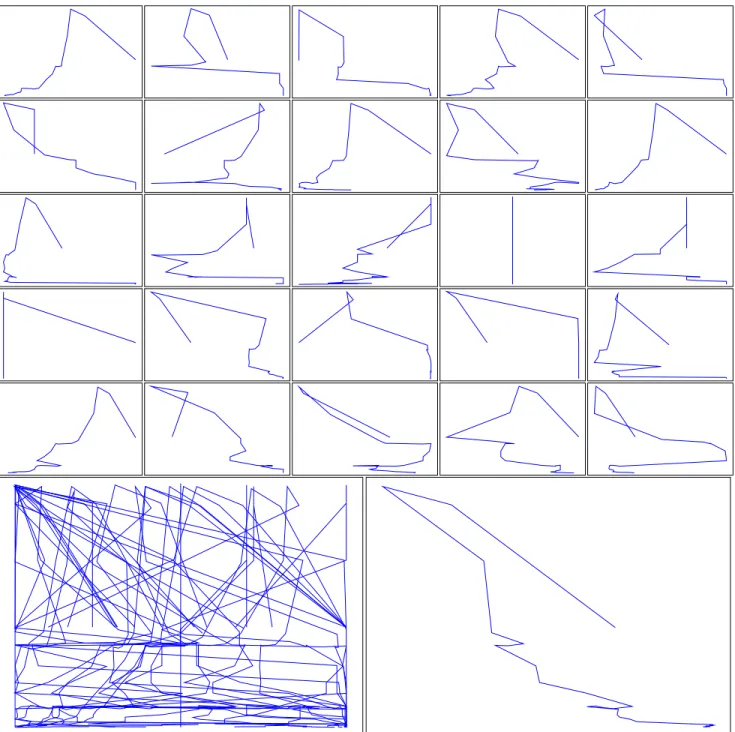
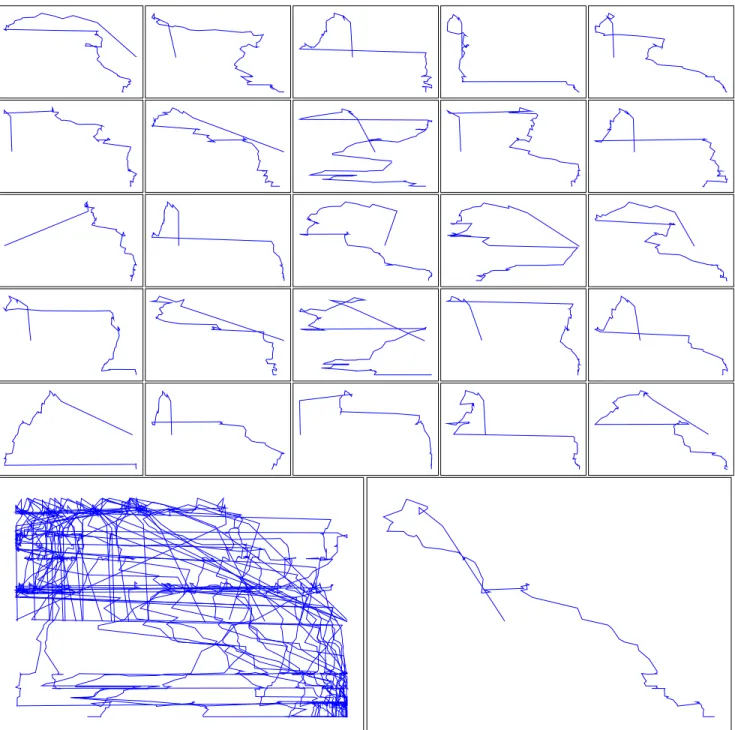
The results for these simulations are found in Figures 3 and 4. For each 1000 document control set simulation, a plot of the relationship between max-F1 and actual task progress is shown. In the interest of space, axes are not labeled and minimum and maximum values are normalized to a [0..1] range to create consistency in the visualization. These individual runs are shown in a 5x5 grid, which we refer to via the x-y coordinates (1,1) for the upper left hand corner and (5,5) for the lower right. Additionally, these 25 runs are overlayed in the larger plot on the bottom left and each <x,y> value from the 25 runs is averaged together, renormalized, and plotted in the larger graph on the lower right.
The first and most interesting observation about these repeated trials is that, on average, max-F1 based control sets do have the desired relationship to actual task progress, as one would hope. In general, when (average) max-F1 gets better, so does progress toward task completion, and vice versa. However, the standard deviation is so large as to be of little practical use. For Topic 201, the average standard deviation across all points in the simulation is 0.375, with slightly higher (rather than lower) standard deviation as the task nears completion. Topic 202 is slightly better: The average standard deviation is slightly lower at 0.26, with the largest deviations in the middle stages of the task. But in both cases the variation between control sets is unacceptably high.
This is illustrated visually in the 25 individual simulation plots for each topic. For example, in Topic 201, the plots in x-y positions (1, 2) and (2, 5) look reasonable and useful, i.e. they generally have the desired shape in which there is a positive correlation between max-F1 and task progress. However, over twice as many control sets have exactly the opposite behavior. The runs at (1, 1), (4, 1), (3, 2), (5, 2), (1, 5), and (3, 3) show a strong negative correlation between max-F1 and task progress; the worse max-F1 gets on the control set, the more the actual task is making progress to-ward completion. The remainder of the runs are somewhere in the middle, with no clear relationship between the two values. There are also many horizontal and vertical lines at various phases of many of the simulations, which lines are not dual endpoint jumps but series of many horizontally or vertically aligned points. Horizontal sequences indicate change in max-F1 but no change in actual task progress, while the vertical sequences indicate change in actual task progress but no change in max-F1. Both relationships are undesirable in a progress metric.
In Topic 202, the control sets in (1, 1), (5, 1), (2, 2), (3, 3), and (5, 3) have the desired correlation, but the remaining control sets either run backward (e.g. (1, 5)) or are all over the map (e.g. (3, 2)).
Once again, it is encouraging to note that the average val-ues, across all 25 runs per topic, generally have the desired
property of a positive relationship between max-F1 and task progress. However, we are not interested in average behav-ior, because in real world e-discovery a practitioner is not going to take 25 different random samples of a thousand documents apiece. In practice, only one control set will be created.
One may get lucky and create a control set that has the desired properties. Or, one may get unlucky and create a control set, the max-F1 metric over which will tell the user to stop much earlier than one should. On this collection, that translates to tens of thousands of documents of additional effort. For Topic 201 under these simulations, there appears to be only a 252 = 8% chance of getting a good control set random sample, whereas for Topic 202 there is a 5
25 = 20%
chance. While the latter is better, neither is desirable in the high stakes, high cost e-discovery area.
3.3
Control Set Opportunity Cost
There is another potential issue in using control sets to monitor e-discovery progress beyond the imperfect fidelity to the underlying reality. And that is the cost of creating the control set itself, both actual cost and opportunity cost. By cost, we mean the number of documents that need to be judged in order to complete the task.
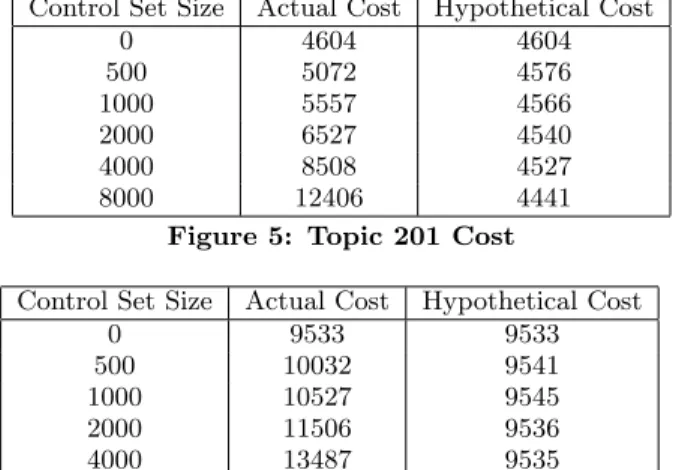
For this final experiment, we run the iterative simulations described in Section 3.1 until 75% recall is hit. In Figures 5 and 6 we present two sets of data points for each topic and control set size (including the size zero rank change ap-proach). The second column is the actual effort to get to 75% recall, which effort includes the documents (both rele-vant and non relerele-vant) that are judged as part of the creation of the control set, if applicable. The third column is the hy-pothetical effort to get to 75% recall, which effort includes only the relevant documents that are judged as part of the creation of the control set, if applicable.
There is an assumption for this experiment that the progress metric across all conditions can accurately predict the point at which 75% recall is hit, an assumption that is not going to perfectly hold in practice, and might be more or less true depending on the metric or the control set size. With that caveat, however, the results show that, especially for these low richness topics, having to judge thousands of documents to create a control set significantly adds to the overall cost of getting to 75% recall. With a control set of size 8000, for example, the cost is almost doubled for Topic 202 and almost tripled for Topic 201.
This is of course not very surprising, so we turn our at-tention from the actual cost to the hypothetical, or opportu-nity, cost. Unlike in traditional supervised machine learning in which finite training data is used to induce a function, which function is then used to label an indefinite number of future examples, in the e-discovery domain the number of ”future” examples is finite. The goal in e-discovery is to find relevant documents in a finite collection, not to be ready to correctly classify an infinite number of possible exemplars.
Given this finite nature, there is always the possibility that relevant document that are withheld from training for the purpose of monitoring e-discovery progress could affect the ability of the system to find additional relevant documents. Withheld training exemplars may mean fewer opportunities to be led by example to those relevant pockets of informa-tion.
worth considering. In the third column of Figures 5 and 6, we show the hypothetical number of documents that need to be examined to get to 75% recall if the relevant doc-uments in the control set are withheld from training and the non relevant documents in the control set do not count against total cost. This quantity is determined simply by subtracting from the actual cost the number of non relevant documents in the control set. Thus, the relevant documents in the control set still count toward recall, but neither rele-vant or non relerele-vant documents in the control set are used for training.
The idea is that by counting the relevant documents in the control set toward recall but not using either the relevant or non relevant control set documents for training, we may be able to conclude that there is an opportunity cost to remov-ing documents from trainremov-ing for the purpose of creatremov-ing a control set beyond just the document judgment cost itself. If it takes longer to get to 75% recall while certain docu-ments are withheld from training, then control sets could be problematic for other reasons.
This is what we mean by hypothetical effort. In a sense, it is an unfair comparison because the conditions with larger control sets get more relevant documents ”for free”. At the same time, those same conditions have more relevant doc-uments that cannot be used for training. This is perhaps not an ideal procedure but there is no easy way to do a hypothetical comparison.
However, as the third column in Figures 5 and 6 show, not having those additional control set documents for training does not seem to have much of an effect. Differences in hy-pothetical effort are (at worst) no more than 3-4% for Topic 201 and 0.6% for Topic 202 in comparison to the non-control set approach, with the larger control sets actually coming out a bit ahead. Nevertheless, the differences are small, and uncertainty around the effect of the ”for free” relevant con-trol set documents likely outweigh the slight differences. We conclude that opportunity cost due to not being able to use relevant control set documents for training is minimal, at least for these two matters.
Future work might consider a qualitative measurement of the final result, and not just a quantitative one. For exam-ple, even if 75% recall is achieved, might there be documents in the control set that are of a subtopic only represented in the control set, and missing in the found documents from the remainder of the collection?
4.
LIMITATIONS AND FUTURE WORK
There were a number of factors that limit the scope of this work. First, we only compared two topics. Results for Topics 203 and 207 in the TAR Toolkit were similar, but the need to present full graphical comparisons for the ex-ploratory data analysis rather than summary statistics was checked by limited available space to present those results.
A second limitation is that the analyses done assumed that iteration concluded once 75% recall was achieved, which is a post hoc rather than an in situ conclusion. The analyses only showed general relationships between the various met-rics and the actual state of the e-discovery process; they did not boil those relationships down to an actionable hard de-cision boundary. Nor did we examine the actual state of the e-discovery process in terms of anything but effort to 75% recall. Future work may want to consider other, perhaps higher, recall points.
A third limitation is the control set metric itself. We tested max-F1 on a control set ranking and found that it did not always correlate well with the actual state. We hy-pothesized that this lack of correlation was due to random sampling not topically covering the collection. However, per-haps the fault lies not in the nature of the control set, but in the metric overlayed on that set. Perhaps a metric such as mean average precision (MAP) might correlate better with the actual state. This remains to be explored.
By the same token, perhaps max-F1 is a plausible metric, but that a passive, random sampling approach to assem-bling the control set might not work as well as a more active approach, just as SAL approaches work better than SPL approaches for training [5]. Not all active learning is uncer-tainty sampling; some active learning is density based [3]. These same density techniques may work better for assem-bling control sets than does random sampling. Again, the goal of a control set is not (necessarily) to estimate rich-ness; it is to monitor the progress of training. So there is no necessary reason why documents in a control set need be assembled randomly; as the goal is simply for the set to accurately and consistently measure progress. Of course, the same analyses would need to be performed on active-learning based control sets, examining correlations between such approaches and actual state.
Finally, this work assumes that the document collection is static. In real world e-discovery documents often continue to arrive past the point that training and review, not to mention the creation of control sets, have begun. What effect rolling collection has on these measures, both their creation and use, is an interesting future direction.
5.
CONCLUSION
A popular approach in measuring e-discovery progress in-volves the creation of a control set, holding out randomly se-lected documents from training and using the quality of the classification on that set as an indication of progress on or quality of the whole. In this paper we do an exploratory data analysis of this approach and visually examine the strength of this correlation. We found that the maximum-F1 control set approach does not necessarily always correlate well with overall task progress, calling into question the use of such approaches. Larger control sets performed better, but the
Control Set Size Actual Cost Hypothetical Cost
0 4604 4604 500 5072 4576 1000 5557 4566 2000 6527 4540 4000 8508 4527 8000 12406 4441
Figure 5: Topic 201 Cost
Control Set Size Actual Cost Hypothetical Cost
0 9533 9533 500 10032 9541 1000 10527 9545 2000 11506 9536 4000 13487 9535 8000 17369 9478
human judgment effort to create these sets have a significant impact on the total cost of the process as a whole.
In comparison we also examine an approach that measures progress without using a control set. Instead, it ranks the entire collection at every round and measures the relative change in ranking between each new ranking and a default initial ranking. This latter approach performed commen-surately with the larger control set approaches, but at no additional human review cost.
Finally, we found relatively little difference between the various simulated runs in terms of the opportunity cost of leaving out from training the documents in the control set. However, the manner in which this opportunity cost was measured was slightly naive, and future work may need to consider other methods of assessing control set impact.
Making optimal decisions about when to halt e-discovery training (and review) is an important question, as it can have significant impact on the effectiveness or the cost of the final result, or both. This work does not completely solve the problem; rather it suggests that one way to ex-plore the quality of a proposed progress metric is through iterative simulation and exploratory analysis of the relation-ship between the metric and actual task state.
6.
ACKNOWLEDGMENTS
The author wishes to thank Cody Collier, Cameron Laird, David Lewis, and John Tredennick for their helpful com-ments on early drafts of this work. Any remaining problems or limitations are solely the fault of the author.
7.
REFERENCES
[1] A. Bellogin, P. Castells, A. Said, and D. Tikk. Report on the workshop on reproducibility and replication in recommender systems evaluation (repsys).SIGIR Forum, 48:29–35, 2014.
[2] G. Cormack. Tar toolkit.
http://cormack.uwaterloo.ca/cormack/tartoolkit, 2014. [3] G. V. Cormack and M. R. Grossman. Evaluation of
machine learning protocols for technology-assisted review in electronic discovery. InProceedings of the ACM SIGIR Conference, Gold Coast, Australia, 6-11 July 2014, Gold Coast, Australia, 2014.
[4] J. W. Tukey.Exploratory Data Analysis. Pearson, Connecticut, USA, 1977.
[5] J. Zhu, H. Wang, T. Yao, and B. K. Tsou. Active learning with sampling by uncertainty and density for word sense disambiguation and text classification. In Proceedings of the 22nd Interational Conference on Computational Linguistics (Coling 2008), pages 1137–1144, Manchester, UK, 2008.