Citation for published item:
Xiao, Hao and Pei, Wei and Deng, Wei and Kong, Li and Sun, Hongjian and Tang, Chenghong (2020) 'A comparative study of deep neural network and meta-model techniques in behavior learning of microgrids.', IEEE access., 8 . pp. 30104-30118.
Further information on publisher's website:
https://doi.org/10.1109/ACCESS.2020.2972569Publisher's copyright statement:
This work is licensed under a Creative Commons Attribution 4.0 License. For more information, see https://creativecommons.org/licenses/by/4.0/
Use policy
The full-text may be used and/or reproduced, and given to third parties in any format or medium, without prior permission or charge, for personal research or study, educational, or not-for-prot purposes provided that:
• a full bibliographic reference is made to the original source
• alinkis made to the metadata record in DRO
• the full-text is not changed in any way
The full-text must not be sold in any format or medium without the formal permission of the copyright holders. Please consult thefull DRO policyfor further details.
Durham University Library, Stockton Road, Durham DH1 3LY, United Kingdom Tel : +44 (0)191 334 3042 | Fax : +44 (0)191 334 2971
A Comparative Study of Deep Neural Network
and Meta-Model Techniques in Behavior
Learning of Microgrids
HAO XIAO 1,2, (Member, IEEE), WEI PEI 1,2, (Member, IEEE), WEI DENG1,2, (Member, IEEE), LI KONG1,2, HONGJIAN SUN 3, (Senior Member, IEEE), AND
CHENGHONG TANG4, (Senior Member, IEEE)
1Institute of Electrical Engineering, Chinese Academy of Sciences, Beijing 100190, China
2School of Electronic, Electrical, and Communication Engineering, University of Chinese Academy of Sciences, Beijing 100049, China 3Department of Engineering, Durham University, Durham DH1 3LE, U.K.
4NARI Group Corporation, Nanjing 211106, China
Corresponding author: Wei Pei ([email protected])
This work was supported in part by the National Natural Science Foundation of China under Grant 51607170 and Grant 51777202, and in part by the National Key Research and Development Program of China under Grant 2017YFE0112600.
ABSTRACT Behavior learning of microgrids (MGs) is a necessary and challenging task for multi-MGs cooperation and energy pricing of distribution energy market. With the increasing demand for user privacy, this problem becomes more severe because of much less limited access to device parameters and models behind the Point of Common Coupling (PCC), which hinders conventional model-based power management methods. In this paper, to address this problem, some novel model-free data-driven methods including Deep Neural Network (DNN) and Meta-model techniques, such as Radial Basis Function (RBF), Response Surface Methods (RSM), and Kriging methods are introduced. These methods can predict the behavior of MGs through continuous iterative learning by accessing merely the historical active power measurements at the PCCs as well as public electricity price and weather information behind the PCCs, without full system identification and no prior knowledge on the system. A comparative study has been fully carried out by comparing with the conventional model-based model to better understand their advantages, drawbacks and limitations. The validity and applicability of the proposed methods is verified by numerical experiments. This paper can provide some references for future MGs interactive operation under incomplete information.
INDEX TERMS Data-driven method, artificial neural network, meta-model techniques, micro-grids behavior learning.
I. NOMENCLATURE
SETS AND INDICES
Pis set of solar irradiance data
Pws set of wind speed data
PT set of temperature data γP set of electricity price data
K set of random variables for sampling M set of PCC power data
ACRONYMS
MG Microgrid
PCC Point of Common Coupling
The associate editor coordinating the review of this manuscript and approving it for publication was Salvatore Favuzza .
DNN Deep Neural Network RSM Response Surface Methods RBF Radial Basis Function DG Distributed Generator DR Demand Response ESS Energy Storage System ANN Artificial Neural Network DSO Distribution System Operator KDE kernel density estimation PDF probability density function
CDF cumulative probability distribution function LHS Latin Hypercube Sampling
RMSE root mean squared error LSTM Long Short-Term Memory RL Reinforcement learning
ρij correlation between the row i and row j of
matrix
Pkmeta Predictive power by weighting sum of RSM, RBF and Kriging surrogated models. MRSMk Predictive power by RSM model. MRBFk Predictive power by RBF model MKrigingk Predictive power by kriging model
AS,k+i∗24 Data at thek-th time interval for thei-th day
st Current state at timetfor RL
at Current action at timetfor RL
II. INTRODUCTION
Microgrids (MGs) as an aggregate of Distributed Genera-tors (DG), Renewable Energy Resources (RES), Demand Response Loads (DR) and Energy Storage Systems (ESS), has excellent potential and controllability to participate in energy market services through the optimal coordination operation of DG, RES, DR and ESS [1]. In order to realize effective interaction operation between MGs and the distri-bution network, and to achieve reasonable energy pricing, fast and accurate MG behavior prediction is the primary key However, predicting the behavior of MGs is evolving into an increasingly challenging task for utilities in recent years. The main difficulty is that utilities generally have limited access to real-time asset behaviors and models behind the Point of Common Coupling (PCC) with MGs. This problem becomes more severe with the increasing demand for user privacy [2]. Hence, how to deal with this challenge is an urgent issue that needs to be taken in distributed network operation and energy market design.
Traditionally, the behavior prediction of MGs are formulated by the model-based power management methods [3], [4], there have been substantial efforts to inves-tigate the optimal calculating of PCC power in the literature, including heuristic techniques [5], [6], nonlinear program-ming methods [7], [8], and distributed optimization meth-ods [9], [10]. However, these power management methmeth-ods all highly depend on the full system operator’s knowledge of MG operation behind the PCC and customers’ private data, which compromise the data ownership of MGs. Moreover, they have much of disadvantages. Such as: (1) Depending on ideal physical model and experience, the timeliness is poor. (2) Rules are formulated based on fixed model and typical operation mode, their inability to adapt to constantly-changing system conditions when the amount of measurement data is limited. (3) Energy model and control mode need to be greatly simplified and approximated to
merely the active power measurements at the PCCs as well as public weather information and public electricity price information behind the PCCs, without full system identifi-cation and no prior knowledge on the system. There have been some useful preliminary exploration on the prediction of renewable energy generation, or on stability evaluation of power system, etc. Such as the utilization of ANN to forecast short-term load demand for MGs [11], prediction of uncertain factors [12], [13], utilization of RSM to approxi-mate the critical damping ratio of MGs [14]. However, for the behavior learning of MGs, there are strong uncertainties included in both power source side and load demand side, also, there exists complex energy management strategies in MGs. Moreover, due to the existence of energy storage and transferable loads, complex time-coupling relationship will be existed for MGs participates in demand response, thus the behavior characteristic of MGs will be more complex and difficult to predict than DGs.
To the best of authors knowledge, the behavior predicting of MGs with strong uncertainties and incomplete information under complex energy management strategies have not yet been fully studied. In addition, a comparative study in testing various model-free data-driven methods to better understand their scope of applications are also not properly addressed.
Based on the above challenges and motivations, In this paper, several recently introduced model-free data-driven methods, including DNN, RL, RBF, RSM, and Kriging in predicting the real-time behavior of MGs under incomplete information are carried out, the validity of the proposed method is verified by numerical experiments, especially, a comparative study is comprehensively implemented by compared with conventional model-based optimal methods, the main contributions of this paper can be listed as follows: 1) A series of novel model-free method for predicting the real-time behavior of MGs are developed with access only to the historical active power measurements at the PCCs as well as public electricity price and weather information behind the PCCs, thus can handle the current limitations raised from data privacy and data ownership.
2) A comparative study has been firstly carried out to compare novel DNN, RL and Meta-model techniques with the conventional model-based model in behavior learning of MGs under incomplete information, provided a better under-standing of their advantages, drawbacks and limitations for future MGs interactive operation.
The remainder of this paper is organized as follows. Section II presents the proposed data-driven based prediction mechanism for MGs behavior learning, which consists of the
FIGURE 1. Proposed data-driven based MG behavior predicting architecture.
behavior predicting architecture and the data preprocessing method. Behavior learning method for MGs using DNN, RL, RBF, RSM, and Kriging are discussed in Section III. Two cases are tested and different data-driven methods are compared comprehensively in Section IV, followed by the conclusions in Section V.
III. NOVEL DATA-DRIVEN BASED PREDICTION MECHANISM FOR MG BEHAVIOR LEARNING
A. DATA-DRIVEN BASED MG BEHAVIOR PREDICTING ARCHITECTURE
Considering the future MGs interactive operation under incomplete information, model-based solutions will be dif-ficult to apply for their requirement of completely observ-able and controllobserv-able information, thus in this paper, a novel data-driven based MG behavior predicting architecture is proposed, as shown in Fig. 1.
In the upper level is the operation management layer, the distribution system operator (DSO) takes the role to opti-mize the pricing, realize market clearing and overall optimal operation only by observing the response of MGs to exter-nal sigexter-nals at their PCCs, in our novel data-driven based prediction mechanism, DSO or MG will train a black box meta-model or neural network that describing the interac-tive behavior of the other MGs merely through the avail-able active power measurements at the PCCs and the public historical data information, such as the statistical electricity price, local solar irradiance, wind speed and temperature information that independent of the MGs. Therefore, it is possible to predict the tie-line power of MG without knowing the internal units and parameters, and it is possible to better
FIGURE 2. Principle of non-parametric kernel density estimation (KDE) method [16].
implement the interactive operation between multi micro-grid (MMG) or between MG and DSO under incomplete informa-tion. Moreover, by avoiding explicit MG modeling, the data-driven model becomes highly adaptable against changes in MG parameters which are excluded from MG’s state set.
In the bottom level is the multi-MGs physical layer, the MGs receive the external price information from the upper layer DSO, and then carried out optimal power management to maximum its own interest with internal energy manage-ment system (EMS).
B. DATA CHARACTERISTICS ANALYSIS BASED ON MACHINE LEARNING
Data characteristics analysis is the first key point for data-driven behavior learning, probability distributions with fixed parameters are often used to describe the stochastic charac-teristics of weather information, such as weibull distribution for wind speed, beta distribution for solar irradiance and so on. However, these methods are merely approximate fitting of the actual probability histogram, the fitting errors are large especially at the edges [15], meanwhile, the parameters of these probability distributions are difficult to obtain.
On this basis, this paper intends to introduce non-parametric kernel density estimation (KDE), an effective machine learning technique to mine the depth characteristics of weather data. Based on the sample data directly without any prior knowledge, KDE can achieve high-precision fitting on the basis of selecting the appropriate sliding window. The main principle is to estimate the distribution through the kernel function of each discrete interval (red dashed line in Fig. 2). The color dashed line (Blue Solid line in Fig. 2) is accumulated to approximate the equivalent histogram distri-bution interval. The calculation is shown in (1).
efh(x)= 1 2h #xi∈[x−h,x+h] N = 1 2Nh N X i=1 l(x−h≤xi≤x+h) = 1 Nh N X i=1 1 2l( x−xi h ≤1) (1)
FIGURE 3. The annual data of solar irradiance.
where, #xi∈[x−h,x+h] represents the number of samples
falling on the interval [x −h,x +h]. Let K
X−XID h = l(x−xi
h ≤1), then (1) can be rewrite as
e fh(x)= 1 Nh N X i=1 K X−X D I h ! (2)
where,K(·) represents the kernel function, commonly used kernels function include Gauss kernels function, rectangular kernels function and so on.
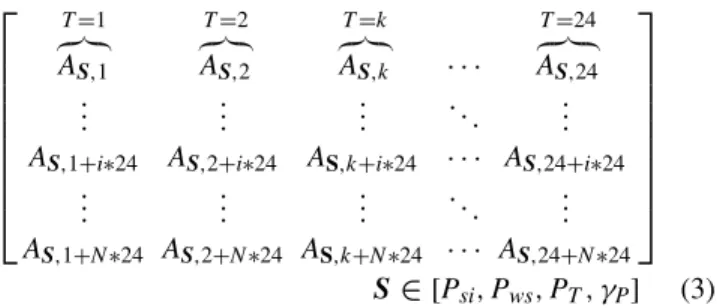
Taking the annual data of local weather information as well as local electricity price information as an example, we can first preprocess the annual data by classifying them with time interval, as shown in (3), and then analyze the statistical characteristics of each time interval with KDE separately.
T=1 z}|{ AS,1 T=2 z}|{ AS,2 T=k z}|{ AS,k · · · T=24 z }| { AS,24 ... ... ... ... ... AS,1+i∗24 AS,2+i∗24 AS,k+i∗24 · · · AS,24+i∗24 ... ... ... ... ... AS,1+N∗24 AS,2+N∗24 AS,k+N∗24 · · · AS,24+N∗24 S∈[Psi,Pws,PT, γP] (3)
where, AS,k+i∗24 represents the data at the k-th interval for
theith day,Sis the variable set, representing solar irradiance (Psi), or wind speed (Pwt), or temperature (PT), or electricity
price (γP).
Assume the annual data of solar irradiance and wind speed are shown in Fig. 3 and Fig. 4 respectively, the probability density function (PDF) and cumulative probability distribu-tion (CDF) of typical time interval obtained by KDE is shown in Fig. 5 and Fig. 6.
From Fig. 5 and Fig. 6, we can find that the proposed KDE method described the probability distribution characteristics of each time interval well, different from the traditional single peak approximation fitting of normal distribution or Weibull distribution with fixed parameters, the distribution function calculated by KDE method has the characteristics of multi peak and multi valley, more coincides with its histogram and has better fitting accuracy.
FIGURE 4. The annual data of wind speed.
FIGURE 5. Probability density function (PDF) of several typical time interval obtained by KDE.
FIGURE 6. Cumulative probability distribution (CDF) of several typical time interval obtained by KDE.
C. DATA ENHANCEMENT BASED ON LATIN HYPERCUBE SAMPLE METHOD
Considering the acquired data are often hard to exhaust and cover all kinds of possible scenarios, in order to ensure the data completeness of behavior learning in MG, effective data enhancement is necessary.
FIGURE 7. Principle of Latin Hypercube Sampling (LHS) Method.
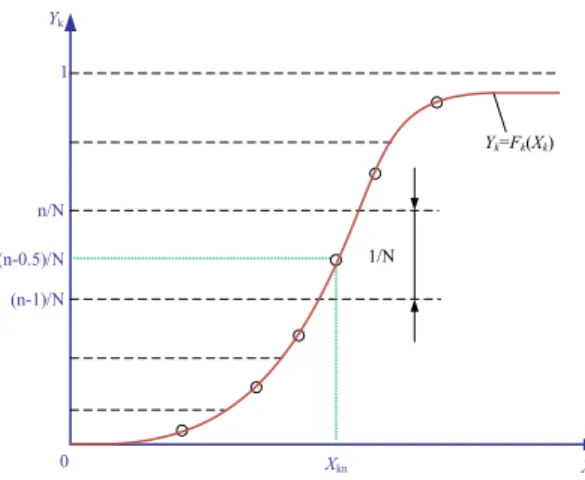
Data enhancement can be achieved by sampling with the probability characteristics of the acquired data, however the traditional random sampling method usually needs a large number of repeated sampling, and it is difficult to cover the whole sampling space. On this base, an effectively Latin Hypercube Sampling (LHS) method with good uniformity and orthogonally is proposed. As shown in Fig. 7.
Its basic principle is to discretize the range of cumulative probability distribution into several equal intervals, and then stratified sampling is carried out among each interval [17], thus to ensure the integrity and accuracy of sampling data as calculated by (4). Xkn=Fk−1 n−0.5 N n=1,2,· · · ,N (4) If the number of random variables isK, then the sampling matrix can be formed by (5).
XKN = X11 X12 · · · X1N X21 X22 · · · X2N ... ... ... XK1 XN2 · · · XKN (5)
For the directly sampled matrix XKN, there are usually
strong correlation among its rows [18], which is not suitable for the generation of diversified samples. To address this problem, cholesky decomposition algorithm is introduced in this paper to reduce the correlation of samples and improve the diversity of samples [19]. The main procedures are shown in Fig. 8.
The detailed calculation steps are described as follows: 1) Initialize the ranking matrixLKN, each row consisting
of random permutations of integer l, 2, 3. . .N.
2) Calculate the correlation between the rows ofLKN, and
obtain the correlation matrixDL as shown below.
ρij= PK k=1 Vik− ¯Vi Vjk− ¯Vj q PK k=1 Vik− ¯Vi 2PK k=1 Vjk− ¯Vj 2 (6)
FIGURE 8. Procedures of proposed algorithm to reduce the correlation of sample scenarios.
3) Use Cholesky decomposition method to calculate the nonsingular lower triangular matrix D for the correlation coefficient matrixDL, which satisfiedDD−1=DL.
4) Constructing matrix with less correlation GKN =
D−1LKN.
5) Reorder elements in matrixLKN based on the size and
position of elements inGKN.
6) Judge whether the relativity of ranking matrix LKN
meets the requirements.
7) If it does not meet the requirement, go back to step 2) to recalculate. Otherwise, updating the position of each element in the original sampling matrix based on matrixLKN.
Based on the PDF and CDF of wind speed and solar irradiance obtained, 500 new scenarios are generated with the proposed LHS and cholesky decomposition algorithm, as shown in Fig. 9 and Fig. 10. The iterative convergence process of cholesky decomposition method to reduce the correlation of sampling scenarios is shown in Fig. 11.
It can be seen from Fig. 9 and Fig. 10 that the enhancement scenarios of solar irradiance and wind speed are diverse enough, and basically fill the whole sampling space. From Fig. 11 we can find that the cholesky decomposition algo-rithm has a very good convergence property, the correla-tion converges after approximately 5 iteracorrela-tions, proved to be effective.
D. SCENARIO CLUSTERING WITH PSO ASSISTED K-MEANS METHOD
Repetitive learning of similar scenarios may be existed by directly using the above generated scenarios for learning,
FIGURE 9. 500 new solar irradiance scenarios generated by the proposed LHS and cholesky decomposition algorithm.
FIGURE 10. 500 new wind speed scenarios generated by the proposed LHS and cholesky decomposition algorithm.
FIGURE 11. Convergence process of cholesky decomposition algorithm.
in order to improve the learning efficiency, the typical cat-egories should be further determined for the generated sce-narios in section C.
Common used classification methods include fuzzy clus-tering, K-means clustering and so on [20], but these meth-ods all have difficulties in determining the number of clusters. To address this issue, this paper introduced a
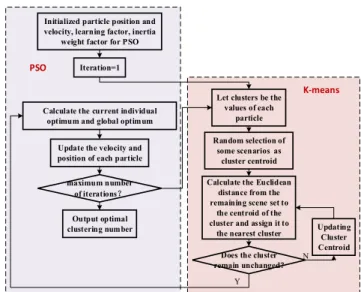
FIGURE 12. Procedures of proposed novel particle swarm optimization assisted k-means clustering algorithm (PSO-K-Means).
FIGURE 13. The clustering results for solar irradiance with PSO-assisted K-means clustering algorithm.
novel particle swarm optimization assisted k-means method (PSO-K-Means) to support quickly determination of opti-mal number of clusters. The flow chart of proposed PSO-K-Means algorithm is shown in Fig. 12, the PSO’s fast global search capability is fully utilized to help in finding the optimal number of cluster centers, through continuous iterative evaluation, ensure to find the best cluster center.
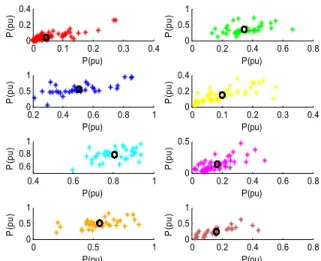
With the PSO-assisted K-means clustering algorithm, 500 wind speed and solar irradiance scenarios are clustered, the optimal clustering number determined by PSO-assisted K-means is 8. The clustering results for wind speed and solar irradiance are shown in Fig. 13 and Fig. 14 respectively. It can be seen from Fig. 13 and Fig. 14 that the proposed PSO-assisted K-means algorithm has good effect on sce-nario classification, and it can effectively identify cluster cen-ters, providing guarantee for improving training and learning efficiency.
FIGURE 14. The clustering results for wind speed with PSO-assisted K-means clustering algorithm.
IV. BEHAVIOR LEARNING OF MICROGRIDS USING DATA-DRIVEN METHODS
A. SURROGATED MODEL BASED BEHAVIOR LEARNING
Surrogated model, also known as meta-model, refers to the use of a large number of sampling points generated by exper-imental design to construct approximate simplified models by interpolation or fitting to replace complex simulation models for agents that are difficult to model or obtain model param-eters. Common used Surrogated include Response Surface Method (RSM), Radial Basis Functions (RBF) model, Krig-ing model and so on. Each meta-model has its own applicable scope.
1) RESPONSE SURFACE METHOD
Response surface methods (RSM) approximates functions by using the least squares method on a series of points in the design variable space [21]. Low order polynomials, such as the second order polynomials in (7) is widely used as the response surface approximating functions
ˆ y(x)=β0+ k X i=1 βixi+ k X i=1 βiixi2+ X i X j βijxixj (7)
where, β0,βi, βii,βij are parameters computed using least
squares regression by minimizing the sum of the squares of the deviations of predicted function values,eyis the predictive function values.
RSM can be easily constructed, and its smoothing capa-bility allows quick convergence of noisy functions in the optimization. However, this over-simplification may be trou-blesome for modelling highly non-linear or irregular behavior
2) KRIGING META-MODELS
Kriging is a type of meta-model based on spatial correlation functions. It is a stochastic model used to treat the determinis-tic computer response as a realization of a random function, with respect to the actual system response [22]. A Kriging
model postulates a combination of a polynomial model and the minor departure of the form:
ˆ
y(x)=f (x)Tβ+Z(x) (8) where, y(x) is the unknown function of interest,ˆ f(x) is a known polynomial function often taken as constant, and Z(x) is the correlation function which represents a stochastic process with mean at 0, varianceσ2, and nonzero covariance. Due to the wide range of correlation functions available, Kriging methods can provide accurate predictions of highly non-linear or irregular behavior.
3) RADIAL BASIS FUNCTIONS
Radial basis function (RBF) meta-model is another surro-gated model formed by linear combinations of a radially symmetric function based on the Euclidean distance between the sampled data point and the point to be predicted [23]. RBF was presented as an effective analytical method for representing irregular surfaces, the model can be expressed as in (9) and (10). f(x)=c0+c1x+ Xn i=1λiϕ (|x−xi|) (9) ϕ (x)=exp − x 2 2σ2 ϕ (x)= s 1+ x 2 σ2 (10)
where,c0,c1andλiare the parameters for radially symmetric
function computed by minimizing the Euclidean distance between the sampled data point and the point to be pre-dicted.ϕ (x)is the radially symmetric function. RBF prove to have good fits to arbitrary contours of both deterministic and stochastic response functions. It has been used success-fully in many engineering applications, including ocean depth measurement, altitude measurement, rainfall interpolation, surveying, mapping, geographic and geology, image warping, and medical imaging [24].
B. ARTIFICIAL INTELLIGENCE BASED BEHAVIOR LEARNING
1) DEEP NEURAL NETWORK
Deep neural network (DNN) is a data-driven method that does not rely on any analytical equations, but it utilizes voluminous existing data to formulate the mathematical problem and to approximate the solutions. DNN proved to have strong non-linear fitting ability. The recent years have witnessed the rapid advancement of deep neural network in a variety of applications, e.g., computer vision, machine translation, and remote sensing [25]. Fig. 15 shows a basic DNN model. The multiple hidden layers and the large number of neurons within the DNN can automatically extract features for data analysis to achieve an accurate model regression or classification. Once the DNN is well trained, it will develop high general-ization and can be directly applied to new instances without costly numerical computation. Compared to the conventional model-based method, the DNN is highly computational effi-cient while maintaining considerable accuracy.
FIGURE 15. Basic Deep Neural Network (DNN) Model.
2) REINFORCEMENT LEARNING
Reinforcement learning (RL) algorithm is another well-known model-free method for solving problems with hid-den information. RL can obtain the optimal decisions within an unknown environment through continuous interactions between the agent and the environment. For the model-free RL algorithm, the principle evaluates possible actions in terms of the current state at time t, then finds the optimal action with max reward value byε-greedy strategy to strike a balance between exploration and exploitation of decision space, and finally updates the action-valueQ(st,at)at each
iteration based on the Bellman optimality equation [26], as follows:
Q(st,at)=Q(st,at)+α(r(st,at)
+γmaxQ(st+1,at+1)
−Q(st,at)) (11) Based on the latest expected state-action value, the optimal policy can be estimated to maximize the agent’s accumulated reward, as follows:
aopt=arg maxQ(st,at) (12)
RL does not require any prior knowledge, the algorithm is versatile, and it can protect data privacy. The accuracy of action-state function for RL depends on learning experience, thus RL usually requires a lot of evaluation and iterations, and the calculation time is relatively long.
C. PROCEDURE OF PREDICTING BEHAVIOR FOR MICROGRIDS
Based on the proposed architecture, data preprocessing method and behavior prediction algorithm above, the overall procedure of predicting behavior for micro-grids is presented as algorithm 1, which is specifically described as follows:
1) Utilize KDE to analyze the probabilistic characteristics of local solar irradiance (Psi), wind speed (Pws), temperature
(PT) and electricity price (λp) data.
2) Generate incremental sample data using LHS and Cholesky decomposition algorithm.
3) Cluster all sample data by PSO assisted K-means algo-rithm to find out typical scenario categories.
4) Take one scenario from each category in order, reorder all the sample scenarios.
FIGURE 16. Test Micro-grid without energy storage system.
5) Initialize the training data with previous (i−1)thdays
data set:input data: SI →SI+(i−1)th[Psi,Pws,PT,λP],
output data: SU →SU+(i−1)thPpcc.
6) Construct Meta-models and DNN network or determine the optimal policy by RL using the training data.
7) Predict tie-line power of the nextithscenario with con-structed Meta-models and DNN as well as RL algorithm.
8) Calculate actual tie-line power of MG in theithscenario using the model based algorithm.
9) Calculate the mean square error (βE) for Meta-models
and DNN as well as RL algorithm.
10) Determine whetherβE is less than the preset valueε.
If it is satisfied, the calculation ends and output the corre-sponding predicted power. Otherwise, go to step 5 and enter the next iteration.
V. TEST CASE
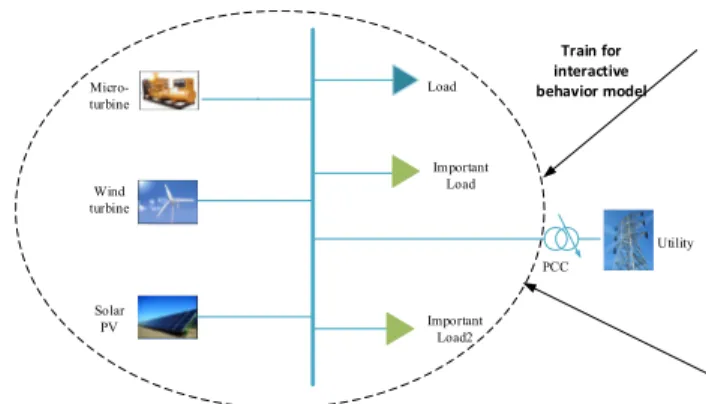
A. CASE I–MICROGRID WITHOUT ENERGY STORAGE SYSTEM
The first test case is a gird-connected MG without energy storage system, the one-line diagram is shown in Fig. 16, and it composes by three types of DGs: solar PV, wind turbine, and Micro-turbine. We intend to train an interactive behavior model of this MG by using the active power measurements at the PCCs and the public historical data information out-side of MG. we assume the spot price data are taken from American electricity price [27], the local solar irradiance, wind speed, temperature and electricity price in previous Nth days are selected as the input of the training set, and the tie-line power of MG in previousNth days are taken as the expected output of the training set. Data-driven based methods proposed above are utilized for network training, and the trained networks are tested on the next (N+1)th day to verify their accuracy and applicability.
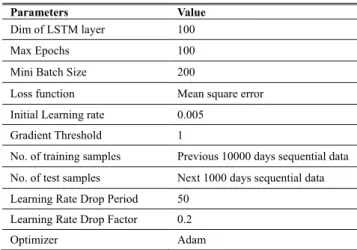
Since the energy storage is not included in MG, the oper-ation periods of the MG can be decoupled from each other, thus the MG can be controlled independently in different time slots. Thereby, the input dimension and output dimension of the training network are selected as 4 and 1 respectively. The training parameters for DNN are shown in the Table 1. For RL, since we don’t know the internal parameters of MG,
FIGURE 17. Prediction results of DNN, Meta-model and conventional model-based method (theoretical results) regarding with training days.
TABLE 1. Training parameters for DNN.
TABLE 2. Training parameters for RL.
so we make full use of DNN to predict its action-reward value, and then form a deep Q-network (DQN) to learn the tie-line power of MG. The training parameters of RL algorithm are shown in the Table 2.
Firstly, the predictive results of DNN is compared with that of meta-model method and model-based method (regard as theoretical results). Among them, the predictive value of meta-model method is calculated by weighting sum of RSM, RBF and Kriging surrogated models. The calculation is shown in (13) Pkmeta=ωk P∗MRSMk +ωkR∗MRBFk +ωKk ∗MKrigingk ωk P= MRSMk MRSMk +MRBFk +MKrigingk ωk R= MRBFk MRSMk +MRBFk +MKrigingk ωk K= MKrigingk MRSMk +MRBFk +MKrigingk (13)
The prediction results of DNN, surrogated model and con-ventional model-based method regarding with training days are shown in Fig. 17. For dimension reasons, only three-dimensional maps are given out, the electricity price and solar irradiance are selected as input variables and PCC power is selected as output variable. The predicted value of PCC out-put power by DNN is compared with that of theoretical results through model-based optimal method as shown in Fig. 18, We can find from Fig. 17 that with the training data gradually enriched, the PCC power prediction value of DNN, basically coincides with the theoretical calculation value driven by the model, which shows the strong fitting ability of DNN. Although meta-model method has aggregated advantages of
FIGURE 18. Comparison of DNN prediction results of tie-line power with theoretical values.
RSM, RBF and Kriging, the overall prediction effect is still unsatisfactory as compared with DNN.
We can also see from Fig. 18 that the predicted accuracy of DNN is better and better with the abundance of samples. After 80 days of data learning, PCC power prediction results basically coincides with the model-based theoretical value, reflecting good learning and prediction ability.
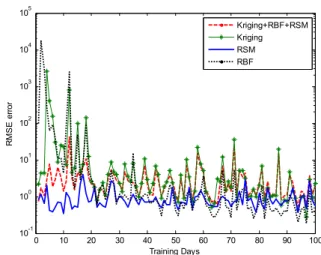
Furthermore, the root mean squared error (RMSE) as shown in (14) is utilized as the evaluation criterion to test power prediction errors of various methods. The RMSE com-parison of RSM, RBF and Kriging models and their combi-nation models is shown in Fig. 19. The RMSE comparison of RSM (the surrogated technique with best performance) and DNN as well as the RL is shown in Fig. 20 and Table 3. Fig 21 presents the reward convergence process of the RL algorithm. RMSE= v u u t 1 M M X i=1 PPCC,i−ePPCC,i 2 (14)
As can be seen from the Fig. 19, with the increase of days and training data, the three surrogated techniques, RSM, RBF, and Kriging show a downward trend in pre-diction errors. When there are insufficient samples in the early stage, the covariance function calculated from these few points result in large errors for Kriging, so the fit-ting effect of Kriging technique is not good and the pre-diction error is large. However, with the accumulation of samples, the fitting error between the covariance function and the actual model decreases gradually, thus the prediction error of Kriging decreases rapidly. The same phenomenon occurs in RBF, since the parameters of its basis function are
TABLE 3.Comparison of several meta-model technologies and artificial intelligence methods.
difficult to match, so the RMSE error is large in the early stage, with the sample becomes more abundant, the basis function parameters are constantly modified, and the fit-ting accuracy is gradually improved. As for RSM, it uses low-order surface response function to fit the sample space, so it presents a better fitting effect in the early stage. However, because its basis function order is fixed in training process, the fitting improvement is hard to improve even in the later stage with high-dimensional samples, thereby the prediction error of RSM maintains a certain level, which also indi-cated that low-order basis function and surface fitting is rel-atively stable, but they are not suitable for accurate behavior prediction.
From the RMSE comparison of DNN, RSM, and RL in Fig. 20, we can find that the prediction error of DNN is large when there are insufficient samples in the early stage, this is because the scenarios learned at the beginning of training stage are difficult to cover all the various scenarios in wind speed, solar irradiance, temperature and electricity
Algorithm 1 Procedure of Predicting Behavior for Microgrids
1: Utilize KDE to analyze the probabilistic characteristics of local solar irradiance (Psi), wind speed (Pws),
tem-perature (PT) and electricity price (λp) data
2: Generate incremental sample data using LHS and Cholesky decomposition algorithm
3: Cluster all sample data by PSO assisted K-means algo-rithm to find out typical scenario categories
4: Take one scenario from each category in order, reorder all the sample scenarios, complete data preprocessing process
5: foriin 1 toNDdo
6: Initialize the training data with previous (i-1)thdays data set:,
input data: SI →SI+(i-1)thscenarios data
output data: SU →SU+(i-1)thPpcc
7: Construct the Meta-models and DNN or determine the optimal policy by RL using the training data 8: Predicting behavior of the nextithscenario with
constructed Meta-models and DNN as well as RL algorithm
9: Calculate actualithscenario behavior of MG (Ppcc)
using the model based algorithm
10: Calculate the mean square error (βE) for Meta-models
and DNN as well as RL algorithm 11: ifβE < ε
12: doBreak; 13: end if
14: End for
prices, however with the abundance of samples and more learning scenarios, the number of scenarios covered by DNN gradually increases, thus the accuracy of DNN increases continuously, and the accuracy of DNN is much higher than that of RSM in the later stage. On the other hand, from the comparison between DNN and RL, for the DQN reinforce-ment learning algorithm utilized in this paper relies heavily on the predictive ability of DNN to update its reward value, its overall accuracy is slightly lower than that of DNN, but it can constantly learn and approximate the DNN prediction model, so the overall prediction and decision-making effect is also high enough.
From the statistical results of the training time and accuracy of the various methods in Table 3, it can be further seen that DNN and RL do have better prediction accuracy, and their results are better than the meta-model method. From the convergence process of the RL algorithm in Fig. 21, it can roughly converge to the optimal results in about 200 epochs, however, the training time is the longest as seen from Table 3 for the number of policy evaluations required by RL is large. In summary, the above results indicated that DNN has best fitting ability of complex MG energy management functions and it is more suitable for the behavior learning of MGs.
FIGURE 19. RMSE comparison of RSM, RBF and Kriging surrogated techniques.
FIGURE 20. RMSE comparison of RSM (the best performance surrogated technique) with DNN and RL.
FIGURE 21. Reward convergence process of the RL algorithm.
B. CASE II-MICROGRID WITH ENERGY STORAGE SYSTEM
The second test case is a gird-connected MG equipped with battery energy storage system (BESS), the grid structure is shown in Fig. 22. After BESS is connected to MG,
FIGURE 22. Test Micro-grid with battery energy storage system.
TABLE 4. Training parameters of LSTM.
the operation periods of the MG are strongly coupled with each other, therefore, the input data and output data for training are 4∗24 sequential sample and 1∗24 sequential sam-ple respectively. For this reason, the long short-term mem-ory (LSTM) deep network that can effectively deal with sequential data [28] is adopted here for behavior learning of MGs equipped with BESS, the training parameters of LSTM are shown in Table 4.
Based on 10000 sample data accumulated by model-based optimization, 9000 training samples and 1000 test samples are selected respectively, the behavior learning results of LSTM is comprehensively compared with that of meta-model technologies as well as the RL algorithm, the statistical results are presents in Table 5.
It can be seen from Table 5 that the surrogated tech-niques obtain large fitting errors for time-coupled and high-dimensional sequential data. The accuracy of the best performing RBF technique is only about 81.86%, this indi-cates that the low-order surface response function based RSM and basis function based RBF are powerless in fitting higher-dimensional and temporally coupled spatial variables, thus the fitting error is larger. From the comparison between RL and LSTM, we can find that the predicting accuracy of
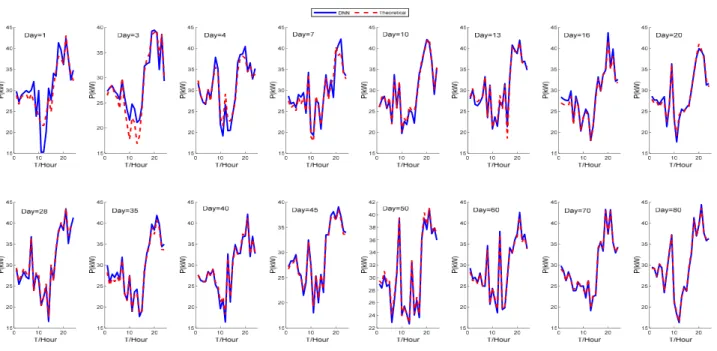
FIGURE 23. Comparison of LSTM prediction results of tie-line power with theoretical values for MG with BESS.
RL is slightly lower than that of LSTM, this is because that the calculation of the RL algorithm’s reward relies heavily on the predictive value of LSTM deep neural network, therefore, its predicted value approaches the LSTM infinitely, but is still slightly lower than that of LSTM. In addition, due to the need for a large number of evaluations and feedback to modify network parameters, training time of RL is usually long The LSTM method shows the best prediction effect by processing the time sequential power data with memory gate, it is more suitable for predicting the sequential tie-line power of MG that contains timing coupling characteristics brought by energy storage, the prediction accuracy of it reaches 96.20%.
The predicted tie-line power by LSTM is further com-pared with the theoretical results on typical days, as shown in Fig. 23. The convergence process of the training RMSE and loss function of LSTM is shown in Fig. 24 and Fig. 25 respectively.
We can find that the convergence speed of the LSTM is fast, the convergence is achieved after about 300 iterations. At the same time, the prediction accuracy of the LSTM is relatively high, the power prediction values by LSTM are basically consistent with the theoretical results, which shows the effectiveness of LSTM deep network especially in behav-ior learning of MG equipped with BESS.
FIGURE 24. Convergence process of the training RMSE of LSTM.
FIGURE 25. Convergence process of the loss function of LSTM.
C. COMPARISON OF META-MODEL TECHNIQUES AND ARTIFICIAL INTELLIGENCE METHODS
Based on the analysis results of the above test cases, we can further summarize the advantages and disadvantages of the meta-model techniques and the artificial intelligence methods in MG behavior learning problem as shown in Table 6.
We can draw the conclusion from Table 1 that RSM and Kriging methods are more suitable for the fitting and predic-tion of low-order and low dimensional MG behavior learn-ing problems. While RBF and DNN are more suitable for high-dimensional and large-scale variable fitting problems because of their network depths and free radicals combina-tion features. Although RL is highly scalable and has good versatility for various decision-making and prediction prob-lems, but the action-value function of it is difficult to model. Meanwhile, the policy training time of RL is long for its need for a large number of policy evaluations.
In summary, the predicting process for most meta-model techniques are fast, but the accuracy of them are not high, so they are more suitable for computational expensive design problems. The training time of DNN network and RL algorithm are relatively long, but the accuracy is much
FIGURE 26. The convergence curves of DNN in three cases with different hidden layer numbers.
higher, so there are more suitable for behavior learning and decision-making problems in MG.
D. CONVERGENCE AND SENSITIVITY ANALYSIS
The sensitivity analysis of DNN (the best performance method) in behavior predicting is further carried out for test case I. The training process with three different hidden layer number are tested: {20 10}, {30 20}, {30 10} respectively, the convergence curves of three different cases are shown in Fig. 26.
It can be seen from Fig. 26 that the hidden layer number has great influence on the training convergence of DNN. Too few or too many hidden layers cannot achieve satisfactory
learning fitting effect and are prone to over-fitting or under-fitting. In practical application, the number of hidden layer should be decided by considering dimension of input vari-ables, calculation time requirement, fitting effect and so on.
VI. CONCLUSION
A comparative study of several recently introduced model-free data-driven methods, including DNN, RL, RBF, RSM, and Kriging in predicting the real-time behavior of MGs under incomplete information is carried out in this paper. The validity of the proposed method is verified in numer-ical experiments by comprehensively compared with con-ventional model-based optimal methods. We can draw the conclusions that:
1) The proposed model-free behavior prediction methods can effectively protect the privacy requirements of the MG for they do not need to access the internal parameters of the MG.
2) The surrogated techniques is more suitable for the low-dimensional, temporally decoupled behavior prediction prob-lem, and it is not suitable for behavior prediction problems with high-dimensional variables. While the DNN and RL has good adaptability to various MG behavior prediction problems such as high-dimensional, low-dimensional, and time-coupling problems.
REFERENCES
[1] W. Pei, Y. Du, H. Xiao, Z. Shen, W. Deng, and Y. Yang, ‘‘Optimal operation of microgrid with photovoltaics and gas turbines in demand response,’’ in
Proc. Int. Conf. Power Syst. Technol., Oct. 2014, pp. 3058–3063. [2] H.-H. Chang, W.-Y. Chiu, H. Sun, and C.-M. Chen, ‘‘User-centric
multi-objective approach to privacy preservation and energy cost minimization in smart home,’’IEEE Syst. J., vol. 13, no. 1, pp. 1030–1041, Mar. 2019.
system for optimal microgrid economic operation,’’IET Renew. Power Gener., vol. 5, no. 3, pp. 258–267, 2011.
[7] A. Parisio and L. Glielmo, ‘‘A mixed integer linear formulation for micro-grid economic scheduling,’’ inProc. IEEE Int. Conf. Smart Grid Commun. (SmartGridComm), Oct. 2011, pp. 505–510.
[8] L. Fu, K. Meng, B. Liu, and Z. Y. Dong, ‘‘Mixed-integer second-order cone programming framework for optimal scheduling of microgrids consider-ing power flow constraints,’’IET Renew. Power Gener., vol. 13, no. 14, pp. 2673–2683, Oct. 2019.
[9] Y. Zheng, S. Li, and R. Tan, ‘‘Distributed model predictive control for on-connected microgrid power management,’’IEEE Trans. Control Syst. Technol., vol. 26, no. 3, pp. 1028–1039, May 2018.
[10] W. Shi, X. Xie, C.-C. Chu, and R. Gadh, ‘‘A distributed optimal energy management strategy for microgrids,’’ inProc. IEEE Int. Conf. Smart Grid Commun. (SmartGridComm), Nov. 2014, vol. 6, pp. 1137–1146. [11] W. Kong, Z. Y. Dong, D. J. Hill, F. Luo, and Y. Xu, ‘‘Short-term residential
load forecasting based on resident behaviour learning,’’IEEE Trans. Power Syst., vol. 33, no. 1, pp. 1087–1088, Jan. 2018.
[12] L. Wang, Z. Zhang, and J. Chen, ‘‘Short-term electricity price forecasting with stacked denoising autoencoders,’’IEEE Trans. Power Syst., vol. 32, no. 4, pp. 2673–2681, Jul. 2017.
[13] J. Yan, H. Zhang, Y. Liu, S. Han, L. Li, and Z. Lu, ‘‘Forecasting the high penetration of wind power on multiple scales using multi-to-multi map-ping,’’IEEE Trans. Power Syst., vol. 33, no. 3, pp. 3276–3284, May 2018. [14] Y. Zhou, Y. Li, W. Liu, D. Yu, Z. Li, and J. Liu, ‘‘The stochastic response surface method for small-signal stability study of power system with prob-abilistic uncertainties in correlated photovoltaic and loads,’’IEEE Trans. Power Syst., vol. 32, no. 6, pp. 4551–4559, Nov. 2017.
[15] P. A. Costa Rocha, R. C. De Sousa, C. F. De Andrade, and M. E. V. Da Silva, ‘‘Comparison of seven numerical methods for determin-ing Weibull parameters for wind energy generation in the northeast region of Brazil,’’Appl. Energy, vol. 89, no. 1, pp. 395–400, Jan. 2012. [16] D. W. Scott, ‘‘On optimal and data-based histograms,’’Biometrika, vol. 66,
no. 3, pp. 605–610, 1979.
[17] R. L. Iman,Latin Hypercube Sampling. Hoboken, NJ, USA: Wiley, 2014. [18] A. B. Owen, ‘‘Controlling correlations in latin hypercube samples,’’
J. Amer. Stat. Assoc., vol. 89, no. 428, pp. 1517–1522, Dec. 1994. [19] H. Yu, C. Chung, K. Wong, H. Lee, and J. Zhang, ‘‘Probabilistic load flow
evaluation with hybrid latin hypercube sampling and Cholesky decompo-sition,’’IEEE Trans. Power Syst., vol. 24, no. 2, pp. 661–667, May 2009. [20] A. Ben Ayed, M. Ben Halima, and A. M. Alimi, ‘‘Survey on clustering
methods: Towards fuzzy clustering for big data,’’ inProc. 6th Int. Conf. Soft Comput. Pattern Recognit. (SoCPaR), Aug. 2014, pp. 331–336. [21] H. Xiao, W. Pei, Z. Dong, L. Kong, and D. Wang, ‘‘Application and
comparison of metaheuristic and new metamodel based global optimiza-tion methods to the optimal operaoptimiza-tion of active distribuoptimiza-tion networks,’’
Energies, vol. 11, no. 1, p. 85, Jan. 2018.
[22] I. Pan and S. Das, ‘‘Kriging based surrogate modeling for fractional order control of microgrids,’’IEEE Trans. Smart Grid, vol. 6, no. 1, pp. 36–44, Jan. 2015.
[23] H. R. Baghaee, M. Mirsalim, and G. B. Gharehpetian, ‘‘Power calculation using RBF neural networks to improve power sharing of hierarchical control scheme in multi-DER microgrids,’’IEEE J. Emerg. Sel. Topics Power Electron., vol. 4, no. 4, pp. 1217–1225, Dec. 2016.
[24] A. Saad, A. Younis, and Z. Dong, ‘‘Radial basis surrogate model integrated to evolutionary algorithm for solving computation intensive black-box problems,’’Int. J. Mech. Mechatronics Eng., vol. 10, pp. 824–829, 2017. [25] Y. Du and F. Li, ‘‘Intelligent multi-microgrid energy management based on
deep neural network and model-free reinforcement learning,’’IEEE Trans. Smart Grid, early access, doi:10.1109/TSG.2019.2930299.
[26] L. Busoniu, R. Babuska, B. De Schutter, and D. Ernst,Reinforcement Learning and Dynamic Programming Using Function Approximators. Boca Raton, FL, USA: CRC Press, 2017.
[27] W. Pei, Y. Du, W. Deng, K. Sheng, H. Xiao, and H. Qu, ‘‘Optimal bidding strategy and intramarket mechanism of microgrid aggregator in real-time balancing market,’’IEEE Trans. Ind. Informat., vol. 12, no. 2, pp. 587–596, Apr. 2016.
[28] E. Chemali, P. J. Kollmeyer, M. Preindl, R. Ahmed, and A. Emadi, ‘‘Long short-term memory networks for accurate state-of-charge estimation of Li-ion batteries,’’IEEE Trans. Ind. Electron., vol. 65, no. 8, pp. 6730–6739, Aug. 2018.
HAO XIAO (Member, IEEE) received the B.S. degree from the Huazhong University of Science and Technology, Wuhan, China, in 2009, and the Ph.D. degree in electrical engineering from the Chinese Academy of Sciences, Beijing, China, in 2015.
From 2015 to 2018, he was an Assistant Pro-fessor with the Institute of Electrical Engineering, Chinese Academy of Sciences, where he has been an Associate Professor, since 2019. He has also been an Associate Professor with the University of Chinese Academy of Sciences, since 2019. His research interests include optimal operation and planning of power systems and application of artificial intelligence in power systems.
Dr. Xiao severs as a member of the IEEE PES Energy Internet Com-mittee. He received the IEEE Transportation Electrification Conference Best Paper Award, in 2014. He also serves as the Section Chair for the IEEE ICEMS2018 Conference and a Reviewer of several the IEEE and IET Journals, including the IEEE TRANSACTIONS ONSMARTGRID, the IEEE
TRANSACTIONS ONINDUSTRIALINFORMATION, IEEE ACCESS, theIET Generation Transmission & Distribution, andIET Smart Grid.
WEI PEI(Member, IEEE) received the B.S. and M.S. degrees in electrical engineering from Tian-jin University, TianTian-jin, China, in 2002 and 2005, respectively, and the Ph.D. degree from the Insti-tute of Electrical Engineering, Chinese Academy of Sciences, Beijing, China, in 2008.
He is currently working as a Professor with the Institute of Electrical Engineering, Chinese Academy of Sciences, and with the University of Chinese Academy of Sciences. He is also the Director of the Distributed Generation and Power System Research Group, Chinese Academy of Sciences. His research interests include integrated energy systems and AC/DC micro-grid. He is also an Editor ofIET Smart Grid,IET Energy Systems Integration, and theCSEE Journal of Power and Energy Systems.
WEI DENG (Member, IEEE) received the B.S. degree in computer science and technology from North China Electric Power University, Beijing, China, in 2004, and the Ph.D. degree in elec-trical engineering from the Chinese Academy of Sciences, Beijing, in 2010. He is currently an Associate Professor with the Institute of Electri-cal Engineering, Chinese Academy of Sciences, and with the University of Chinese Academy of Sciences. His research interests include distributed generation, microgrid, active distribution networks, AC/DC hybrid grid, and the application of information technology (IT) in smart grids.
LI KONG received the B.S. degree from the Huazhong University of Science and Technology, Wuhan, China, in 1982, and the Ph.D. degree in electrical engineering from the National Institute of Technology, Paris, France, in 1994.
He is currently a Professor with the Institute of Electrical Engineering, Chinese Academy of Sciences, and with the University of Chinese Academy of Sciences. He is also the Chair of the Power Grid Technology Research Group, Chinese Academy of Sciences. His research interests include AC/DC hybrid dis-tribution networks, renewable generation, and micro-grids. He is a Senior Member of the Chinese Electrical Society and the Deputy Secretary-General of the Solar Power Association of China.
HONGJIAN SUN (Senior Member, IEEE) received the Ph.D. degree from the University of Edinburgh, U.K., in 2011.
He took his postdoctoral positions at the King’s College London, U.K., and Princeton University, USA. Since April 2013, he has been with the Department of Engineering, Durham University, U.K., as an Associate Professor (Reader) in smart grid. He has published more than 100 articles in refereed journals and international conferences. He has also published five book chapters and edited two books: IET book
Smarter Energy: from Smart Metering to the Smart Gridand CRC book
From Internet of Things to Smart Cities: Enabling Technologies. His research interests include demand side management, renewable energy sources inte-gration, and artificial intelligence for energy systems. He is the Editor-in-Chief ofIET Smart Grid Journal. He has served as a Guest Editor for the IEEE TRANSACTIONS ONINDUSTRIALINFORMATICSfor three Feature Topics on
smart grid technologies. He has made contributions to and coauthored the IEEE 1900.6a-2014 Standard.
CHENGHONG TANG (Senior Member, IEEE) is currently the Deputy Chief Engineer of the Technology Research Center, NARI Research Institute. She has been mainly involved in Tech-nical Research and Product Research and Devel-opment in the field of distribution networks, micro-grids, and integrated energy system. She has won 11 provincial, ministerial and state grid company-level awards, and six prefecture-level science and technology progress awards; which have been applied in many areas of the country, and achieved good economic and social benefits.
![FIGURE 2. Principle of non-parametric kernel density estimation (KDE) method [16].](https://thumb-us.123doks.com/thumbv2/123dok_us/1380191.2684844/4.864.76.395.94.460/figure-principle-parametric-kernel-density-estimation-kde-method.webp)