University of Vermont
ScholarWorks @ UVM
Northwest Crops & Soils Program
UVM Extension
2014
Heirloom Spring Wheat Seeding Rate Trial
Heather Darby
University of Vermont, [email protected]
Erica Cummings
University of VermontKatie Blair
University of VermontSusan Monahan
University of VermontJulian Post
University of VermontSee next page for additional authors
Follow this and additional works at:
https://scholarworks.uvm.edu/nwcsp
Part of the
Agricultural Economics Commons
This Report is brought to you for free and open access by the UVM Extension at ScholarWorks @ UVM. It has been accepted for inclusion in Northwest Crops & Soils Program by an authorized administrator of ScholarWorks @ UVM. For more information, please contact [email protected].
Recommended Citation
Darby, Heather; Cummings, Erica; Blair, Katie; Monahan, Susan; Post, Julian; and Ziegler, Sara, "Heirloom Spring Wheat Seeding Rate Trial" (2014).Northwest Crops & Soils Program. 168.
Authors
Heather Darby, Erica Cummings, Katie Blair, Susan Monahan, Julian Post, and Sara Ziegler
2014 Heirloom Spring Wheat
Seeding Rate Trial
Dr. Heather Darby, UVM Extension Agronomist
Erica Cummings, Katie Blair, Susan Monahan, Julian Post, Sara Ziegler
UVM Extension Crops and Soils Technicians
(802) 524-6501
Visit us on the web:
http://www.uvm.edu/extension/cropsoil
2014 HEIRLOOM SPRING WHEAT SEEDING RATE TRIAL
Dr. Heather Darby, University of Vermont Extension Heather.Darby[at]uvm.edu
University of Vermont Extension began its heirloom spring wheat project in 2007 to determine whether heirloom varieties developed before 1950 could thrive in Vermont’s climate. Many consumers are interested in heirloom wheat as they feel it has better flavor, while many farmers are also interested in heirloom wheat varieties as they may have superior genetics that are better adapted to the challenging growing conditions in the Northeast. Several producers have asked questions about the best agronomic practices for cultivating heirloom wheat. It is unclear if heirloom wheat will require lower seeding rates as compared to modern day varieties. Seeding rates can influence weed populations as well as overall yield and quality. The purpose of this trial was to determine optimum seeding rates for heirloom spring wheat in Vermont.
MATERIALS AND METHODS
In April 2014, heirloom spring wheat seeding rate trials were established at Borderview Research Farm in Alburgh, Vermont and at Butterworks Farm in Westfield, VT. The experimental plot design was a
randomized complete block split design with four replications. Seeding rate was the main plot and variety the split plot. The seedbed at both the Alburgh and Westfield locations was prepared by conventional tillage methods. All plots were managed with practices similar to those used by producers in the
surrounding areas (Table 1). The previous crop planted at the Alburgh site was sod, and the previous crop planted at the Westfield site was dry beans. Prior to planting, both fields were disked and spike tooth harrowed to prepare for seeding. The plots were seeded with a Great Plains NT60 Cone Seeder at seeding rates of 50, 75, 100, 125, or 150 lbs ac-1 with two different heirloom varieties: Ladoga and Red Fife. Plot size was 5’ x 20’. At the Alburgh location the trial was planted on 25-Apr and at the Westfield location they were planted on 29-Apr.
Table 1. General plot management of the heirloom spring wheat seeding rate trial, 2014.
Trial Information Heirloom Spring Wheat Seeding Rate Trials
Location Alburgh, VT Westfield, VT
Borderview Research Farm Butterworks Farm
Soil type Benson rocky silt loam Colton-Duxbury complex
Previous crop Sod Dry beans
Row spacing (in) 6 6
Seeding rate (lbs ac-1) 50, 75, 100, 125, & 150 50, 75, 100, 125, & 150
Replicates 4 4
Planting date 25-Apr 29-Apr
Harvest date 8-Aug 20-Aug
Harvest area (ft) 5 x 20 5 x 20
Tillage operations Fall plow, spring disk &
spike tooth harrow
Fall plow, spring disk & spike tooth harrow
Populations were measured on 5-Jun at the Alburgh location by taking two, 1/3 meter plant counts per plot. Prior to harvest, at the Alburgh location, plant heights were measured, excluding the awns, and a visual estimate of the percentage of lodged plants taken. Grain plots were harvested with an Almaco SPC50 plot combine on 8-Aug at the Alburgh location and 20-Aug at the Westfield location, the harvest area was 5’ x 20’. In addition, grain moisture, test weight and yield were calculated.
Following harvest, seed was cleaned with a small Clipper cleaner (A.T. Ferrell, Bluffton, IN). An approximate one pound subsample was collected to determine quality. Quality measurements included standard testing parameters used by commercial mills. Test weight was measured by the weighing of a known volume of grain. Generally the heavier the wheat is per bushel, the higher baking quality. The acceptable test weight for bread wheat is 56-60 lbs per bushel. Once test weight was determined, the samples were then ground into flour using the Perten LM3100 Laboratory Mill. At this time, flour was evaluated for its protein content and falling number. Grains were analyzed for protein content using the Perten Inframatic 8600 Flour Analyzer. Grain protein affects gluten strength and loaf volume. Most commercial mills target 12-14% protein. Protein was calculated on a 12% moisture basis. The
determination of falling number (AACC Method 56-81B, AACC Intl., 2000) was measured on the Perten FN 1500 Falling Number Machine. The falling number is related to the level of sprout damage that has occurred in the grain. It is measured by the time it takes, in seconds, for a stirrer to fall through a slurry of flour and water to the bottom of the tube. Falling numbers greater than 350 indicate low enzymatic activity and sound quality wheat. A falling number lower than 200 indicates high enzymatic activity and poor quality wheat. Deoxynivalenol (DON) analysis was analyzed using Veratox DON 5/5 Quantitative test from the NEOGEN Corp. This test has a detection range of 0.5 to 5 ppm. Samples with DON values greater than 1 ppm are considered unsuitable for human consumption.
All data was analyzed using a mixed model analysis where replicates were considered random effects. The LSD procedure was used to separate seeding rate means when the F-test was significant (P< 0.10). Variations in yield and quality can occur because of variations in genetics, soil, weather and other growing conditions. Statistical analysis makes it possible to determine whether a difference among varieties is real or whether it might have occurred due to other variations in the field. At the bottom of each table, a LSD value is presented for each variable (e.g. yield). Least Significant Differences at the 10% level of probability are shown. Where the difference between two varieties within a column is equal to or greater than the LSD value at the bottom of the column, you can be sure in 9 out of 10 chances that there is a real difference between the two varieties. In the example below, variety A is significantly different from variety C, but not from variety B. The difference between A
and B is equal to 725, which is less than the LSD value of 889. This means that these varieties did not differ in yield. The difference between A and C is equal to 1454, which is greater than the LSD value of 889. This means that the yields of these varieties were significantly different from one another. The asterisk indicates that variety B was not significantly lower than the top yielding variety. Variety Yield A 3161 B 3886* C 4615* LSD 889
RESULTS
Seasonal precipitation and temperatures were recorded with a Davis Instruments Vantage Pro2 with Weatherlink data logger on site in Alburgh, VT (Table 2). The spring wheat growing season this year experienced lower than normal temperatures in April, July and August with above average temperatures in May and June. Alburgh experienced above average rainfall. From April to August there was an accumulation of 4440 Growing Degree Days (GDDs) in Alburgh, VT, which is 52 GDDs lower than the 30 year average.
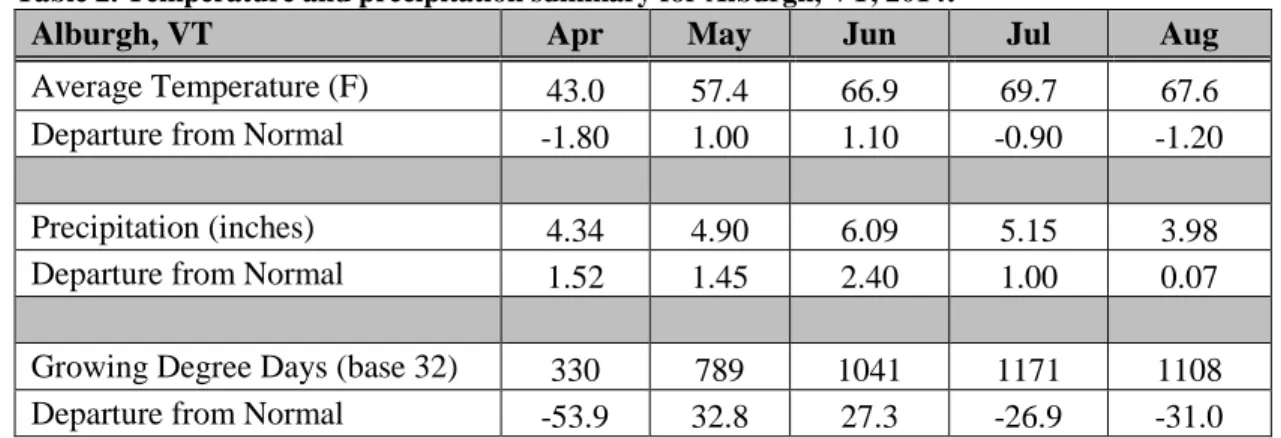
Table 2. Temperature and precipitation summary for Alburgh, VT, 2014.
Alburgh, VT Apr May Jun Jul Aug
Average Temperature (F) 43.0 57.4 66.9 69.7 67.6 Departure from Normal -1.80 1.00 1.10 -0.90 -1.20
Precipitation (inches) 4.34 4.90 6.09 5.15 3.98 Departure from Normal 1.52 1.45 2.40 1.00 0.07
Growing Degree Days (base 32) 330 789 1041 1171 1108 Departure from Normal -53.9 32.8 27.3 -26.9 -31.0
Based on weather data from Davis Instruments Vantage Pro2 with Weatherlink data logger. Historical averages for 30 years of NOAA data (1981-2010).
Seasonal precipitation and temperature was recorded at a weather station in close proximity to the Westfield site and is shown in Table 3. Westfield experienced below average temperatures and above average rainfall during the spring wheat growing season. From April to August there was an accumulation of 3922 Growing Degree Days (GDDs) in Westfield, VT, which is 194 GDDs lower than the 30 year average.
Table 3. Temperature and precipitation summary for Westfield, VT, 2014.
Westfield, VT Apr May Jun Jul Aug
Average Temperature (F) 39.4 53.6 62.9 67.2 64.6 Departure from Normal -3.20 -1.20 -0.90 -0.80 -1.50
Precipitation (inches) 3.04 5.39 4.45 5.85 4.83 Departure from Normal 0.23 1.72 0.49 1.52 0.22
Growing Degree Days (base 32) 222 670 927 1091 1012 Departure from Normal -101 -40.3 -27.0 18.6 -44.9
Based on National Weather Service data from cooperative observation stations in Newport, VT. Historical averages are for 30 years of NOAA data (1981-2010) from Newport, VT.
Seeding Rate x Variety Interactions
Figure 1. Seeding rate by variety interaction for crude protein, Alburgh, VT, 2014.
At both the Alburgh and Westfield locations (Figure 1 and Figure 2), there was a seeding rate by variety interaction for crude protein. The varieties performed similarly across seeding rates except for Red Fife when it was seeded at 150 lbs ac-1. Generally crude protein levels were similar across seeding rates, however, Red Fife’s crude protein at the highest seeding rate increased to 15.1% at the Alburgh location and 13.8% at the Westfield location. For both locations, Red Fife had a lower crude protein level than Ladoga for all seeding rates except the highest seeding rate of 150 lbs ac-1 where the crude protein levels of Red Fife spiked above Ladoga’s levels.
Figure 2. Seeding rate by variety interaction for crude protein, Westfield, VT, 2014.
Seeding Rate
At the Alburgh location, seeding rate had a significant impact on moisture, crude protein, and falling number (Table 4, Figure 3). However, seeding rate did not significantly impact average plant height, lodging, yield, test weight, or deoxynivalenol (DON) level. The average yield across seeding rates was 1133 lbs ac-1. None of the seeding rates met industry standards of 55-60 lbs bu-1. The lowest moisture at harvest was the seeding rate of 150 lbs ac-1 (19.5%). All of the seeding rates had moisture levels above 14% and therefore had to be dried down for optimal grain storability. The seeding rate with the highest crude protein was 150 lbs ac-1 (14.3%). All of the seeding rates met or exceeded industry standards of 12-14% protein. All of the falling numbers were above 200 seconds and less than 350 seconds, indicating some sprouting damage. The seeding rate with the highest falling number (303 seconds) was 100 lbs ac-1 and the lowest falling number (271 seconds) was the seeding rate of 50 lbs ac-1. All of the seeding rate treatments had DON levels of 1 ppm or less and therefore were suitable for human consumption.
Table 4. The impact of seeding rate on wheat harvest and quality, Alburgh, VT. Seeding rate Plant height Lodging Yield @13.5% moisture Moisture Test weight Crude protein Falling number DON @12% moisture lbs ac-1 inches % lbs ac-1 % lbs bu-1 % seconds ppm 50 45.6 1.00 1184 20.8 51.1 13.5 271 1.00 75 42.7 5.00 1077 20.3 52.1 13.2 292* 0.80 100 42.8 13.8 1170 20.2 52.2 13.2 303 0.80 125 42.9 13.8 1229 20.0* 52.3 13.2 298* 0.77 150 42.1 20.0 1004 19.5* 51.9 14.3* 301* 0.68 LSD (0.10) NS NS NS 0.50 NS 0.50 20.0 NS Trial mean 43.2 11.0 1133 20.1 51.9 13.5 293 0.80
Values shown in bold are of the highest value or top performing.
* Wheat varieties that are not significantly different than the top performing variety in a column are indicated with an asterisk.
NS - None of the varieties were significantly different from one another.
At the Westfield location, seeding rate had a significant impact on yield, crude protein, and falling number (Table 5, Figure 4). There were not significant differences on moisture, test weight, and DON between seeding rates. The highest yielding seeding rate at the Westfield location was the seeding rate of 125 lbs ac-1 (1,582 lbs ac-1) and was only significantly different than the lowest yielding seeding rate of 50 lbs ac-1 (1,359 lbs ac-1). None of the seeding rates met industry standards of 55-60 lbs bu-1. The seeding rates of 50, 75, and 150 lbs ac-1did not differ significantly in protein level. All of the protein levels from this location met industry standards of 12-14% protein. The seeding rate with the highest falling number (229 seconds) was 150 lbs ac-1 and the lowest falling number (201 seconds) was the seeding rate of 50 lbs ac-1. The low falling numbers throughout the seeding rates indicate sprouting damage may have begun to occur prior to harvest. All of the seeding rate treatments had DON levels of 1 ppm or less and therefore were suitable for human consumption.
Table 5. The impact of seeding rate on wheat harvest and quality, Westfield, VT.
Seeding rate Yield @ 13.5%
moisture Moisture Test weight Crude protein Falling number DON @12% moisture lbs ac-1 lbs ac-1 % lbs bu-1 % seconds ppm 50 1359 18.0 52.7 13.7* 201 0.22 75 1413* 18.0 54.0* 13.9* 213* 0.27 100 1579* 18.0 53.7 13.2 221* 0.32 125 1582* 18.0 53.9 13.3 214* 0.18 150 1563* 17.8* 53.1 13.7* 229* 0.22 LSD (0.10) 171 NS NS 0.40 15.2 NS Trial mean 1499 18.0 53.5 13.6 216 0.24
Values shown in bold are of the highest value or top performing.
* Wheat varieties that are not significantly different than the top performing variety in a column are indicated with an asterisk.
Figure 3. Yield and protein of heirloom spring wheat varieties based on seeding rate, Alburgh, VT, 2014.
Varieties with the same letter are not significantly different from one another.
Figure 4. Yield and protein of heirloom spring wheat varieties based on seeding rate, Westfield, VT, 2014.
Variety
At the Alburgh location, variety had a significant impact on average plant height, moisture, test weight, crude protein, and falling number. It did not have a significant impact on yield, DON, or lodging (Table 6, Figure 5). Lodoga was the tallest variety (44.3 inches) and not surprising also had a higher percentage of lodge plants (15.0%). Ladoga had slightly lower moisture (19.0) and higher test weight, protein, and falling number compared to Red Fife. The two varieties did not differ significantly in DON level.
Table 6. The impact of variety on wheat harvest and quality, Alburgh, VT, 2014.
Variety Plant height Lodging Yield Moisture Test weight Crude protein Falling number DON @13.5% moisture @12% moisture inches % lbs ac-1 % lbs bu-1 % seconds ppm Ladoga 44.3* 15.0 1201 19.0* 52.6* 13.7* 335* 0.60 Red Fife 42.1 7.00 1064 21.3 51.2 13.3 252 1.10 LSD (0.10) 1.80 NS NS 0.30 0.70 0.30 13.0 NS Trial mean 43.2 11.0 1133 20.1 51.9 13.5 293 0.80
Values shown in bold are of the highest value or top performing.
* Wheat varieties that are not significantly different than the top performing variety in a column are indicated with an asterisk.
NS - None of the varieties were significantly different from one another.
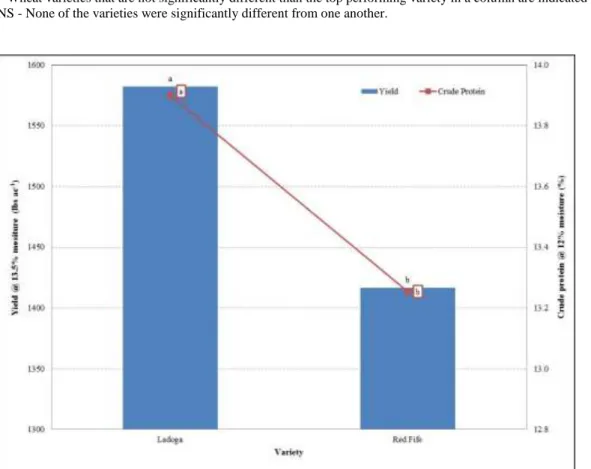
Figure 5. Yield and protein of heirloom spring wheat varieties based on variety, Alburgh, VT, 2014.
At the Westfield location, variety had a significant impact on yield, moisture, test weight, crude protein, and falling number (Table 7, Figure 6). The DON level did not differ by variety. Similar to the Alburgh trial site, the heirloom variety Ladoga outperformed Red Fife in test weight, crude protein, and falling number. It also had slightly lower moisture compared to Red Fife.
Table 7. The impact of variety on wheat harvest and quality, Westfield, VT, 2014. Variety Yield Moisture Test weight Crude protein Falling number DON @13.5% moisture @12% moisture lbs ac-1 % lbs bu-1 % seconds ppm Ladoga 1582* 17.7* 54.0* 13.9* 224* 0.23 Red Fife 1417 18.2 53.0 13.3 207 0.25 LSD (0.10) 107.9 0.2 0.7 0.2 9.6 NS Trial mean 1499 18.0 53.5 13.6 216 0.24
Values shown in bold are of the highest value or top performing.
* Wheat varieties that are not significantly different than the top performing variety in a column are indicated with an asterisk. NS - None of the varieties were significantly different from one another.
Figure 6. Yield and protein of heirloom spring wheat varieties based on variety, Westfield, VT, 2014.
DISCUSSION
It is important to remember that the results only represent one year of data. 2014 was another challenging growing season. The prolonged cool and wet spring delayed wheat planting and impacted stand
establishment and plant tillering. The below average temperatures, and above average rainfall, persisted throughout the growing season at both trial locations, which resulted in delayed wheat development and dry down which might help explain the high moistures at harvest. The Westfield location had both a higher yield and a higher test weight than the Alburgh location. This is interesting considering the lower number of growing degree days experienced at the Westfield location this year compared to the 30-year average.
Interestingly, seeding rate had little effect on yield and quality of the heirloom wheat. Overall, the seeding rate between 75 and 125 lbs ac-1 at both locations produced the best yield and quality. There did appear to be slight yield depression and potentially impacts on falling number at seeding rates below 75 lbs ac-1. These seeding rates are similar to those recommended for modern day wheat varieties. Further research across multiple years is needed to confirm these results. The heirloom variety Ladoga was the top performer at both locations when it came to yield, crude protein, test weight, and falling number. Ladoga also had a lower harvest moisture indicating that it ripens a bit earlier than Red Fife.
ACKNOWLEDGEMENTS
The UVM Extension Crops and Soils Team would like to thank the Nell Newman Foundation for support of this research. Special thanks to Roger Rainville and the staff at Borderview Research Farm for their generous help with this research. We would also like to acknowledge Connor Burke, Lily Calderwood, Julija Cubins, Hannah Harwood, Ben Leduc, Laura Madden, and Dana Vesty for their assistance with data collection and entry. This information is presented with the understanding that no product
discrimination is intended and neither endorsement of any product mentioned, nor criticism of unnamed products, is implied.
UVM Extension helps individuals and communities put research-based knowledge to work.
Issued in furtherance of Cooperative Extension work, Acts of May 8 and June 30, 1914, in cooperation with the United States Department of Agriculture. University of Vermont Extension, Burlington, Vermont, University of Vermont Extension, and U.S. Department of Agriculture, cooperating, offer education and employment to everyone without regard to race, color, national origin, gender, religion, age, disability, political beliefs, sexual orientation, and marital or familial status.