The Priority R-Tree: A Practically Efficient
and Worst-Case Optimal R-Tree
Lars Arge
∗ Department of Computer ScienceDuke University, Box 90129 Durham, NC 27708-0129
Mark de Berg
Department of Computer ScienceTU Eindhoven, P.O.Box 513 5600 MB Eindhoven The Netherlands [email protected]
Herman J. Haverkort
† Institute of Information and Computing Sciences Utrecht University, PO Box 80 089 3508 TB Utrecht, The NetherlandsKe Yi
∗Department of Computer Science Duke University, Box 90129 Durham, NC 27708-0129, USA
ABSTRACT
We present the Priority R-tree, or PR-tree, which is the first R-tree variant that always answers a window query using O((N/B)1−1/d+T /B) I/Os, where N is the number of d
-dimensional (hyper-) rectangles stored in the R-tree, B is the disk block size, andT is the output size. This is provably asymptotically optimal and significantly better than other R-tree variants, where a query may visit all N/B leaves in the tree even when T = 0. We also present an extensive experimental study of the practical performance of the PR-tree using both real-life and synthetic data. This study shows that the PR-tree performs similar to the best known R-tree variants on real-life and relatively nicely distributed data, but outperforms them significantly on more extreme data.
1.
INTRODUCTION
Spatial data naturally arise in numerous applications, in-cluding geographical information systems, computer-aided design, computer vision and robotics. Therefore spatial database systems designed to store, manage, and manipulate spatial data have received considerable attention over the years. Since these databases often involve massive datasets, disk based index structures for spatial data have been re-searched extensively—see e.g. the survey by Gaede and G¨
un-∗Supported in part by the National Science Foundation
through RI grant EIA–9972879, CAREER grant CCR– 9984099, ITR grant EIA–0112849, and U.S.–Germany Co-operative Research Program grant INT–0129182.
†Supported by the Netherlands’ Organization for Scientific
Research (NWO).
Permission to make digital or hard copies of all or part of this work for personal or classroom use is granted without fee provided that copies are not made or distributed for profit or commercial advantage, and that copies bear this notice and the full citation on the first page. To copy otherwise, to republish, to post on servers or to redistribute to lists, requires prior specific permission and/or a fee.
SIGMOD 2004 June 13-18, 2004, Paris, France. Copyright 2004 ACM 1-58113-859-8/04/06 . . .$5.00.
ther [11]. Especially the R-tree [13] and its numerous vari-ants (see e.g. the recent survey by Manolopoulos et al. [19]) have emerged as practically efficient indexing methods. In this paper we present the Priority R-tree, orPR-tree, which is the first R-tree variant that is not only practically efficient but also provably asymptotically optimal.
1.1
Background and previous results
Since objects stored in a spatial database can be rather complex they are often approximated by simpler objects, and spatial indexes are then built on these approximations. The most commonly used approximation is the minimal bounding box: the smallest axis-parallel (hyper-) rectangle that contains the object. The R-tree, originally proposed by Guttman [13], is an index for such rectangles. It is a height-balanced multi-way tree similar to a B-tree [5, 9], where each node (except for the root) has degree Θ(B). Each leaf contains Θ(B) data rectangles (each possibly with a pointer to the original data) and all leaves are on the same level of the tree; each internal nodevcontains pointers to its Θ(B) children, as well as for each child a minimal bounding box covering all rectangles in the leaves of the subtree rooted in that child. If B is the number of rectangles that fits in a disk block, an R-tree onNrectangles occupies Θ(N/B) disk blocks and has height Θ(logBN). Many types of queries
can be answered efficiently using an R-tree, including the common query called a window query: Given a query rect-angleQ, retrieve all rectangles that intersectQ. To answer such a query we simply start at the root of the R-tree and recursively visit all nodes with minimal bounding boxes in-tersecting Q; when encountering a leaflwe report all data rectangles inlintersectingQ.
Guttman gave several algorithms for updating an R-tree inO(logBN) I/Os using B-tree-like algorithms [13]. Since
there is no unique R-tree for a given dataset, and because the window query performance intuitively depends on the amount of overlap between minimal bounding boxes in the nodes of the tree, it is natural to try to minimize bounding box overlap during updates. This has led to the development of many heuristic update algorithms; see for example [6, 16,
23] or refer to the surveys in [11, 19]. Several specialized algorithms for bulk-loading an R-tree have also been devel-oped [7, 10, 12, 15, 18, 22]. Most of these algorithms use
O(NBlogM/B NB) I/Os (the number of I/Os needed to sort
N elements), whereM is the number of rectangles that fits in main memory, which is much less than theO(NlogBN) I/Os needed to build the index by repeated insertion. Fur-thermore, they typically produce R-trees with better space utilization and query performance than R-trees built using repeated insertion. For example, while experimental results have shown that the average space utilization of dynamically maintained R-trees is between 50% and 70% [6], most bulk-loading algorithms are capable of obtaining over 95% space utilization. After bulk-loading an R-tree it can of course be updated using the standard R-tree updating algorithms. However, in that case its query efficiency and space utiliza-tion may degenerate over time.
One common class of R-tree bulk-loading algorithms work by sorting the rectangles according to some global one-di-mensional criterion, placing them in the leaves in that order, and then building the rest of the indexbottom-up level-by-level [10, 15, 18]. In two dimensions, the so-called packed Hilbert R-tree of Kamel and Faloutsos [15], which sorts the rectangles according to the Hilbert values of their centers, has been shown to be especially query-efficient in practice. The Hilbert value of a point p is the length of the frac-tal Hilbert space-filling curve from the origin to p. The Hilbert curve is very good at clustering spatially close rect-angles together, leading to a good index. A variant of the packed Hilbert R-tree, which also takes the extent of the rectangles into account (rather than just the center), is the four-dimensional Hilbert R-tree [15]; in this structure each rectangle ((xmin, ymin),(xmax, ymax)) is first mapped to the
four-dimensional point (xmin, ymin, xmax, ymax) and then the
rectangles are sorted by the positions of these points on the dimensional Hilbert curve. Experimentally the four-dimensional Hilbert R-tree has been shown to behave slightly worse than the packed Hilbert R-tree for nicely distributed realistic data [15]. However, intuitively, it is less vulnerable to more extreme datasets because it also takes the extent of the input rectangles into account.
Algorithms that bulk-load R-trees in atop-down manner have also been developed. These algorithms work by recur-sively trying to find a good partition of the data [7, 12]. The so-called Top-down Greedy Split (TGS) algorithm of Garc´ıa, L´opez and Leutenegger [12] has been shown to re-sult in especially query-efficient R-trees (TGS R-trees). To build the root of (a subtree of) an R-tree on a given set of rectangles, this algorithm repeatedly partitions the rectan-gles into two sets, until they are divided intoB subsets of (approximately) equal size. Each subset’s bounding box is stored in the root, and subtrees are constructed recursively on each of the subsets. Each of the binary partitions takes a set of rectangles and splits it into two subsets based on one of several one-dimensional orderings; in two dimensions, the orderings considered are those byxmin, ymin, xmaxandymax.
For each such ordering, the algorithm calculates, for each of
O(B) possible partitioning possibilities, the sum of the areas of the bounding boxes of the two subsets that would result from the partition. Then it applies the binary partition that minimizes that sum.1
1Garc´ıa et al. describe several variants of the top-down
greedy method. They found the one described here to be
While the TGS R-tree has been shown to have slightly better query performance than other R-tree variants, the construction algorithm uses many more I/Os since it needs to scan all the rectangles in order to make a binary par-tition. In fact, in the worst case the algorithm may take
O(NlogBN) I/Os. However, in practice, the fact that each partition decision is binary effectively means that the algo-rithm usesO(N
Blog2N) I/Os.
While much work has been done on evaluating the prac-tical query performance of the R-tree variants mentioned above, very little is known about their theoretical worst-case performance. Most theoretical work on R-trees is concerned with estimating the expected cost of queries under assump-tions such as uniform distribution of the input and/or the queries, or assuming that the input are points rather than rectangles. See the recent survey by Manolopoulos et al. [19]. The first bulk-loading algorithm with a non-trivial guaran-tee on the resulting worst-case query performance was given only recently by Agarwal et al. [2]. Inddimensions their al-gorithm constructs an R-tree that answers a window query in O((N/B)1−1/d+Tlog
BN) I/Os, where T is the
num-ber of reported rectangles. However, this still leaves a gap to the Ω((N/B)1−1/d+T /B) lower bound on the number
of I/Os needed to answer a window query [2, 17]. If the input consists of points rather than rectangles, then worst-case optimal query performance can be achieved with e.g. a kdB-tree [21] or an O-tree [17]. Unfortunately, it seems hard to modify these structures to work for rectangles. Fi-nally, Agarwal et al. [2], as well as Haverkort et al. [14], also developed a number of R-trees that have good worst-case query performance under certain conditions on the input.
1.2
Our results
In Section 2 we present a new R-tree variant, which we call aPriority R-treeorPR-treefor short. We call our struc-ture the Priority R-tree because our bulk-loading algorithm utilizes so-called priority rectangles in a way similar to the recent structure by Agarwal et al. [2]. Window queries can be answered inO((N/B)1−1/d+T /B) I/Os on a PR-tree,
and the index is thus the first R-tree variant that answers queries with an asymptotically optimal number of I/Os in the worst case. To contrast this to previous R-tree bulk-loading algorithms, we also construct a set of rectangles and a query with zero output, such that all Θ(N/B) leaves of a packed Hilbert R-tree, a four-dimensional Hilbert R-tree, or a TGS R-tree need to be visited to answer the query. We also show how to bulk-load the PR-tree efficiently, using only O(N
B logM/BNB) I/Os. After bulk-loading, a PR-tree
can be updated in O(logBN) I/Os using the standard R-tree updating algorithms, but without maintaining its query efficiency. Alternatively, the external logarithmic method [4, 20] can be used to develop a structure that supports inser-tions and deleinser-tions in O(logB N
M + 1
B(logM/BNB)(log2MN))
and O(logB NM) I/Os amortized, respectively, while
main-taining the optimal query performance.
In Section 3 we present an extensive experimental study of the practical performance of the PR-tree using both real-life and synthetic data. We compare the performance of our the most efficient in practice [12]. In order to achieve close to 100% space utilization, the size of the subsets created is actually rounded up to the nearest power ofB (except for one remainder set). As a result, one node on each level, including the root, may have less thanB children.
index on two-dimensional rectangles to the packed Hilbert R-tree, the four-dimensional Hilbert R-tree, and the TGS tree. Overall, our experiments show that all these R-trees answer queries in more or less the same number of I/Os on relatively square and uniformly distributed rect-angles. However, on more extreme data—large rectangles, rectangles with high aspect ratios, or non-uniformly dis-tributed rectangles—the PR-tree (and sometimes also the four-dimensional Hilbert R-tree) outperforms the others sig-nificantly. On a special worst-case dataset the PR-tree out-performs all of them by well over an order of magnitude.
2.
THE PRIORITY R-TREE
In this section we describe the PR-tree. For simplicity, we first describe a two-dimensional pseudo-PR-tree in Sec-tion 2.1. The pseudo-PR-tree answers window queries effi-ciently but is not a real R-tree, since it does not have all leaves on the same level. In Section 2.2 we show how to obtain a real two-dimensional PR-tree from the pseudo-PR-tree, and in Section 2.3 we discuss how to extend the PR-tree toddimensions. Finally, in Section 2.4 we show that a query on the packed Hilbert R-tree, the four-dimensional Hilbert R-tree, as well as the TGS R-tree can be forced to visit all leaves even ifT = 0.
2.1
Two-dimensional pseudo-PR-trees
In this section we describe the two-dimensional pseudo-PR-tree. Like an R-tree, a pseudo-PR-tree has the input rectangles in the leaves and each internal nodeνcontains a minimal bounding box for each of its childrenνc. However,
unlike an R-tree, not all the leaves are on the same level of the tree and internal nodes only have degree six (rather than Θ(B)).
The basic idea in the pseudo-PR-tree is (similar to the four-dimensional Hilbert R-tree) to view an input rectan-gle ((xmin, ymin),(xmax, ymax)) as a four-dimensional point
(xmin, ymin, xmax, ymax). The pseudo-PR-tree is then
basi-cally just a kd-tree on theN points corresponding to theN
input rectangles, except that four extra leaves are added be-low each internal node. Intuitively, these so-calledpriority leaves contain the extremeB points (rectangles) in each of the four dimensions. Note that the four-dimensional kd-tree can easily be mapped back to an R-tree-like structure, sim-ply by replacing the split value in each kd-tree nodeνwith the minimal bounding box of the input rectangles stored in the subtree rooted inν. The idea of using priority leaves was introduced in a recent structure by Agarwal et al. [2], they used priority leaves of size one rather thanB.
In section 2.1.1 below we give a precise definition of the pseudo-PR-tree, and in section Section 2.1.2 we show that it can be used to answer a window query inO( N/B+T /B) I/Os. In Section 2.1.3 we describe how to construct the structure I/O-efficiently.
2.1.1
The Structure
Let S = {R1, . . . , RN} be a set of N rectangles in the
plane and assume for simplicity that no two of the coor-dinates defining the rectangles are equal. We defineR∗
i =
(xmin(Ri), ymin(Ri), xmax(Ri), ymax(Ri)) to be the mapping
of Ri = ((xmin(Ri), ymin(Ri)),(xmax(Ri), ymax(Ri))) to a
point in four dimensions, and defineS∗to be theN points
corresponding toS.
A pseudo-PR-tree TS on S is defined recursively: If S
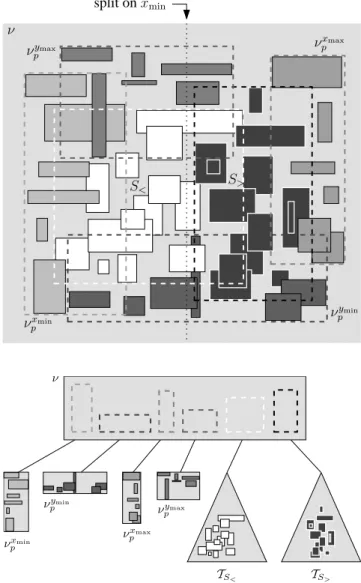
split onxmin νxmin p νymin p νxmax p νymax p S< S> ν νxmin p νymin p νxmax p νymax p TS< TS> ν
Figure 1: The construction of an internal node in a pseudo-PR-tree.
contains less thanB rectangles, TS consists of a single leaf;
otherwise,TSconsists of a nodeνwith six children, namely
four priority leaves and two recursive pseudo-PR-trees. For each child νc, we let ν store the minimal bounding box of
all input rectangles stored in the subtree rooted inνc. The
nodeνand the priority leaves below it are constructed as fol-lows: The first priority leafνxmin
p contains theB rectangles
in S with minimal xmin-coordinates, the second νpymin the
B rectangles among the remaining rectangles with minimal
ymin-coordinates, the third νxpmax the B rectangles among
the remaining rectangles with maximal xmax-coordinates,
and finally the fourth νymax
p the B rectangles among the
remaining rectangles with maximalymax-coordinates. Thus
the priority leaves contain the “extreme” rectangles in S, namely the ones with leftmost left edges, bottommost bot-tom edges, rightmost right edges, and topmost top edges.2
After constructing the priority leaves, we divide the setSrof 2S may not contain enough rectangles to putB rectangles
in each of the four priority leaves. In that case, we may assume that we can still put at leastB/4 in each of them, since otherwise we could just construct a single leaf.
remaining rectangles (if any) into two subsets,S<and S>,
of approximately the same size and recursively construct pseudo-PR-treesTS< and TS>. The division is performed
using the xmin, ymin, xmax, or ymax-coordinate in a
round-robin fashion, as if we were building a four-dimensional kd-tree on S∗
r, that is, when constructing the root of TS we
divide based on thexmin-values, the next level of recursion
based on theymin-values, then based on thexmax-values, on
theymax-values, on thexmin-values, and so on. Refer to
Fig-ure 1 for an example. Note that dividing according to, say,
xmincorresponds to dividing based on a vertical line`such
that half of the rectangles inSr have their left edge to the
left of`and half of them have their left edge to the right of
`.
We store each node or leaf ofTS inO(1) disk blocks, and
since at least four out of every six leaves contain Θ(B) rect-angles we obtain the following (in Section 2.1.3 we discuss how to guarantee that almost every leaf is full).
Lemma 1. A pseudo-PR-tree on a set ofN rectangles in
the plane occupiesO(N/B)disk blocks.
2.1.2
Query complexity
We answer a window query Q on a pseudo-PR-tree ex-actly as on an R-tree by recursively visiting all nodes with minimal bounding boxes intersectingQ. However, unlike for known R-tree variants, for the pseudo-PR-tree we can prove a non-trivial (in fact, optimal) bound on the number of I/Os performed by this procedure.
Lemma 2. A window query on a pseudo-PR-tree on N
rectangles in the plane uses O( N/B+T /B)I/Os in the worst case.
Proof. LetTSbe a pseudo-PR-tree on a setSofN
rect-angles in the plane. To prove the query bound, we bound the number of nodes inTSthat are “kd-nodes”, i.e. not
pri-ority leaves, and are visited in order to answer a query with a rectangular rangeQ; the total number of leaves visited is at most a factor of four larger.
We first note thatO(T /B) is a bound on the number of nodes ν visited where all rectangles in at least one of the priority leaves belowν’s parent are reported. Thus we just need to bound the number of visited kd-nodes where this is not the case.
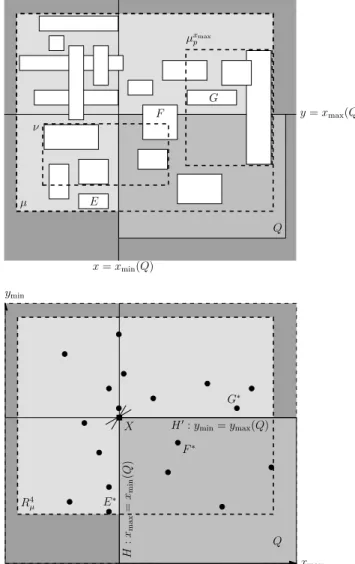
Let µ be the parent of a node ν such that none of the priority leaves of µ are reported completely, that is, each priority leafµpof µcontains at least one rectangle not
in-tersectingQ. Each such rectangleE can be separated from
Qby a line containing one of the sides ofQ—refer to Fig-ure 2. Assume without loss of generality that this is the vertical linex=xmin(Q) through the left edge of Q, that
is, E’s right edge lies to the left of Q’s left edge, so that
xmax(E)≤xmin(Q). This means that the pointE∗in
four-dimensional space corresponding toElies to the left of the axis-parallel hyperplaneH that intersects thexmax-axis at
xmin(Q). Now recall thatTSis basically a four-dimensional
kd-tree onS∗(with priority leaves added), and thus that a
four-dimensional regionR4µcan be associated withµ. Since
the queryQvisitsµ, there must also be at least one rectangle
F in the subtree rooted at µthat has xmax(F)> xmin(Q),
so thatF∗lies to the right ofH. It follows thatR4
µcontains
points on both sides ofHand thereforeHmust intersectR4 µ.
Now observe that the rectangles in the priority leafµxmax
p
cannot be separated fromQby the linex=xmin(Q) through
µ ν Q x=xmin(Q) y=xmax(Q) E F µxmax p G R4 µ Q H : xma x = xmi n ( Q ) H0:ymin=ymax(Q) E∗ F∗ G∗ X xmax ymin y=xmax(Q)
Figure 2: The proof of Lemma 2, withµin the plane (upper figure), and µ in four-dimensional space (lower figure—thexmin andymax dimensions are not shown). Note that X =H∩H0 is a two-dimensional
hyperplane in four-dimensional space. It contains a two-dimensional facet of the transformation of the query range into four dimensions.
the left edge of Q: Rectangles inµxmax
p are extreme in the
positivex-direction, so if one of them lies completely to the left of Q, then all rectangles inµ’s children—includingν— would lie to the left ofQ; in that caseνwould not be visited. Since (by definition ofν) not all rectangles inµxmax
p intersect
Q, there must be a line through one ofQ’s other sides, say the horizontal line y = ymax(Q), that separates Q from a
rectangle Ginµxmax
p . Hence, the hyperplaneH0 that cuts
theymin-axis atymax(Q) also intersectsR4µ.
By the above arguments, at least two of the three-dimen-sional hyperplanes defined by xmin(Q), xmax(Q), ymin(Q)
andymax(Q) intersect the regionRµ4 associated withµwhen
viewingTS as a four-dimensional kd-tree. Hence, the
inter-section X of these two hyperplanes, which is a two-dimen-sional plane in four-dimentwo-dimen-sional space, also intersects R4
µ.
With the priority leaves removed,TSbecomes a
generalization of the standard analysis of kd-trees we know that any axis-parallel two-dimensional plane intersects at mostO( N/B) of the regions associated with the nodes in such a tree [2]. All that remains is to observe thatQdefines
O(1) such planes, namely one for each pair of sides. Thus
O( N/B) is a bound on the number of nodes ν that are not priority leaves and are visited by the query procedure, where not all rectangles in any of the priority leaves below
ν’s parent are reported.
2.1.3
Efficient construction algorithm
Note that it is easy to bulk-load a pseudo-PR-treeTS on
a setS ofN rectangles in O(N
B logN) I/Os by simply
con-structing one node at a time following the definition in Sec-tion 2.1.1. We will now describe how, under the reasonable assumption that the amountM of available main memory is Ω(B4/3), we can bulk-loadT
SusingO(NBlogM/BNB) I/Os.
Our algorithm is a modified version of the kd-tree con-struction algorithm described in [1, 20]; it is easiest de-scribed as constructing a four-dimensional kd-treeTSon the
pointsS∗. In the construction algorithm we first construct,
in a preprocessing step, four sorted listsLxmin,Lymin,Lxmax, Lymax containing the points in S
∗ sorted by their x
min-,
ymin-, xmax-, and ymax-coordinate, respectively. Then we
construct Θ(logM) levels of the tree, and recursively con-struct the rest of the tree.
To construct Θ(logM) levels ofTS efficiently we proceed
as follows. We first choose a parameter z (which will be explained below) and use the four sorted lists to find the (kN/z)-th coordinate of the points S∗ in each dimension,
for all k ∈ {1,2, ..., z −1}. These coordinates define a four-dimensional grid of sizez4; we then scanS∗and count
the number of points in each grid cell. We choosez to be Θ(M1/4), so that we can keep these counts in main memory.
Next we build the Θ(logM) levels ofTSwithout worrying
about the priority leaves: To construct the root ν of TS,
we first find the slice of z3 grid cells with common xmin
-coordinate such that there is a hyperplane orthogonal to the
xmin-axis that passes through these cells and has at most half
of the points inS∗on one side and at most half of the points
on the other side. By scanning theO(N/(Bz)) blocks from
Lxmin that contain the O(N/z) points in these grid cells,
we can determine the exactxmin-valuex to use inν such
that the hyperplaneH, defined by xmin = x, divides the
points inS∗into two subsets with at most half of the points
each. After constructing ν, we subdivide thez3 grid cells
intersected byH, that is, we divide each of thez3cells in two atxand compute their counts by rescanning theO(N/(Bz)) blocks fromLxmin that contain theO(N/z) points in these
grid cells. Then we construct a kd-tree on each side of the hyperplane defined byxrecursively (cycling through all four possible cutting directions). Since we createO(z3) new cells
every time we create a node, we can ensure that the grid still fits in main memory after constructingznodes, that is, logz= Θ(logM) levels ofTS.
After constructing the Θ(logM) kd-tree levels, we con-struct the four priority leaves for each of theznodes. To do so we reserve main memory space for theBpoints in each of the priority leaves; we have enough main memory to hold all priority leaves, since by the assumption thatM is Ω(B4/3) we have 4·Θ(B)·Θ(z) =O(M). Then we fill the priority leaves by scanningS∗and “filtering” each pointR∗
i through
the kd-tree, one by one, as follows: We start at the root ofν
ofTS, and check its priority leavesνpxmin,νpymin,νpxmax, and
νymax
p one by one in that order. If we encounter a non-full
leaf we simply placeR∗
i there; if we encounter a full leafνp
and R∗
i is more extreme in the relevant direction than the
least extreme point R∗
j inνp, we replaceR∗j with R∗i and
continue the filtering process withR∗
j. After checkingνpymax
we continue to check the priority leaves of the child of νin
TS whose region contains the point we are processing; if ν
does not have such a child (because we arrived at leaf level in the kd-tree) we simply continue with the next point inS∗.
It is easy to see that the above process correctly constructs the top Θ(logM) levels of the pseudo-PR-treeTS onS,
ex-cept that the kd-tree divisions are slightly different than the ones defined in Section 2.1.1, since the points in the priority leaves are not removed before the divisions are computed. However, the bound of Lemma 2 still holds: TheO(T /B) term does not depend on the choice of the divisions, and the kd-tree analysis that brought theO( N/B) term only depends on the fact that each child gets at most half of the points of its parent.
After constructing the Θ(logM) levels and their priority leaves, we scan through the four sorted lists Lxmin, Lymin, Lxmax,Lymax and divide them into four sorted lists for each
of the Θ(z) leaves of the constructed kd-tree, while omit-ting the points already stored in priority leaves. These lists contain O(N/z) points each; after writing the constructed kd-tree and priority leaves to disk we use them to construct the rest ofTS recursively.
Note that once the number of points in a recursive call gets smaller than M, we can simply construct the rest of the tree in internal memory one node at a time. This way we can make slightly unbalanced divisions, so that we have a multiple ofBpoints on one side of each dividing hyperplane. Thus we can guarantee that we get at most one non-full leaf per subtree of size Θ(M), and obtain almost 100% space uti-lization. To avoid having an underfull leaf that may violate assumptions made by update algorithms, we may make the priority leaves under its parent slightly smaller so that all leaves contain Θ(B) rectangles. This also implies that the bound of Lemma 1 still holds.
Lemma 3. A pseudo-PR-tree can be bulk-loaded with N
rectangles in the plane inO(N
BlogM/BNB)I/Os.
Proof. The initial construction of the sorted lists takes O(N
BlogM/BNB) I/Os. To construct Θ(logM) levels of TS
we use O(N/B) I/Os to construct the initial grid, as well as O(N/(Bz)) to construct each of thez nodes for a total ofO(N/B) I/Os. Constructing the priority leaves by filter-ing also takes O(N/B) I/Os, and so does the distribution of the remaining points in S∗ to the recursive calls. Thus
each recursive step takesO(N/B) I/Os in total. The lemma follows since there areO(logNB/logM) =O(logM NB) levels
of recursion.
2.2
Two-dimensional PR-tree
In this section we describe how to obtain a PR-tree (with degree Θ(B) and all leaves on the same level) from a pseudo-PR-tree (with degree six and leaves on all levels), while maintaining theO( N/B+T /B) I/O window query bound. The PR-tree is built in stages bottom-up: In stage 0 we construct the leavesV0 of the tree from the setS0=SofN
input rectangles; in stage i≥1 we construct the nodesVi
consisting of the minimal bounding boxes of all nodes inVi−1
(on leveli−1). Stageiconsists of constructing a pseudo-PR-treeTSionSi;Vithen simply consists of the (priority as well
as normal) leaves ofTSi; the internal nodes are discarded. 3
The bottom-up construction ends when the setSi is small
enough so that the rectangles inSi and the pointers to the
corresponding subtrees fit into one block, which is then the root of the PR-tree.
Theorem 1. A PR-tree on a setSofNrectangles in the
plane can be bulk-loaded inO(N
BlogM/BNB)I/Os, such that
a window query can be answered inO( N/B+T /B)I/Os.
Proof. By Lemma 3, stageiof the PR-tree bulk-loading
algorithm uses O((|Si|/B) logM/B(|Si|/B)) I/Os, which is
O((N/Bi+1) log
M/BNB). Thus the complete PR-tree is
con-structed in O(logBN) i=0 O N Bi+1logM/B N B =O N B logM/B N B I/Os. To analyze the number of I/Os used to answer a window query Q, we will analyze the number of nodes visited on each level of the tree. LetTi(i≤0) be the number of nodes
visited on level i. Since the nodes on level 0 (the leaves) correspond to the leaves of a pseudo-PR-tree on theNinput rectanglesS, it follows from Lemma 2 thatT0=O( N/B+
T /B); in particular, for big enoughN andB, there exists a constantcsuch that T0 ≤c N/B+c(T /B). There must
beTi−1rectangles in nodes of leveli≥1 of the PR-tree that
intersectQ, since these nodes contain the bounding boxes of nodes on leveli−1. Since nodes on level icorrespond to the leaves of a pseudo-PR-tree on theN/Birectangles in
Si, it follows from Lemma 2 that for big enoughN andB,
we haveTi ≤(c/
√
Bi) N/B+c(Ti−1/B). Summing over
allO(logBN) levels and solving the recurrence reveals that
O( N/B+T /B) nodes are visited in total.
2.3
Multi-dimensional PR-tree
In this section we briefly sketch how our PR-tree gener-alizes to dimensions greater than two. We focus on how to generalize pseudo-PR-trees, since a d-dimensional PR-tree can be obtained usingd-dimensional pseudo-PR-trees in ex-actly the same way as in the two-dimensional case; that thed-dimensional PR-tree has the same asymptotic perfor-mance as thed-dimensional pseudo-PR-tree is also proved exactly as in the two-dimensional case.
Recall that a two-dimensional pseudo-PR-tree is basically a four-dimensional kd-tree, where four priority leaves con-taining extreme rectangles in each of the four directions have been added below each internal node. Similarly, ad -dimen-sional pseudo-PR-tree is basically a 2d-dimensional kd-tree, where each node has 2d priority leaves with extreme rect-angles in each of the 2d standard directions. For constant
3There is a subtle difference between the pseudo-PR-tree
algorithm used in stage 0 and the algorithm used in stages
i >0. In stage 0, we construct leaves with input rectangles. In stages i > 0, we construct nodes with pointers to chil-dren and bounding boxes of their subtrees. The number of children that fits in a node might differ by a constant fac-tor from the numberB of rectangles that fits in a leaf, so the number of children might be Θ(B) rather thanB. For our analysis the difference does not matter and is therefore ignored for simplicity.
d, the structure can be constructed inO(N
BlogM/BNB) I/Os
using the same grid method as in the two-dimensional case (Section 2.1.3); the only difference is that in order to fit the 2d-dimensional grid in main memory we have to decreasez
(the number of nodes produced in one recursive stage) to Θ(M1/2d).
To analyze the number of I/Os used to answer a window query on a d-dimensional pseudo-PR-tree, we analyze the number of visited internal nodes as in the two-dimensional case (Section 2.1.2); the total number of visited nodes is at most a factor 2dhigher, since at most 2dpriority leaves can be visited per internal node visited. As in the two-dimensional case, O(T /B) is a bound on the number of nodes ν visited where all rectangles in at least one of the priority leaves below ν’s parent are reported. The number of nodesν visited such that each priority leaf ofν’s parent contains at least one rectangle not intersecting the query can then be bounded using an argument similar to the one used in two dimensions; it is equal to the number of regions associated with the nodes in a 2d-dimensional kd-tree with
O(N/B) leaves that intersect the (2d−2)-dimensional in-tersection of two orthogonal hyperplanes. It follows from a straightforward generalization of the standard kd-tree anal-ysis that this isO((N/B)1−1/d) [2].
Theorem 2. A PR-tree on a set ofN hyperrectangles in d dimensions can be bulk-loaded in O(N
BlogM/BNB) I/Os,
such that a window query can be answered inO((N/B)1−1/d+
T /B)I/Os.
2.4
Lower bound for heuristic R-trees
The PR-tree is the first R-tree variant that always answers a window query worst-case optimally. In fact, most other R-tree variants can be forced to visit Θ(N/B) nodes to answer a query even when no rectangles are reported (T = 0). In this section we show how this is the case for the packed Hilbert R-tree, the four-dimensional Hilbert R-tree, and the TGS R-tree.
Theorem 3. There exist a set of rectanglesS and a
win-dow queryQthat does not intersect any rectangles inS, such that allΘ(N/B)nodes are visited whenQis answered using a packed Hilbert R-tree, a four-dimensional Hilbert R-tree, or a TGS R-tree on S.
Proof. We will construct a set ofpoints S such that all
leaves in a packed Hilbert R-tree, a four-dimensional Hilbert R-tree, and a TGS R-tree onS are visited when answering a line query that does not touch any point. The theorem follows since points and lines are all special rectangles.
For convenience we assume that B ≥ 4, N = 2kB and
N/B = Bm, for some positive integers k and m, so that each leaf of the R-tree containsB rectangles, and each in-ternal node has fanoutB. We constructSas a grid ofN/B
columns andBrows, where each column is shifted up a little, depending on its horizontal position (each row is in fact a Halton-Hammersley point set; see e.g. [8]). More precisely,
S has a point pij = (xij, yij), for all i∈ {0, ..., N/B−1}
and j ∈ {0, ..., B−1}, such that xij =i+ 1/2, andyij =
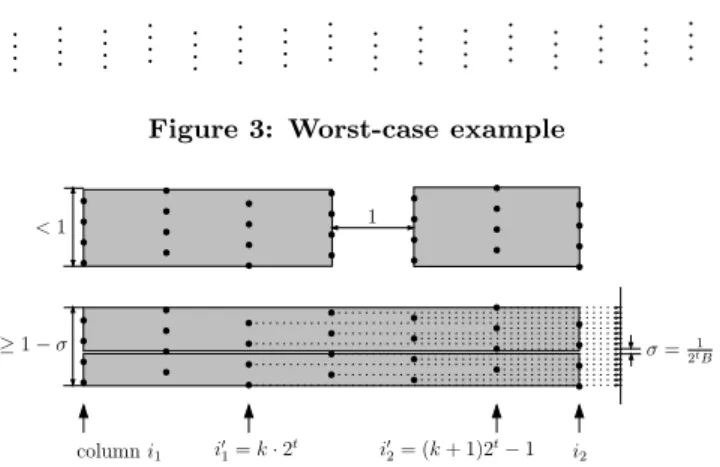
j/B+h(i)/N. Hereh(i) is the number obtained by revers-ing, i.e. reading backwards, thek-bit binary representation ofi. An example withN= 64, B= 4 is shown in Figure 3. Now, let us examine the structure of each of the three R-tree variants on this dataset.
Figure 3: Worst-case example i0 1=k·2 t i0 2= (k+ 1)2 t −1 columni1 i2 σ= 1 2tB ≥1−σ <1 1
Figure 4: TGS partitioning the worst-case example. A vertical division creates two bounding boxes with a total area of less thani2−i1−1. A horizontal di-vision creates two bounding boxes with a total area of more than(i2−i1)(1−2σ)> i2−i1−1.
Two- and four-dimensional packed Hilbert R-tree: the Hilbert curve visits the columns in our grid of points one by one; when it visits a column, it visits all points in that column before proceeding to another column (we omit the details of the proof from this abstract). Therefore, the packed Hilbert R-tree makes a leaf for every column, and a horizontal line can be chosen to intersect all these columns while not touching any point.
TGS R-tree: The TGS algorithm will partition S into
Bsubsets of equal size and partition each subset recursively. The partitioning is implemented by choosing a partitioning line that separates the set into two subsets (whose sizes are multiples of N/B), and then applying binary partitions to the subsets recursively until we have partitioned the set into
N subsets of size N/B. Observe that on all levels in this recursion, the partitioning line will leave at least a fraction 1/B of the input on each side of the line. Below we prove that TGS will always partition by vertical lines; it follows that TGS will eventually put each column in a leaf. Then a line query can intersect all leaves but report nothing.
Suppose TGS is about to partition the subsetS(i1, i2) of
S that consists of columns i1 to i2 inclusive, with i2 > i1,
i.e. S(i1, i2) ={pij|i∈ {i1, ..., i2}, j∈ {0, ..., B−1}}. When
the greedy split algorithm gets to divide such a set into two, it can look for a vertical partitioning line or for a horizontal partitioning line. Intuitively, TGS favors partitioning lines that create a big gap between the bounding boxes of the points on each side of the line. As we will show below, we have constructedS such that the area of the gap created by a horizontal partitioning line is always roughly the same, as is the area of the gap created by a vertical line, with the latter always being bigger.
Partitioning with a vertical line would always leave a gap of roughly a square that fits between two columns—see Fig-ure 4. More precisely, it would partition the setS(i1, i2) into
two setsS(i1, c−1) andS(c, i2), for somec∈ {i1+ 1, ..., i2}.
The bounding boxes of these two sets would each have height less than 1, and their total width would be (c−1−i1) +
(i2−c), so their total areaAvwould be less thani2−i1−1.
The width of a gap around a horizontal partitioning line depends on the number of columns inS(i1, i2). However,
the more columns are involved the bigger the density of the points in those columns when projected on they-axis, and the lower the gap that can be created—see Figure 4 for an illustration. As a result, partitioning with a horizontal line can lead to gaps that are wide and low, or relatively high but not so wide; in any case, the area of the gap will be roughly the same. More precisely, when we partition this set by a horizontal line, the total area Ah of the resulting
bounding boxes must be at leasti2−i1−4/B(we omit the
details from this abstract).
Recall that Av is less than i2 −i1 −1. Since B ≥ 4,
we can conclude thatAh > Av, and that partitioning with
a vertical line will always result in a smaller total area of bounding boxes than with a horizontal line. As a result, TGS will always cut vertically between the columns.
3.
EXPERIMENTS
In this section we describe the results of our experimental study of the performance of the PR-tree. We compared the PR-tree to several other bulk-loading methods known to generate query-efficient R-trees: The packed Hilbert R-tree (denoted H in the rest of this section), the four-dimensional Hilbert R-tree (denoted H4), and the TGS R-tree (denoted TGS). Among these, TGS has been reported to have the best query performance, but it also takes many I/Os to bulk-load. In contrast, H is simple to bulk-load, but it has worse query performance because it does not take the extent of the input rectangles into account. H4 has been reported to be inferior to H [15], but since it takes the extent into account (like TGS) it should intuitively be less vulnerable to extreme datasets.
3.1
Experimental setup
We implemented the four bulk-loading algorithms in C++ using TPIE [3]. TPIE is a library that provides support for implementing I/O-efficient algorithms and data structures. In our implementation we used 36 bytes to represent each input rectangle; 8 bytes for each coordinate and 4 bytes to be able to hold a pointer to the original object. Each bounding box in the internal nodes also used 36 bytes; 8 bytes for each coordinate and 4 bytes for a pointer to the disk block storing the root of the corresponding subtree. The disk block size was chosen to be 4KB, resulting in a maximum fanout of 113. This is similar to earlier experimental studies, which typically use block sizes ranging from 1KB to 4KB or fix the fan-out to a number close to 100.
As experimental platform we used a dedicated Dell Pow-erEdge 2400 workstation with one Pentium III/500MHz pro-cessor running FreeBSD 4.3. A local 36GB SCSI disk (IBM Ultrastar 36LZX) was used to store all necessary files: the input data, the R-trees, as well as temporary files. We re-stricted the main memory to 128MB and further rere-stricted the amount of memory available to TPIE to 64MB; the rest was reserved to operating system daemons.
3.2
Datasets
We used both real-life and synthetic data in our experi-ments.
3.2.1
Real-life data
As the real-life data we used the tiger/Line data [24]
the standard benchmark data used in spatial databases. It is distributed on six CD-ROMs and we chose to experiment with the road line segments from two of the CD-ROMs: Disk one containing data for sixteen eastern US states and disk six containing data from five western US states; we use East-ern and WestEast-ern to refer to these two datasets, respectively. To obtain datasets of varying sizes we divided the Eastern dataset into five regions of roughly equal size, and then put an increasing number of regions together to obtain datasets of increasing sizes. The largest set is just the whole Eastern dataset. For each dataset we used the bounding boxes of the line segments as our input rectangles. As a result, the East-ern dataset had 16.7 million rectangles, for a total size of 574MB, and the Western data set had 12 million rectangles, for a total size of 411MB. Note that the biggest dataset is much larger than those used in previous works (which only used up to 100,000 rectangles) [15, 12]. Note also that our
tigerdata is relatively nicely distributed; it consist of
rel-atively small rectangles (long roads are divided into short segments) that are somewhat (but not too badly) clustered around urban areas.
3.2.2
Synthetic data
To investigate how the different R-trees perform on more extreme datasets than thetigerdata, we generated a
num-ber of synthetic datasets. Each of these synthetic datasets consisted of 10 million rectangles (or 360MB) in the unit square.
• size(max side): We designed the first class of
syn-thetic datasets to investigate how well the R-trees han-dle rectangles of different sizes. In thesize(max side)
dataset the rectangle centers were uniformly distribu-ted and the lengths of their sides uniformly and inde-pendently distributed between 0 andmax side. When generating the datasets, we discarded rectangles that were not completely inside the unit square (but made sure each dataset had 10 million rectangles). A portion of the datasetsize(0.001) is shown in Figure 5.
Figure 5: Synthetic dataset SIZE(0.001)
• aspect(a): The second class of synthetic datasets was
designed to investigate how the R-trees handle rect-angles with different aspect ratios. The areas of the rectangles in all the datasets were fixed to 10−6, a
reasonably small size. In the aspect(a) dataset the
rectangle centers were uniformly distributed but their
aspect ratios were fixed toaand the longest sides cho-sen to be vertical or horizontal with equal probability. We also made sure that all rectangles fell completely inside the unit square. A portion of the dataset as-pect(10) is shown in Figure 6. Note that if the input
rectangles are bounding boxes of line segments that are almost horizontal or vertical, one will indeed get rectangles with very high aspect ratio—even infinite in the case of horizontal or vertical segments.
Figure 6: Synthetic dataset ASPECT(10)
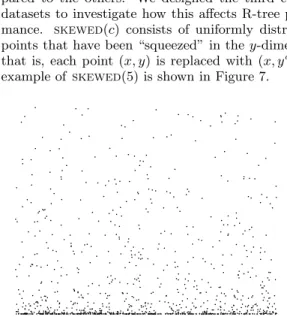
• skewed(c): In many real-life multidimensional
data-sets different dimensions often have different distri-butions, some of which may be highly skewed com-pared to the others. We designed the third class of datasets to investigate how this affects R-tree perfor-mance. skewed(c) consists of uniformly distributed
points that have been “squeezed” in they-dimension, that is, each point (x, y) is replaced with (x, yc). An
example of skewed(5) is shown in Figure 7.
Figure 7: Synthetic dataset SKEWED(5)
• cluster: Our final dataset was designed to illustrate
the worst-case behavior of the H, H4 and TGS R-trees. It is similar to the worst-case example discussed in Section 2. It consists of 10 000 clusters with cen-ters equally spaced on a horizontal line. Each clus-ter consists of 1000 points uniformly distributed in a 0.000 01×0.000 01 square surrounding its center. Fig-ure 8 shows a part of theclusterdataset.
Figure 8: Synthetic dataset CLUSTER Hilbert (H/H4) PR-tree (PR) Greedy (TGS) 451 s 1 495 s 4 421 s Hilbert (H/H4) PR-tree (PR) Greedy (TGS) 1.2 mln 3.1 mln 14.7 mln 583 s 2 138 s 6 530 s 1.7 mln 4.4 mln 21.1 mln Western data Eastern data
Figure 9: Bulk-loading performance on TIGER data: I/O (upper figure) and time (lower figure).
3.3
Experimental results
Below we discuss the results of our bulk-loading and query experiments with the four R-tree variants.
3.3.1
Bulk-loading performance
We bulk-loaded each of the R-trees with each of the real-life tiger datasets, as well as with the synthetic datasets
for various parameter values. In all experiments and for all R-trees we achieved a space utilization above 99%.4 We
measured the time spent and counted the number of 4KB blocks read or written when bulk-loading the trees. Note that all algorithms we tested read and write blocks almost exclusively by sequential I/O of large parts of the data; as a result, I/O is much faster than if blocks were read and written in random order.
Figure 9 shows the results of our experiments using the Eastern and Western datasets. Both experiments yield the same result: The H and H4 algorithms use the same number of I/Os, and roughly 2.5 times fewer I/Os than PR. This is not surprising since even though the three algorithms have the sameO(N
BlogM/BNB) I/O bounds, the PR algorithm is
much more complicated than the H and H4 algorithms. The TGS algorithm uses roughly 4.5 times more I/Os than PR, which is also not surprising given that the algorithm makes binary partitions so that the number of levels of recursion is effectivelyO(log2N). In terms of time, the H and H4 algorithms are still more than 3 times faster than the PR algorithm, but the TGS algorithm is only roughly 3 times slower than PR. This shows that H, H4 and PR are all more CPU-intensive than TGS.
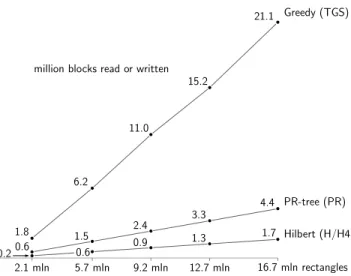
Figure 10 shows the results of our experiments with the five Eastern datasets. These experiments show that the H, H4 and PR algorithms scale relatively linearly with dataset size; this is a result of thedlogM/BN
Be factor in the
bulk-loading bound being the same for all datasets. The cost of the TGS algorithm seems to grow in an only slightly super-linear way with the size of the data set. This is a result of thedlog2Nefactor in the bulk-loading bound being almost
4When R-trees are bulk-loaded to subsequently be updated
dynamically, near 100% space utilization is often not desir-able [10]. However, since we are mainly interested in the query performance of the R-tree constructed with the dif-ferent bulk-loading methods, and since the methods could be modified in the same way to produce non-full leaves, we only considered the near 100% utilization case.
Hilbert (H/H4) PR-tree (PR) Greedy (TGS) 2.1 mln 5.7 mln 9.2 mln 12.7 mln 16.7 mln rectangles 1.8 6.2 11.0 15.2 21.1 0.6 1.5 2.4 3.3 4.4 0.2 0.6 0.9 1.3 1.7
million blocks read or written
Figure 10: Bulk-loading performances on Eastern datasets (I/Os)
the same for all data sets.
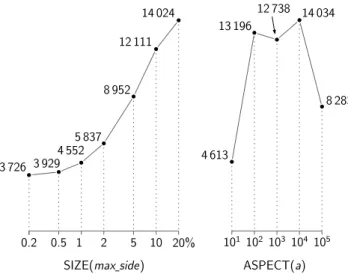
In our experiments with the synthetic data we found that the performance of the H, H4 and PR bulk-loading algo-rithms was practically the same for all the datasets, that is, unaffected by the data distribution. This is not surprising, since the performance should only depend on the dataset size (and all the synthetic datasets have the same size). The PR algorithm performance varied slightly, which can be ex-plained by the small effect the data distribution can have on the grid method used in the bulk-loading algorithm (sub-trees may have slightly different sizes due to the removal of priority boxes). On average, the H and H4 algorithms spent 381 seconds and 1.0 million I/Os on each of the syn-thetic datasets, while the PR algorithm spent 1289 seconds and 2.6 million I/Os. On the other hand, as expected, the performance of the TGS algorithm varied significantly over the synthetic datasets we tried; the binary partitions made by the algorithm depend heavily on the input data distribu-tion. The TGS algorithm was between 4.6 and 16.4 times slower than the PR algorithm in terms of I/O, and between 2.8 and 10.9 times slower in terms of time. Due to lack of space, we only show the performance of the TGS algorithm on thesize(max side) andaspect(a) datasets in Figure 11.
The point datasets,skewed(c) andcluster, were all built
in between 3 471 and 4 456 seconds.
3.3.2
Query performance
After bulk-loading the four R-tree variants we experi-mented with their query performance; in each of our exper-iments we performed 100 randomly generated queries and computing their average performance (a more exact descrip-tion of the queries is given below). Following previous ex-perimental studies, we utilized a cache (or “buffer”) to store internal R-tree nodes during queries. In fact, in all our ex-periments we cached all internal nodes since they never oc-cupied more than 6MB. This means that when reporting the number of I/Os needed to answer a query, we are in effect reporting the number of leaves visited in order to an-swer the query.5 For several reasons, and following previous
5Experiments with the cache disabled showed that in our
3 726 3 929 4 552 5 837 8 952 12 111 14 024 4 613 13 196 12 738 14 034 8 283 0.2 0.5 1 2 5 10 20% 101 102 103 104 105
SIZE(max side) ASPECT(a)
Figure 11: Bulk-loading time in seconds of Top-down Greedy Split on synthetic data sets of 10 mil-lion rectangles each.
Greedy (TGS) PR-tree (PR) Hilbert 2D (H) Hilbert 4D (H4) 100% 110% 120% 123 0.25 0.50 0.75 1.00 1.25 1.50 1.75 2.00% of total area 463 777 1231 1647 2403 2814 3928B rectangles output
Figure 12: Query performance for queries with squares of varying size on the Western TIGER data. The performance is given as the number of blocks read divided by the output sizeT /B.
experimental studies [6, 12, 15, 16], we did not collect tim-ing data. Two main reasons for this are (1) that I/O is a much more robust measure of performance, since the query time is easily affected by operating system caching and by disk block layout; and (2) that we are interested in heavy load scenarios where not much cache memory is available or where caches are ineffective, that is, where I/O dominates the query time.
TIGER data: We first performed query experiments us-ing the Eastern and Western datasets. The results are sum-marized in Figure 12, 13, and 14. In Figure 12 and 13 we show the results of experiments with square window queries with areas that range from 0.25% to 2% of the area of the bounding box of all input rectangles. We used smaller queries than previous experimental studies (for example, the maximum query in [15] occupies 25% of the area) because our datasets are much larger than the datasets used in previ-ous experiments—without reducing the query size the out-the window query performance.
Greedy (TGS) PR-tree (PR) Hilbert 2D (H) Hilbert 4D (H4) 100% 110% 120% 350 0.25 0.50 0.75 1.00 1.25 1.50 1.75 2.00% of total area 685 1208 1814 1959 2676 3460 4386B rectangles output
Figure 13: Query performance for queries with squares of varying size on the Eastern TIGER data. The performance is given as the number of blocks read divided by the output sizeT /B.
Greedy (TGS) PR-tree (PR) Hilbert 2D (H) Hilbert 4D (H4) 100% 110% 120% 154 2.08 5.67 9.16 12.66 16.72 mln rectangles input 574 809 1265 1814 B rectangles output TGS H PR H4
Figure 14: Query performance for queries with squares of area 0.01 on Eastern TIGER data sets of varying size. The performance is given as the number of blocks read divided by the output size
T /B.
put would be unrealistically large and the reporting cost would thus dominate the overall query performance. In Fig-ure 14 we show the results of experiments on the five Eastern datasets of various sizes with a fixed query size of 1%. The results show that all four R-tree variants perform remark-ably well on the tiger data; their performance is within
10% of each other and they all answer queries in close to
T /B, the minimum number of necessary I/Os. Their rel-ative performance generally agrees with earlier results [15, 12], that is, TGS performs better than H, which in turn is better than H4. PR consistently performs slightly better than both H and H4 but slightly worse than TGS.
Synthetic data. Next we performed experiments with our synthetic datasets, designed to investigate how the dif-ferent R-trees perform on more extreme datasets than the
tiger data. For each of the datasets size, aspect and skewedwe performed experiments where we varied the
pa-rameter to obtain data ranging from fairly normal to rather extreme. Below we summarize our results.
ex-0.2
0.5 1
2
5
10 20%
10
110
210
310
410
51
3
5
7
9
SIZE(
max side
)
ASPECT(
a
)
SKEWED(
c
)
100%
150%
200%
902 935 986 1090 1433 2147 3879
913 986 1195 1836 3864
886 887 892 904 968
B
rectangles
output
TGS
PR
H
H4
TGS
PR
H
H4
TGS
PR
H
H4
340%
H
TGS
H
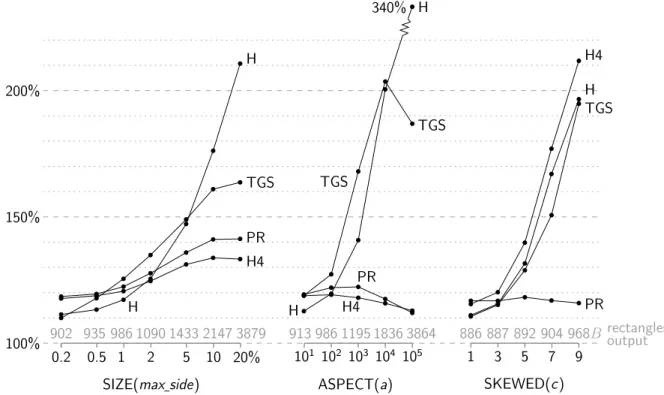
Figure 15: Query performance for queries with squares of area 0.01 on synthetic data sets. The performance is given as the number of blocks read divided by the output sizeT /B.
periments with the dataset size(max side) when varying max side from 0.002 to 0.2, that is, from relatively small to relatively large rectangles. As queries we used squares with area 0.01. Our results show that for relatively small input rectangles, like thetigerdata, all the R-tree variants
perform very close to the minimum number of necessary I/Os. However, as the input rectangles get larger, PR and H4 clearly outperform H and TGS. H performs the worst, which is not surprising since it does not take the extent of the input rectangles into account. TGS performs sig-nificantly better than H but still worse than PR and H4. Intuitively, PR and H4 can handle large rectangles better, because they rigorously divide rectangles into groups of rect-angles that are similar in all four coordinates. This may en-able these algorithms to group likely answers, namely large rectangles, together so that they can be retrieved with few I/Os. It also enables these algorithms to group small rect-angles nicely, while TGS, which strives to minimize the total area of bounding boxes, may be indifferent to the distribu-tion of the small rectangles in the presence of large rectan-gles.
The middle of Figure 15 shows the results of our exper-iments with the dataset aspect(a), when we varya from
10 to 105, that is, when we go from rectangles (of constant
area) with small to large aspect ratio. As query we again used squares with area 0.01. The results are very similar to the results of thesizedataset experiments, except that
as the aspect ratio increases, PR and H4 become signifi-cantly better than TGS and especially H. Unlike with the
sizedataset, PR performs as well as H4 and they both
per-form close to the minimum number of necessary I/Os to answer a query. Thus this set of experiments re-emphasizes that both the PR-tree and H4-tree are able to adopt to
vary-ing extent very well.
The right side of Figure 15 shows the result of our experi-ments with the datasetskewed(c), when we varycfrom 1 to
9, that is, when we go from a uniformly distributed point set to a very skewed point set. As query we used squares with area 0.01 that are skewed in the same way as the dataset (that is, where the corner (x, y) is transformed to (x, yc)) so that the output size remains roughly the same. As expected, the PR performance is unaffected by the transformations, since our bulk-loading algorithm is based only on the rela-tive order of coordinates: x-coordinates are only compared to x-coordinates, and y-coordinates are only compared to
y-coordinates; there is no interaction between them. On the other hand, the query performance of the three other R-trees degenerates quickly as the point set gets more skewed.
As a final experiment, we queried the cluster dataset
with long skinny horizontal queries (of area 1×10⁻⁷) through
the 10 000 clusters; the y-coordinate of the leftmost bot-tom corner was chosen randomly such that the query passed through all clusters. The results are shown in Table 1. As anticipated, the query performance of H, H4 and TGS is very bad; theclusterdataset was constructed to illustrate the
worst-case behavior of the structures. Even though a query only returns around 0.3% of the input points on average, the
tree: H H4 PR TGS # I/Os: 32 920 83 389 1 060 22 158 % of the R-tree visited: 37% 94% 1.2% 25%
Table 1: Query performances on synthetic dataset CLUSTER.
query algorithm visits 37%, 94% and 25% of the leaves in H, H4 and TGS, respectively. In comparison, only 1.2% of the leaves are visited in PR. Thus the PR-tree outperforms the other indexes by well over an order of magnitude.
3.4
Conclusions of the experiments
The main conclusion of our experimental study is that the PR-tree is not only theoretically efficient but also practi-cally efficient. Our bulk-loading algorithm is slower than the packed Hilbert and four-dimensional Hilbert bulk-loading al-gorithms but much faster than the TGS R-tree bulk-loading algorithm. Furthermore, unlike for the TGS R-tree, the per-formance of our bulk-loading algorithm does not depend on the data distribution. The query performance of all four R-trees is excellent on nicely distributed data, including the real-lifetigerdata. On extreme data however, the PR-tree
is much more robust than the other R-trees (even though the four-dimensional Hilbert R-tree is also relatively robust).
4.
CONCLUDING REMARKS
In this paper we presented the PR-tree, which is the first R-tree variant that can answer any window query in the opti-malO( N/B+T /B) I/Os. We also performed an extensive experimental study, which showed that the PR-tree is not only optimal in theory, but that it also performs excellent in practice: for normal data, it is quite competitive to the best known heuristics for bulk-loading R-trees, namely the packed Hilbert-R-tree [15] and the TGS R-tree [12], while for data with extreme shapes or distributions, it outperforms them significantly.
The PR-tree can be updated using any known update heuristic for R-trees, but then its performance cannot be guaranteed theoretically anymore and its practical perfor-mance might suffer as well. Alternatively, we can use the dy-namic version of the PR-tree using the logarithmic method, which has the same theoretical worst-case query performance and can be updated efficiently. In the future we wish to ex-periment to see what happens to the performance when we apply heuristic update algorithms and when we use the the-oretically superior logarithmic method.
5.
REFERENCES
[1] P. K. Agarwal, L. Arge, O. Procopiuc, and J. S. Vitter. A framework for index bulk loading and dynamization. In
Proc. International Colloquium on Automata, Languages, and Programming, pages 115–127, 2001.
[2] P. K. Agarwal, M. de Berg, J. Gudmundsson, M. Hammar, and H. J. Haverkort. Box-trees and R-trees with
near-optimal query time.Discrete and Computational Geometry, 28(3):291–312, 2002.
[3] L. Arge, O. Procopiuc, and J. S. Vitter. Implementing I/O-efficient data structures using TPIE. InProc. European Symposium on Algorithms, pages 88–100, 2002. [4] L. Arge and J. Vahrenhold. I/O-efficient dynamic planar
point location.International Journal of Computational Geometry & Applications, 2003. To appear.
[5] R. Bayer and E. McCreight. Organization and maintenance of large ordered indexes.Acta Informatica, 1:173–189, 1972.
[6] N. Beckmann, H.-P. Kriegel, R. Schneider, and B. Seeger. The R*-tree: An efficient and robust access method for points and rectangles. InProc. SIGMOD International Conference on Management of Data, pages 322–331, 1990. [7] S. Berchtold, C. B¨ohm, and H.-P. Kriegel. Improving the
query performance of high-dimensional index structures by
bulk load operations. InProc. Conference on Extending Database Technology, LNCS 1377, pages 216–230, 1998. [8] B. Chazelle.The Discrepancy Method: Randomness and
Complexity. Cambridge University Press, New York, 2001. [9] D. Comer. The ubiquitous B-tree.ACM Computing
Surveys, 11(2):121–137, 1979.
[10] D. J. DeWitt, N. Kabra, J. Luo, J. M. Patel, and J.-B. Yu. Client-server paradise. InProc. International Conference on Very Large Databases, pages 558–569, 1994.
[11] V. Gaede and O. G¨unther. Multidimensional access methods.ACM Computing Surveys, 30(2):170–231, 1998. [12] Y. J. Garc´ıa, M. A. L´opez, and S. T. Leutenegger. A greedy
algorithm for bulk loading R-trees. InProc. 6th ACM Symposium on Advances in GIS, pages 163–164, 1998. [13] A. Guttman. R-trees: A dynamic index structure for
spatial searching. InProc. SIGMOD International Conference on Management of Data, pages 47–57, 1984. [14] H. J. Haverkort, M. de Berg, and J. Gudmundsson.
Box-trees for collision checking in industrial installations. InProc. ACM Symposium on Computational Geometry, pages 53–62, 2002.
[15] I. Kamel and C. Faloutsos. On packing R-trees. InProc. International Conference on Information and Knowledge Management, pages 490–499, 1993.
[16] I. Kamel and C. Faloutsos. Hilbert R-tree: An improved R-tree using fractals. InProc. International Conference on Very Large Databases, pages 500–509, 1994.
[17] K. V. R. Kanth and A. K. Singh. Optimal dynamic range searching in non-replicating index structures. InProc. International Conference on Database Theory, LNCS 1540, pages 257–276, 1999.
[18] S. T. Leutenegger, M. A. L´opez, and J. Edgington. STR: A simple and efficient algorithm for R-tree packing. InProc. IEEE International Conference on Data Engineering, pages 497–506, 1996.
[19] Y. Manolopoulos, A. Nanopoulos, A. N. Papadopoulos, and Y. Theodoridis. R-trees have grown everywhere.Technical Report available at http://www.rtreeportal.org/, 2003 [20] O. Procopiuc, P. K. Agarwal, L. Arge, and J. S. Vitter.
Bkd-tree: A dynamic scalable kd-tree. InProc. International Symposium on Spatial and Temporal Databases, 2003.
[21] J. Robinson. The K-D-B tree: A search structure for large multidimensional dynamic indexes. InProc. SIGMOD International Conference on Management of Data, pages 10–18, 1981.
[22] N. Roussopoulos and D. Leifker. Direct spatial search on pictorial databases using packed R-trees. InProc. SIGMOD International Conference on Management of Data, pages 17–31, 1985.
[23] T. Sellis, N. Roussopoulos, and C. Faloutsos. The R+-tree:
A dynamic index for multi-dimensional objects. InProc. International Conference on Very Large Databases, pages 507–518, 1987.
[24] TIGER/LineTM Files, 1997 Technical Documentation.
Washington, DC, September 1998.