Volume 11, Issue 4, 2008
Economic Value Added versus Traditional Performance Metrics
in the Czech Food-Processing Sector
Gabriela Chmelíková aL
a Assistant Professor, Department of Business Economics, Mendel University of Agriculture and
Forestry Brno, Zemědělská 1, 613 00, Brno, Czech Republic.
Abstract
The aim of this article is to investigate the relationship between Economic Value Added, traditional performance measures (Return on Assets ‘ROA’ and Return on Equity ‘ROE’) and their ability to measure the creation of shareholder wealth in food-processing firms in the Czech Republic. To assess the relationship, a simple regression test was used and the following hypothesis were tested:
• a strong positive linear relationship exists between EVA and the traditional performance measures of ROA and ROE and
• the EVA measure reflects changes in shareholder wealth more consistently than the traditional performance measures ROA and ROE.
The regression analysis results indicate in all cases a positive correspondence between EVA and financial performance metrics and show higher quality
information content of EVA indicator as regards the ability to create shareholder wealth than the traditional performance measures.
Keywords: economic value added, traditional performance metrics, information content, food-processing sector
LCorresponding author: Tel: + 420728552603
Motivation and Research Goals
From the long-term perspective, each firm aims to maximize its value which
consequently leads to growth in shareholder wealth. Managing a firm in accord with the principle of value maximization requires an operational criterion for growth in shareholder wealth. Thus, it is necessary to find a tool which enables planning, management, and control the firm’s processes in accordance with this principle. In general, firms are managed on a combination of strategic and financial goals. Under strategic goals one usually undertakes, for example, the development of new
technologies, the search for new market segments, or the development of market share. Financial goals (defined and monitored by financial measures) then enable the quantification of these strategic goals, and thus transfer them into measurable and controllable form. The creation of shareholder value can be measured by a range of financial performance measures.
For centuries, economist have reasoned that for a firm to create wealth it must earn more than its cost of debt and equity capital – in the microeconomic terminology, this principle is titled ”creating the economic profit”. A good financial performance measure should describe how well the firm has generated operating profits given the amount of capital invested to produce these profits. In recent years, the Stern Stewart & Company has operationalized this concept under the label Economic Value Added. Similar to many accounting innovations, the concept of EVA promises better performance measurements, incentive schemes, and equity valuation. The concept behind EVA is quite simple – maximize the spread between the return on capital used to generate profits and the costs of using that capital. Through its adoption, corporate executives hope that EVA will lead to increased efficiency in the allocation of all assets and hence increased shareholder wealth. In fact, Stern
Stewart & Company has advocated that EVA can be used instead of earnings or cash from operations as a measure of performance. They have proclaimed “Eva is almost 50 % better than its closest accounting-based competitor in explaining changes in shareholder wealth” (Stewart, 1994), and “Forget EPS, ROE and ROI. Eva is what drives stock prices” (Stewart, 1995).
Since the authors came up with EVA, numerous researchers attempted to verify the effectiveness of EVA using independent empirical evidence (see Biddle, Bowen, and Wallace 1997; Turvey et al. 2000; Feltham et al. 2004; Bacidore et al. 1997;
Berenstein 1998; Kramer and Pushner 1997). Among both the Czech academic researches and practical financial analysts, the use of EVA is still limited due to the lack of empirical evidence of the behaviour of EVA within the Czech economy.
Agribusiness firms are no exception. This article evaluates EVA behaviour in the conditions of the Czech food-processing sector and attempts to develop independent empirical evidence on the indicator’s qualities.
The research is presented in six sections. The first section of the article describes the motivation for this research and the aim of the study. The second section illustrates the food-processing sector in the Czech Republic and the performance measures – EVA, ROE and ROA as such. The third part of this article covers the hypothesis and statistical test performed to investigate the relationship between EVA and the traditional performance measures. The fourth describes the tests and the fifth presents the results. Finally, the last section offers concluding remarks and describes management implications.
Food-Processing Industry in the Czech Republic
Food processing is the fourth largest manufacturing sector in the Czech Republic, after the manufacture of metal, electrical products, and vehicles. Currently, there are estimated 1,070 food processing firms in the Czech Republic, generating nearly 130,000 jobs (the number of employees in the food-processing industry has
decreased significantly in mid 90's following the restructuring of the industry). Although this represents only minor portion (3%) of all jobs in the Czech Republic (figure 1), the industry represents an important factor in local economic
development by providing employment for relatively less skilled labour in the regions. Services 57% Food-processing Agriculture 4% Industry and construction 39%
Figure 1: Employees in the Czech Economy by Sectors
Source: Czech Statistical Office and Ministry of Industry and Trade of the Czech Republic
The annual growth rate in food industry has fluctuated from –2% to 8% since the beginning of this century. In the last three years, growth has remained negative due to the large share of imports in domestic consumption. At present, the Czech food-processing industry generates USD15 billion in annual sales, of which 20 % is
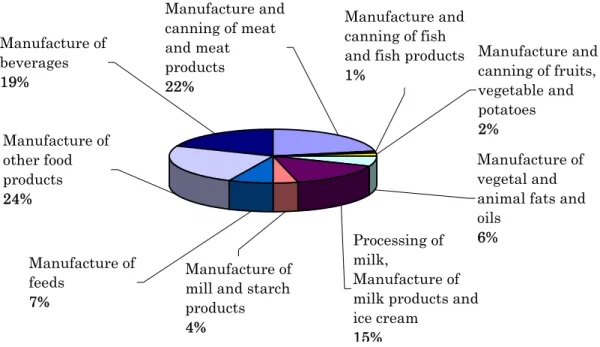
exported. The sector satisfies a wide range of consumer needs which explains its extensive segmentation. Figure 2 shows the structure of food-processing sector in the Czech Republic, the extent of particular segments is expressed by the share on total revenues of the sector in 2006.
Manufacture of feeds
7%
Manufacture of mill and starch products 4%
Processing of milk,
Manufacture of milk products and ice cream
15%
Manufacture of vegetal and animal fats and oils
6% Manufacture and canning of fish and fish products 1% Manufacture and canning of fruits, vegetable and potatoes 2% Manufacture and canning of meat and meat products 22% Manufacture of beverages 19% Manufacture of other food products 24%
Figure 2: Structure of Food-Processing Sector in the Czech Republic
Source: Czech Statistical Office and Ministry of Industry and Trade of the Czech Republic
The segments in figure 2 represent core food industry activities. In addition to directly generating significant economic activity and employment in the Czech Republic, the food industry also has a multiplier effect which generates growth in related industries serving the sector. These include packaging, production of food industry equipment, biotechnology, agriculture, specialized storage and
transportation, food science, and other support industries.
The food processing sector, I argue, provides an appropriate research setting to compare EVA and traditional performance measures. The relatively high marketing and advertising expenses in this sector could lead to significant divergence between performance measures. In addition, in Czech accounting system alternative forms of financing are not a part of the financial statements. This boosts the expectation of divergence, because traditional performance measures, unlike EVA, work entirely with accounting data.
Judged Performance Measures
The EVA Metric
EVA is defined as the spread between the return on capital invested and the cost of capital invested. It describes the ability of the firm to create the economic profit. Contrary to the traditional performance metrics, EVA reflects real costs of the firm since it includes equity costs in additional to the costs included in traditional
performance measures. The EVA metric is based on a simple and straightforward notion, as described in the following equation from Maříková (2001):
1) EVA = NOPAT – Capital * WACC,
where NOPAT is Net Operating Profit After Taxes, Capital is Capital Employed to Generate Operating Profit, and WACC is Weighted Average Cost of Capital.
The EVA concept is based entirely on operating activity; thus, the components of EVA cannot be obtained directly from the financial statements. The EVA authors define operating activity as those operations that serve the basic entrepreneurial purpose. Therefore, it is necessary to convert the accounting data. Under Czech accounting rules, “operating profit” and the corresponding capital include activities that are not directly aimed at fulfilling the basic entrepreneurial purpose.
Examples include the investment of temporary free operating financial asset into securities and creating constructions in progress; neither contributes to current operating activities. On the other hand, other activities necessary for meeting the basic entrepreneurial purpose of the firm are not included in operating profit and capital. Some important exclusions include financial and operative leasing, as well as capitalization and amortization of certain marketing costs, research and
development costs, and unrecorded goodwill.
The EVA model works with three basic components - Capital, NOPAT and WACC which are, according to Maříková (2001), defined as follows:
Capital – the amount of capital employed corresponds to the amount of assets (in the EVA concept they are called Net Operating Assets 'NOA') which are used to generate the operating profit. The structure of these assets is once again
determined by the fact that the EVA concept works entirely with items referring to operating activity - the total assets used in the calculation must be free of non-operating items while the non-operating items not included in the given account of total assets must be added.
To arrive to NOA start with total assets and subtract non-operating assets and decrease of assets value due to price differences. Further add long-term internally
generated intangible assets, add increase of assets value due to price differences and add leased assets. Table 1 provides detailed descriptions of the components of NOA.
Table 1: Components of Net Operating Assets (NOA)
Component Effect Explanation/Example
Fixed assets
Non-operating fixed
assets - e. g. long-term investments or construction in progress. The investments having portfolio character should be singled out of fixed assets as not being connected with the main business activity. Given that construction in
progress does not generate current profits, it should be excluded.
Long-term internally generated
intangible assets
+ Intangible assets such as expenditure on research, marketing, employees training, etc. create future value. These costs should be recognized as an investment and should be activated.
In(de)crease of assets value due to price differences
+
(-) These arise as a consequence of difference in market and accounting prices and are usually less significant as regards current than fixed assets.
Leased assets + Leasing is a popular way of obtaining fixed assets in the Czech Republic. As the title to the asset is legally held by the lessor, it is not shown in the financial statements of the lessee under the Czech accounting standards. As a result, the value of leased assets should be added to NOA.
Current assets
Non-operating
current assets - Short-term financial assets can be separated into two groups. First, financial assets that are necessary for continuous firm operation – e.g. cash or money on bank accounts that are used during the firm operations and, second, financial assets that serve as a financial reserve – e.g. short-term securities, ownership interests or other short-term investments. The latter should be singled out as non-operating financial assets, because they do not serve to the basic entrepreneurial purpose.
In(de)crease of assets value due to price differences
+
NOPAT – The most important principle when converting accounting profit into NOPAT is maintaining the symmetry between NOA and NOPAT. If any operations influence NOA then the same operations have to be taken into account when
determining NOPAT. The most suitable profit basis for the determination of NOPAT in Czech accounting is Profit from ordinary activities.
To arrive to NOPAT start with profit form ordinary activities before taxes and add interest expenses, add non-operating assets costs and original expenditure on internally generated intangible assets, subtract revenues from non-operating
assets, subtract amortization of internally generated intangible assets and subtract tax. Table 2 provides detailed descriptions of the components of NOPAT.
Table 2: Components of Net Operating Profit after Tax (NOPAT)
Component Effect Explanation/Example
Profit from ordinary activities (before tax)
Interest expenses + The costs of foreign capital must be included in profit, only to be subtracted later on together with equity costs within the WACC determination. The same applies to the interest from explicitly non-interest charging liabilities (trade payables, liabilities shareholders and alliance partners, payables to employees, payables to social
security and health insurance…), as well as to the interest from leasing contracts.
Non-operating assets costs Revenues from non-operating assets +
- Revenues and costs connected with financial assets having portfolio and reserve character and revenues and costs of construction in progress.
Original expenditure on internally generated intangible assets Amortization of internally generated intangible assets + -
Correction of expenditures on research, marketing, employees training, etc.
Tax - Subtracting of tax estimation.
WACC – In the EVA model, the costs of capital determine the lowest acceptable rate of profitability for operating assets. They are usually determined by using
2) WACC = ce E/TC + cd D/TC (1-TR),
where D/TC is debt to total capital, E/TC is equity to total capital, ce is cost of
equity2, cd is cost of debt and TR is tax rate.
Conventional Performance Measures
The approaches to measuring a firm’s effectiveness have noticeably changed in the last several decades. Thanks to the growing informative efficiency of capital
markets, there is an apparent drift from traditional measures established on accounting basis towards the tools following the shareholder value. Traditional accounting measures have been used since the middle 1980’s and today represent the most often used performance tools in the Czech Republic. The popularity of these measures, as opposed to shareholder value orienting tools, is the result readily available information needed for their metrics. The traditional accounting measures include, for example, Earnings before Interests and Tax (EBIT), Earnings before Interests, Tax and Appreciation (EBITDA), Return on Capital Employed (ROCE), Return on Total Assets (ROA) or Return on Equity (ROE). The last two measures are the most commonly used profitability ratios among Czech financial analysts. They were also the subject of previous studies evaluating EVA; see Turvey et al. (2000), Krištof and Suchánek (2002).
Return on Total Assets (ROA) indicates the owners’ profitability achieved by all the resources used in the business. Since the ratio shows the earning power of company as a whole, it was chosen for comparison with the EVA metric. Return on Equity (ROE) expresses the relationship between the shareholders’ share of revenues and their previously contributed capital, including retained earnings. From the
shareholders’ point of view, ROE is the most important profitability ratio and therefore is suitable for comparison with EVA. Since these metrics aim to provide information content similar to EVA since they have been used in previous research, ROA and ROE were chosen for comparison with EVA in this paper.
2 Usually Capital Asset Pricing Model (CAPM) is used for cost of equity estimation. This model
determines the cost of equity capital by using the data from the capital market and efficiency of capital market is important here. Unfortunately, CAMP is not a suitable tool for the Czech Republic because of the immaturity of the local capital market. As an alternative tool build up models are used very oft. For example Neumaireová (2002) have developed a model for the Czech domestic environment. The model uses the following procedure for the calculation of the cost of equity:
ce = rf + rsize + rentrepreneurial + rFinStab + rFinStr
where
rf …risk-free rate,
rsize …function characterizing size of the company,
rentrepreneurial …function characterizing earning power,
rFinStab …function characterizing the relation between assets and liabilities,
The Relationship between EVA and Traditional Performance Measures
As mentioned above, in the last decade EVA has been the focus of intense research. While from the theoretical point of view EVA is seen as a superior performance metric, several empirical studies contradict this claim (see Biddle, Bowen, and Wallace (1997); Turvey et al. (2000)). One standard argument against the superiority of EVA results from the statistical relationship between EVA and traditional performance measures. This motivates the first aim of this article - to investigate the relationship between Economic Value Added and traditional performance measures ROA and ROE for food-processing firms in the Czech Republic and identify the differences in the information content of these performance concepts.
This paper assumes (with regard to the specifics of the Czech food processing sector) a difference in the information content of EVA and the traditional performance metrics. This expectation is motivated by two specifics of the Czech food-processing sector:
• Firms of the food-processing sector have specific position in the vertical chain of products as they are positioned on the semi-final position on the way to the customer. As a result, they incur high marketing and advertising costs which should, according to EVA theory, be recognized as an investments rather than expenses. Expenditure on research, marketing, employees training, etc.
creates future value and should thus be capitalized.
• In recent years, alternative forms of financial sources, such as financial and operating leasing, has spread among the Czech firms. In contrast to
International Financial Reporting Standards (IFRS) or U.S. Generally Accepted Accounting Principles (US GAAP), the alternative forms of financing are not a part of Czech financial statements and the traditional performance measures do not incorporate these figures into their metrics. The EVA metric does take these financial sources into account.
These two facts are essential for Czech food-processing firms and challenge the deduction of the first hypothesis investigated in this paper:
H1: A strong positive linear relationship exists between EVA and the traditional
performance measures of ROA and ROE.
The similarity of the measures as performance indicators can be tested with simple linear regression. A strong positive relationship indicates similar information content, and would suggest EVA is easily replaced by ROA or ROE. However, a weak relationship suggests different and potentially valuable information content exists in EVA.
Statistical Test for H1
To examine the relationship between EVA and the traditional performance measures, the statistical significance of the following ordinary-least-squares regression will be examined:
3) EVAi = a + b * Xi,
where EVAi represents the dependent variable, a value of economic value added for given firms in a given time period; Xi stands for a value of traditional performance ROA and ROE metrics for the corresponding firms and the given time period of EVAi; a and b are the values of regression coefficients.
The Relationship between Economic Value Added, Conventional
Performance Measures, and Shareholder Wealth Creation
The second aim of this research is to independently attest whether following EVA leads to enhanced creation of shareholder wealth at Czech food-processing firms. The method of this attesting is similar to Turvey et al. (2000). The key question explored in Turvey’s et al. article is whether EVA actually leads to improved share value, and whether increases in share value are more highly correlated with EVA than any other financial performance metrics. The obvious indicator for judging the improvements in shareholder wealth is the development of the stock price. As the quality of information offered by Czech capital market3 in this respect is very low,
one must first find a criterion for assessing the information content of performance measures suitable for conditions of Czech economy.
The discipline of business valuation deals with the problems of alternative
expression of market value of the firm. By approximation of the market value of a firm, the present value of investors’ expected returns can be calculated, which in turn characterizes the firm’s ability to create shareholder wealth. This
characteristic can be subsequently used as an objective criterion for assessing the performance measures in the ability to create shareholder wealth.
Methods dealing with business valuation are usually classified into three groups:
• methods based on analysis of revenues,
• methods based on analysis of information from capital market,
• methods based on analysis of firms property.
3 Using stock price when making financial decisions requires efficiency of capital market. This
prerequisite is not met even in many developed countries, and the possibility is much less in transitive economies like the Czech Republic with little developed capital market.
Considering the limited availability of trade market data for research of Czech food-processing sector, the first group of methods based on the analysis of revenues appears to be the most appropriate one. The basic method from this group,
Discounted Cash Flows (DCF), exists in several variants. For the approximation of market value of equity, the method of Discounted Cash Flow to Equity (DCFE) is the most fitting. The DCFE method directly quantifies the value of equity on the basis of free cash flows for owners and hence expresses the ability of the firm to create the shareholder wealth.
The validity of equity valuation, like all of the valuation methods, is subject to discrepancies in the estimation of future returns. The estimation depends on the quality of the future revenues forecast, which requires analysis and prognosis of the relevant market as well as analysis of strengths and weaknesses of the firm. The subjective quantification of these categories subsequently results in limited
accuracy of revenues forecast and contributes to discrepancies in the approximation of market value. This handicap is, however, largely overcome in the current setting. For the sample of food-processing firms used in the test, financial figures are
available for the last 5 years. Because historical data is used, at least 5 years of “future values” are known rather than estimated, which is what helps overcome the valuation problem. As a result, the discrepancies in the approximation of market value are eliminated and the indicator offers objective criterion for the evaluation of judged performance measures.
The calculation of DCFE is usually performed in two phases. In the first phase the economist quite reliably forecasts the free cash flow to equity for each of the
forecasted years. The length of the first phase must not be longer than time period in which the financial figures are easy predictable. Usually this phase is about 5 years long. The second phase then covers the period from the end of the first phase to the infinity where the value of the equity in this period is usually determined as the annuity of free cash flow in the last year of the first phase.
The length of the first phase in this research is determined by the accessibility of financial statements following the year when the assessed performance measures were calculated which is 5 years. The length of such time series corresponds to the common length of the first phase when making business valuation.
The market value of the equity MVE can be according to Mařík (2003) specified as: 4)
( )
T t t i CV i FCFE MVE + + + =∑
= 1 1 1 5 1where I is discounting rate equals costs of equity, FCFE is free cash flow to equity4,
CV is continuing value and T is duration of the first phase in years (in this case 5 years).
As mentioned above, the majority of the authors trying to tackle these questions examine the relationship between performance measure being assessed and stock market performance of the firm. Although limited data availability prohibits using this straightforward model in this case, an alternative objective criterion was developed above. Using this criterion, I will evaluate the EVA measure. The result is of critical importance to shareholders.
While formula 4 expresses absolute market value of equity, the economical content of quotient MVE/Equity reveals the firm ability to create value (market value of equity) from the initiate amount of investment (book value of equity).
Using this evaluation criterion the following hypothesis can be deducted:
H2: EVA measure reflects changes in shareholder wealth, which is determined by
quotient MVE/Equity, more consistently than the traditional performance measures ROA and ROE
Statistical Tests for H2
To investigate the relationship between EVA, traditional performance measures and shareholder wealth the statistical significance of the following ordinary-least-squares regressions will be examined:
5) MVE/Equityi = a + b * ROAi
6) MVE/Equityi = g + h * ROEi
7) MVE/Equityi = l + m * EVAi
where ROAi, ROEi, EVAi are the independent variables, measures of return on assets, return on equity and economic value added for given firms and time period; MVE/Equityi is the variable explained above and represents improvement in the
shareholder wealth for the tested firms and time period; a, b, g, h, l and m are values of regression coefficients. The hypothesis will be tested at 95% statistical significance level.
Data
The information content of the performance measures is assed using a sample of food-processing companies in the Czech Republic. The data used for calculating the EVA metric were obtained from the project “The EVATM Ranking Czech Republic”, which was a joint project of Stern Stewart & Co., Central European Capital CZ, s.r.o. and Čekia, a.s. The project ranked first 100 companies in the Czech Republic based on their ability to create economic value added.
The sources for calculating the traditional performance measures as well as for the approximation of the market value of equity5 were the financial statements of evaluated companies, obtained in Obchodní věstník or directly from the companies. Obchodní věstník is a journal where financial statements of the firms that have publication obligation are made public (companies with/above the specified threshold of revenues, number of employees, total assets or legal form have the publication obligation). Where the financial statements were not publicly available, interviews were carried out.
The investigated sample included 18 food-processing firms6 which appeared on the
lists of 100 companies in the Czech Republic with the best ability to create economic value added, published since 2000. Since some of the companies appeared on the list more than once, 42 observations of the relationship between EVA, ROA, ROE and ability to create shareholder wealth were gathered for testing.
Empirical Results
The regression results in Table 1 indicate in both cases a general positive
correspondence between EVA and both accounting performance metrics. The model is statistically significant at 95% level. However, the values of the coefficients of determination indicate that very little of the variation in EVA is explained by the traditional performance metrics. A strong positive linear relationship, which would indicate very similar information content in each measure, does not exist between EVA and the traditional performance measures of ROA and ROE. This fact give evidence against the tested hypothesis H1. According to this empirical evidence of food-processing companies in the Czech Republic, Economic Value Added is
5 A critical point of the EVA’s research in the conditions of Czech economy is a lack of good quality
information from a capital market, which in the most of EVA studies serve as an exogenous criterion for assessing the ability of a firm to create shareholder wealth. In the absence of quality capital market information, a criterion for assessing the information content of performance measures suitable for conditions of Czech economy is developed in this paper.
6 Bestfoods CZ, a.s.; Carla, s.r.o.; Cukrovary TTD, a.s.; Česká drožďárenská společnost, a.s.; Danone,
a.s.; Jihočeská drůbež, a.s.; Karlovarské minerální vody, a.s.; Kofola, a.s.; Maso Planá, a.s.; Opavia-LU,a.s.; Pivovar Radegast, a.s.; Pivovar Velké Popovice, a.s.; Plzeňský prazdroj, a.s.; Povltavské mlékárny, a.s.; Sladovna Hodonice, a.s.; Stock Plzeň, a.s.; Vitana, a.s.; Wrigley, s.r.o.
positively correlated with the conventional performance measures. However, due to the low variation explained by the model it is not possible to replace the information content of EVA by the one of other performance metrics. From the theoretical point of view EVA is considered to be more complex performance metric; it reflects equity costs, capitalizes R&D and marketing expenses, includes leasing into company's balance sheet, etc. The results of this analysis serve to further the econometric investigation of EVA components which stand unexplained by the traditional performance measures. The difference in the marginal response between ROE and ROA would be due to the capital structure and financial leverage.
Table 1: OLS Regressions for Testing H1
F-statistic Independent variable R 2 Coefficient b Limit ROA 0,44850 600233,6 4,2 22,77103 ROE 0,17188 214241,2 4,2 5,811525
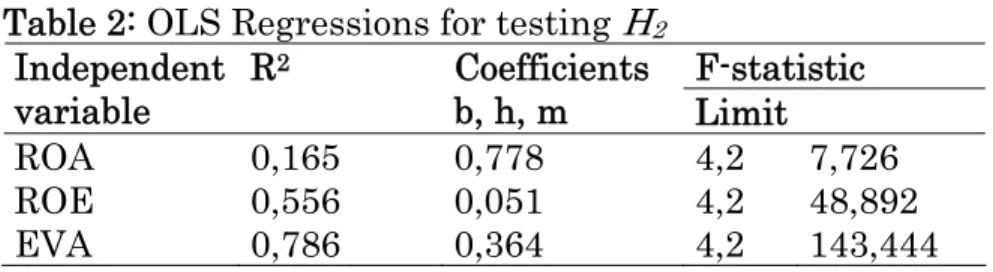
The regression results in Table 2 go along with the tested hypothesis H2; they confirm the EVA measure is more associated with improved shareholder wealth (determined by quotient MVE/Equity) than traditional performance measures ROA and ROE. The model with the explaining variable EVA demonstrates
unambiguously the highest value of the coefficient of determination R2 (almost 80%) and is statistically the most significant from all of the tested models. The coefficient m, representing the slope of the regression line, is statistically significant at required significance level 95%. The models with traditional performance
measures ROA and ROE are statistically significant at 95% level. However, the values of the coefficients of determination indicate very low dependency of these measures on the improvements in shareholder wealth (in ROE model the coefficient of determination did not exceed 56%, in ROA model it is only 16,5%).
Table 2: OLS Regressions for testing H2
F-statistic Independent variable R 2 Coefficients b, h, m Limit ROA 0,165 0,778 4,2 7,726 ROE 0,556 0,051 4,2 48,892 EVA 0,786 0,364 4,2 143,444
Empirical evidence from food-processing companies’ performance in the Czech Republic indicates higher quality information content of EVA indicator with regard to the ability to create shareholder wealth when compared with the traditional performance measures. This finding is consistent with the conclusions of corporate finance theory, which views EVA as theoretically superior performance metric.
Conclusion
The aim of this paper was to assess the claims of EVA proponents on a small group of Czech food companies and define the implication for their managers. From a theoretical point of view, EVA represents a management tool that leads to the efficient use of operating and long- term assets, leads to efficient cost of capital and capital structure decisions, and compels management to focus on value. These are the facts readable from its formula. The question is whether this results in return to shareholders as well.
The analytical results provide some support for the use of EVA as a performance metric:
• With regard to the relationship between EVA and traditional performance metrics, it is empirically confirmed that strong positive linear relationship, which would indicate very similar information content in each measure, does not exist between EVA and the traditional performance measures of ROA and ROE. Subsequently, the traditional performance metrics are not able to
sufficiently explain the observed values of EVA. This conclusion contradicts the result of Krištof (2002). Thus, it is not possible (assuming a theoretical superiority of EVA) to identify oneself with the recommendations of these authors – that it is not necessary to follow EVA because it can be easily replaced by traditional performance measures.
• With regard to the relationship between EVA and shareholder wealth creation, the results of regression analysis show higher quality information content of EVA indicator in relation to the ability of shareholder wealth creation than traditional performance measures. This result is consistent with that of proponents of EVA such as O’Byrne (1996) and contrary to the results of Biddle (1997) or Turvey et al. (2000).
Implications for Managers
The empirical analysis demonstrates that EVA, not accounting performance measures, is the basis of market value. The study has shown that EVA explains differences in market value better than ROE and ROA, which currently represent the most common performance measures in the Czech firms. The results suggest that EVA should be considered when measuring performance of Czech-food processing firms. This recommendation doesn’t mean exclusive using of EVA and throwing out the other measures, considering especially the small sample size and single analysis. Nevertheless it was shown that EVA is better measure than ROE and ROA under certain circumstances (Czech food-processing firms in this case) and should be considered with examining valuation methods in this industry.
It can therefore be recommended that owners of food-processing firms in the Czech Republic should insist on using EVA metric in their firms when making financial decisions. This conclusion should not be seen as rejecting the traditional
performance measures. The EVA metric cannot answer the call for a complex performance measure, which would under any circumstances lead to the
maximization of shareholder wealth. However, the results of this research present important empirical argument, built on data from food-processing sector in the Czech Republic, for the discussion about EVA’s position amongst the performance measures.
Acknowledgements
This paper has arisen in the framework of the projects: GAČR (Czech Science Foundation) no. 402/06/P206 “Research of possibilities and limits of EVA ratio in financial management of businesses from food-processing sector” and within the Research plan of FBE MUAF MSM 6215648904, thematic direction No. 4 „The development tendency of agribusiness, forming of segmented markets within
commodity chains and food networks in the process of integration, globalization and changes of agrarian policy“.
References
Bacidore, J.M., J.A. Boquist, T.T. Milbourn, and A.V. Thakor. 1997. The search for the best financial performance measure. Financial Analysis Journal 53(3): 11–20.
Biddle, G., R.M. Bowen, and J.W. Wallace. 1997. Does EVA beat earnings: Evidence on associations with stock returns and firm values. Journal of Accounting and Economics 24: 301-336.
Berenstein, R. 1998. An analysis of EVA. Merrill Lynch Quantitative Viewpoint. Feltham, G.D., G.E. Isaac, C. Mbagwu, and G. Vaidyanathan. 2004. Perhaps EVA
Does Beat Earnings – Revisiting Previous Evidence. Journal of Applied Corporate Finance 16(1): 83–88
Kramer, J.K., and G. Pushner. 1997. An empirical analysis of economic value added as a proxy for market value added. Financial Practice and Education,
Spring/Summer: 41–49
Krištof, M., and P. Suchánek. 2002. Využití ukazatele EVA při analýze úspěšnosti průmyslových podniků. Systémové řízení. Vyd. 1. Brno, Masarykova
Maříková, P., and M. Mařík. 2001. Moderní metody hodnocení výkonnosti a oceňování podniku. Ekopress Praha.
Mařík, M. 2003. Moderní metody hodnocení výkonnosti a oceňování podniku. Ekopress Praha.
Neumaierová, I., and I. Neumaier. 2002. Výkonnost a tržní hodnota firmy. Grada Publishing. Praha.
O’Byrne, S.F. 1996. EVA and market value. Journal of Applied Corporate Finance 9: 25-116.
Stewart, S. 1994. EVA Roundtabel. Journal of Applied Corporate Finance 7: 46-70. Stewart, S. 1995. Advertisment in Harvard Business Review, November-December:
20.
Walbert, L. 1994. The Stern Steward performance 1000: Using EVA to build market value. Journal of Applied Corporate Finance 6: 109-120
Turvey, C.G., L. Lake, E. Duren, and D. Sparling. 2000. The Relationship between Economic Value Added and the Stock Market Performance of Agribusiness Firms. Agribusiness 16 (4): 399-416