No. 0413
Social Protection Discussion Paper Series
Disability Employment Policy
Daniel Mont
July 2004
Social Protection Unit Human Development Network
The World Bank
Social Protection Discussion Papers are not formal publications of the World Bank. They present preliminary and unpolished results of analysis that are circulated to encourage discussion and comment; citation and the use of such a paper should take account of its provisional character. The findings, interpretations, and conclusions expressed in this paper are entirely those of the author(s) and should not be attributed in any manner to the World Bank, to its affiliated organizations or to members of its Board of Executive Directors or the countries they represent.
For free copies of this paper, please contact the Social Protection Advisory Service, The World Bank, 1818 H Street, N.W., Washington, D.C. 20433 USA. Telephone: (202) 458-5267, Fax: (202) 614-0471, E-mail:
[email protected]. Or visit the Social Protection website at http://www.worldbank.org/sp.
Public Disclosure Authorized
Public Disclosure Authorized
Public Disclosure Authorized
Public Disclosure Authorized
Disability Employment Policy
Daniel Mont
Daniel Mont
Disability and Development Team The World Bank
1818 H St. NW, 20433 (202) 473-5366
The author would like to thank John Bound, Philip DeJong, Jean Fares, Judy Heumann, Robert Holzmann, Tom Hoopengardner, Bob Ransom, Bobby Silverstein, David Wittenburg, Ilene Zeitzer, and Wolfgang Zimmerman for reviewing earlier versions of this paper.
ABSTRACT
This paper is the first in a series aimed at analyzing disability employment policy and developing recommendations for policy reform in middle income countries. As the first paper in this series, this study provides a general overview of the relationship between disability and employment, focusing primarily on disability employment policies in OECD countries. It discusses how well these policies address the dual functions of
integration and income security, and reports on recent trends. A variety of policy tools are examined: full and partial disability cash benefits, vocational rehabilitation and training, supported work, sheltered and public sector employment, hiring quotas, tax incentives for employers, and anti-discrimination laws. A general set of recommendations are offered on designing disability employment policies in emerging economies.
DISABILITY EMPLOYMENT POLICY TABLE OF CONTENTS
I. Introduction
II. Program Eligibility: What do we mean by “disabled”?
III. Labor Force Participation: What is the relationship betwe en employment, unemployment and disability?
IV. Promoting Employment: What tools do we have? A policy typology
Compensation versus integration
V. Disability Policy in Developed Countries: How well have policies performed? Cash Benefits -The Netherlands -Poland Quotas -France -China -Japan Anti-Discrimination Laws -The United States
Vocational Rehabilitation and Training -Germany
Supported Employment
Wage Subsidies and Other Employer Incentives. -Sweden
Sheltered Work
VI. Disability Management: Keeping People Employed
I. Introduction
1.1 Disability policy has two goals which are at times in conflict. Income security – the simpler goal – can be provided with cash and in-kind benefits. Adequate food, housing, and health care can assure disabled persons a decent life free from fear and want.
Beyond income security is the goal of complete integration into social and economic life, allowing persons with disabilities a full range of opportunities to participate in the
economy and society at large. Removing barriers to participation that plague disabled persons not only improves their lives but society as a whole by increasing productivity, lowering unemployment, and reducing reliance on government transfers.
1.2 An inherent tension exists between the goals of integration and income security. Policies aimed at generating full participation of people with disabilities often downgrade the safety net, creating more risks. People who are not successful at achieving a certain level of integration can suffer. Yet, programs that guarantee benefits can serve as a disincentive to participate in the labor market. The challenge is to provide supports and incentives that facilitate full participation, while ensuring the means to live a decent life regardless of any disability.
1.3 Indeed, the focus of disability policy throughout most of the OECD countries has recently shifted away from guaranteed income security and towards econo mic
integration. For this shift to be successful increased responsibilities for disabled persons must be accompanied by the guarantee of adequate supports. These supports consist of adequate cash benefits, services, incentives for workers and employers,
anti-discrimination laws, and societal attitudes that promote full participation in the labor market.
1.4 The movement towards integration, championed by disabled people, has been spurred on from an increased appreciation for the nature of disability. Disability has come to be seen as arising not simply from a medical condition, but rather from the interaction between impairments and the physical, social, and policy environments. In an environment and culture that accommodates the special needs of people with various impairments, the impact of having a disability would be greatly limited.
1.5 Complicating disability policy is the heterogeneous population it serves. Disabling conditions are quite varied, ranging from mild to significant and consisting of physical disabilities, sensory disabilities, mental disabilities that are cognitive or
developmental in nature, and mental health conditions. Each of these has its own particular challenges. Furthermore, some are congenital while others are the results of injuries or illnesses. They can affect the old or the very young, meaning that policies must address people entering the workforce, those wishing remain or re-enter it, and those nearing the end of their working lives.
1.6 According to the UN, about 10 percent of the world’s population is disabled at any one time. However, this 10 percent underestimates the impact of disability. When disabled persons are not fully integrated into society and the economy, they pose added
costs on their families, for example more demands on their time which may preclude time spent in other productive pursuits. A study in Uganda suggests that households with a disabled member are not only significantly more likely to be poor, but also have lower school attendance rates among their children.1 In addition, many people have temporary disabilities. Finally, even those without disabilities are at risk of becoming disabled. Therefore, by incorporating the concerns of disabled people, programs and policies are improved for everyone.
1.7 Complicating the process of integrating disabled people into the economy is the stigma and discrimination associated with being disabled. Disabled people and their families, are often taught to be ashamed of their condition, or to consider themselves as not full human beings. In some countries, disabled people are actually hidden from view or denied basic rights by their own families. Discrimination in labor markets – and in the provision of social programs such as health and education – often provide significant barriers.
1.8 This paper is the first in a series aimed at analyzing disability employment policy and developing recommendations for policy reform in middle income countries. As the first paper in this series, this study provides a general overview of the relationship
between disability and employment, focusing primarily on disability employment policies in OECD countries. It will discuss how well these policies address the dual functions of integration and income security, and will report on recent trends. A variety of policy tools will be examined: full and partial disability cash benefits, vocational rehabilitation and training, supported work, sheltered and public sector employment, hiring quotas, tax incentives for employers, and anti-discrimination laws. A general set of
recommendations will be offered on designing disability employment policies in emerging economies.
1.9 Following this paper, a series of case studies of disability employment policy in a number of middle income countries will be undertaken. These will offer more detailed analyses of the types of policies and working experience of disabled people in non-OECD economies. The final paper in the series will summarize these case studies and offer a more developed set of recommendations.
II. Program Eligibility: What do we mean by “disabled”?
2.1 Disability refers to a long or short-term reduction in a person’s activity resulting from an acute or chronic condition. It is multi- faceted, complex, and difficult to define. Disability goes beyond the description of a particular medical condition. In fact, it is best understood as the interaction between such a condition and a host of personal, social and environmental factors.
1
Hoogeveen, J. “Measuring Welfare for small Vulnerable Groups Poverty and Disability in Uganda,” Working Paper, December, 2003
2.2 The conceptual framework used in this paper was developed by the World Health Organization (WHO) and used in the International Classification of Functioning,
Disability and Health (ICF). According to the WHO, “[the] ICF is a classification of health and health related domains that describe body functions and structures, activities and participation. The domains are classified from body, individual and societal
perspectives.” 2 The ICF explicitly recognizes that any evaluation of a person’s functioning and disability must incorporate the physical and cultural context in which they live, and so also includes a list of environmental factors.
2.3 For example, a medical condition such as polio may result in certain functional limitations, such as the inability to use one’s legs (body function) which then limits a person’s mobility (an activity) which might make it difficult for that person to attend school or find employment (participation).
2.4 The extent to which a person’s participation is affected by the functional limitation of paralysis depends on many things. First of all, cultural barriers such as stigma or prejudice might impede not only participation, but even which activities a person is willing or able to attempt. Family resources -- financial and non-financial -- will also have an influence, as will the physical environment (e.g., the existence of ramps, roads, and accessible buildings) and the policy environment (e.g., anti-discrimination laws and vocational rehabilitation programs).
2.5 Paralysis in and of itself is not “disabling” in the sense of preventing full
participation in the economic and social life of the community. Without an environment that provides the proper supports and accommodations, paralysis becomes disabling. Programmatic definitions of disability vary across countries, and even within countries depending on the program. Generally speaking, programs do not use the ICF model. Sometimes, a medical model is used. That is, a certain medical condition is considered synonymous with a disability. Other times, the definition is tied specifically to earning ability or to an assessment of a person’s functional capacity. Some programmatic definitions contain a mixture of these definitions.
2.6 Further compounding the difficulty of discussing disability in general terms is the heterogeneity of the disabled population. Disabilities can vary in several dimensions. First, the types of disabilities include: physical disabilities, sensory disabilities, such as deafness and blindness, cognitive and developmental disabilities (e.g., mental retardation and autism), and mental health conditions (e.g., schizophrenia and depression). Second, the causes of disability are diverse. They can be congenital (e.g., Down Syndrome), disease-related (e.g., polio and onchocersiasis), injuries resulting from conflict, work-related incidents, traffic accidents or some other cause, or simply a natural result of the aging process. People with disabilities range from newborns to the very old.
2
See the ICF Home Page’s introduction at www3.who.int/ic f/icftemplate.cfm. In an earlier formulation known as the ICIDH, the elements of this classification system were referred to as impairments,
2.7 In fact, the current aging of the world’s population is expected to increase the prevalence of disability. In every region of the world the percentage of the population over the age of 60 is predicted to rise over the next few decades.3 And disability is known to increase significantly with age. In the United States, for example, about 2.3 percent of previously working 35-39 year olds have experienced the onset of a work-ending disability. For 50-54 and 60-64 year olds, that rate increases to 6.2 percent and 15.1 percent, respectively.4
2.8 The effects of disability can also vary from mild to extreme. This is true for all types of disabilities, mental or physical. And for many conditions, the duration can extend from a short period to a lifetime. Furthermore some conditions -- especially certain mental health problems -- can be episodic in nature. The number of people with mental illness enrolled in disability benefit programs has been growing significantly in recent years across OECD countries.
2.9 When discussing disabled persons it is important to not form a single image in one’s mind. The needs and concerns of people with disabilities can be quite varied. What is important, however, is the notion that all people – whether classified as disabled or not – should have the proper supports and accommodations necessary for them to be complete members of society.
III. Labor Force Participation: What is the relationship between employment, unemployment and disability?
3.1 Unemployment rates are much higher for disabled people. For example, in the late 1990s the unemployment rate among disabled adults, age 20-64, was 80 percent higher than for the non-disabled population in OECD countries.5,6
3.2 The gap between the unemployment rate of those with and without disabilities varies substantially across countries. In Italy, for example, the unemployment rate for disabled persons was 14.5 percent compared to 13.1 for the non-disabled (as explained in an earlier footnote, this unemployment rate refers to the percentage of the labor force that is unemployed, not the percentage of the working-age population). In Austria, Germany, and the Netherlands, however, the unemployment rate of disabled persons was about 170
3 “Averting the Old Age Crisis,” World Bank Policy Research Report, 1994 p. 26
4 Reno, V. and J. Eichner , “Ensuring Health and Income Security for an Aging Workforce,” National Academy of Social Insurance, December 2000
5
OECD, “Transforming Disability into Ability: Policies to Promote Work and Income Security for Disabled People”, 2003, p. 37
6
Unemployment is defined throughout this paper as not having employment but actively looking and being available for work. That is common among national statistical agencies. However, figures on the
unemployment rate from the OECD report refer to the unemployed as a percentage of the labor force, which is higher than the statistics which show the percentage of the working-age population which is unemployed, since some people are not in the labor force. For comparing the disabled population to the non-disabled population, this is not important.
percent of that of the overall population. And in Korea, the unemployment rate for people with disabilities was over three times as high as for non-disabled people. 3.3 In fact, the gap between unemployment rates between the disabled and non-disabled population can account for a significant component of a country’s overall unemployment rate. For example, in Germany the unemployment rate for disabled people was 20.5 percent, compared to 7.4 percent for the non-disabled. The overall unemployment rate was 9.3 percent. If people with disabilities had similar work experiences as their non-disabled counterparts, the national unemployment rate for Germany would have been nearly two percentage points lower. In the Netherlands it would have been about 2.4 percentage points lower.
3.4 In Korea, however, even though the reported une mployment rate for those with disabilities is three times the rate of those without disabilities, the overall unemployment rate would only have been 1.2 percentage points lower. Why? Because of the
significantly smaller percentage of people with disabilities in Korea. The lower prevalence of disability, though, can be traced to how disability is defined. As can be seen in Table 3.1, the definition of disability and how data are collected leads to widely disparate estimates of the disabled population. All cross-country comparisons must be made with the definition of disability in mind.
3.5 Moreover, it is important that we look not only at unemployment rates, but also employment rates. For example, one reason for the lower relative rate in Italy – and other Southern European countries – is the relative lack of labor force participation. The barriers that raise unemployment can also serve to keep disabled persons out of the labor market in the first place, thus lowering measured unemployment. The gap between the disabled and the non-disabled is even larger than the unemployment figures suggest because fewer disabled people are even looking for work.
3.6 Uncovering the reasons behind cross-country variation in employment rates is complex. A number of exp lanations exist for the differently sized gaps between the unemployment rates for people with and without disabilities found in different countries: 1) Differing definitions of disability. The rate of disability found in household surveys and censuses varies dramatically. This variation results from differing measures of disability, different data collection techniques, and different reactions to survey questions by respondents. In Table 3.1, we see that the rate of disability in India was measured as .2 percent. In Australia it was 18 percent. Clearly, a common definition and comparable quality data would not yield a rate of disability 9,000 percent higher in Australia. 7 Indeed, one reason for low rates of reported disability in some countries is the intense stigma having a family member with a disability can entail.
7
Table 3.1: Prevalence of Disability in Selected Countries, Selected Years
Country Percent of Population
Disabled Year Data Collected India 0.2 1981 Bangladesh 0.8 1982 Brazil 0.9 1991 Zambia 0.9 1990 Níger 1.3 1988 Egypt 4.4 1996 China 5.0 1987 Italy 5.0 1994 Germany 8.4 1992 Netherlands 11.6 1986 Austria 14.4 1986 United States 15.0 1994 Australia 18.0 1993
Source: United Nations Statistical Division
2. Different levels of accommodations and support. As outlined in a later section of this paper, these supports can include vocational rehabilitation and training, supported work environments, sheltered employment, wage subsidies, quotas or tax incentives for employers. The merits of these programs will be addressed later, but they all can potentially influence the labor force participation rate and the rate of unemployment. 3. Different cash benefit programs. The degree to which work incentives or disincentives are built into the structure of any cash benefit program targeted towards disabled persons will influence their labor force participation rate, their work experience, and hence the rate of unemployment.
4. Discrimination. Discrimination against disabled people and the misplaced belief that they cannot contribute fully to the economy can be substantial barriers towards their employment. In some countries, such as the United States and Canada, there are strong anti-discrimination laws. The effectiveness of these la ws, unfortunately, is not clear. 3.7 Unemployment among disabled people is not merely a result of cyclical swings in the economy. For example, during the 1990s the United States experienced a prolonged period of economic growth. Every major sub-population within the United States experienced growth in employment and economic well-being except men with
disabilities.8 All groups -- men, women, single parents, ethnic minorities – saw gains. 3.8 Overall, mean household income of men without disabilities rose 9.4 percent; for their disabled counterparts it fell 2.9 percent. And while women with disabilities
8
Stapleton, D. and R. Burkhauser, “The Decline in Employment of People with Disabilities: A Policy Puzzle,” W.E. Upjohn Institute for Employment Research, Kalamazoo, MI, 2003
experienced a 5.6 percent rise in mean household income, it was less than half the 12.6 percent increase seen by women without disabilities.
3.9 Theories behind this discrepancy offer a variety of explanations. While these explanation refer to experience in the United States, the basic themes have resonance for designing programs and thinking about disability in middle income and developing countrie s. The two most prominent theories are:
(1) Programmatic changes. The eligibility rules for receiving benefits eased at the start of the 1990s, which approximately coincided with a recession. Many people who were out of work started receiving benefits and never left the program. While expanding
eligibility can insure that more people who need benefits receive them, it can create benefit traps if work supports and incentives are not built into the program. Poland and The Netherlands, as explained later in this paper, faced this situation to an even more pronounced degree.
(2) Changes in the nature of work. This argument cuts both ways. Recently work has become less physical. This potentially makes more jobs accessible to people with physical disabilities. However, modern jobs often involve more life- long learning and fewer repetitive tasks, which might make work harder to come by for people with
cognitive disabilities. A faster paced workplace and the increasing efficiency demands of globalization can also increase stress and either cause or exacerbate mental illness. These factors have been cited, for example, in the rise of serious anxieties stemming from the workplace in Japan from 53 percent of the workforce in 1982 to 63 percent in 1997.9 The Second European Survey on Working Conditions found 28 percent of workers reported work-based stress.
3.10 This line of reasoning also has implications for developing countries. For example, in a subsistence farming scenario, certain impairments, like amputated legs, might become less disabling as the economy becomes more developed and less physical work is required. Conversely, an impairment like dyslexia, which would not even have been noticed, might become a disability once jobs start requiring higher degrees of literacy. And clearly increased pressures to modernize and adapt to global competition can cause stress, which can lead to depression.
3.11 It is clear that to combat non-employment among disabled persons, employment policy must incorporate the issue of disability. Employment policies that ignore these concerns will not benefit disabled people and their families to the same extent that they will benefit the non-disabled.
9
Harnois and Gabriel, “Mental Health and Work” Impact, Issues, and Good Practices,” WHO and ILO, Geneva, 2000
IV. Promoting Employment: What tools do we have?
4.1 A variety of policy tools are used around the world with the aim of increasing the employment of disabled persons. This section of the paper provides a brief summary of the scope of these policies and their typography.
4.2 A policy typology. According to Semlinger and Schmid (1985) the policies fall into three broad categories:10
4.3 Regulations attempt to directly affect the behavior of employers by prescribing certain legal obligations for their actions. They affect the demand side of the labor market by requiring emp loyers to hire disabled workers.
4.4 Quotas for hiring people with disabilities, and the accompanying fines for non-compliance, are common examples of regulations. Other such policies include requiring employees with disabilities for government contracts and representation by a disability ombudsman. Most notably in Canada and the U.S., anti-discrimination legislation gives people with disabilities legal recourse if their disabilities negatively influenced their hiring, firing, or experience on the job if their employers refused to make reasonable accommodations.
4.5 Counterbalances are designed to increase the competitiveness of people with disabilities in the labor market. The assumption of such policies is that disabled persons are initially less productive, or require greater training or start-up costs. Counterbalancing policies can consist of wage subsidies, vocational rehabilitation, funds to cover
accommodations in the workplace, and supported employment (for example, the use of job coaches). As such they work on the demand side by lessening the extra costs of hiring disabled workers, but also on the supply-side by increasing their productivity. 4.6 Substitutions, unlike regulations and counterbalances, are policies that implicitly assume that people with disabilities can not fully participate in the open labor market, or at least that is the case for a significant subset of people with disabilities. Substitutions refer to sheltered employment or specially arranged jobs in the public or private sector. 4.7 A policy strategy solely based on regulations implies a belief that people with disabilities have a right to open employment and that the costs of their participation are small and easily absorbed by the private sector. Counterbalances are added if the productivity gap between people with and without disabilities is wide enough to warrant mechanisms to shift the cost of those gaps from employers to the general public.
Substitutions are resorted to if those gaps are so wide that policymakers feel it is more economically efficient to offer an alternative to the open labor market.
10
Semlinger and Schmid (1985), as cited in Berkeskog (2001), actually referred to regulations,
compensations, and substitutions, but compensations has been replaced with counterbalances to avoid confusion with a different use of the term “compensation” used below.
4.8 Substitutions are frowned upon by the disability community. Such segregation is generally viewed as demeaning. Also, advocates believe that lack of access to the open labor market precludes the development of the social and job skills necessary for full integration into the economy, and is thus a self- fulfilling prophecy. Policies that segregate disabled people, such as sheltered employment, also keep people without disabilities from understanding the talents and concerns of disabled persons and can re-enforce misconceptions. Furthermore, as discussed below, sheltered employment can be easily manipulated for the benefit of those running the program, as opposed to the workers.
4.9 In addition to these policy tools there are also direct benefit payments, either cash or in-kind. Benefits are sometimes needs-based and sometimes tied to contributions to a pension. They can consist of flat payments or be tied to previous wages or the amount of accumulations within a pension system. In some countries, benefits are mostly or even exclusively given to people with total disabilities. In other countries, partial disability benefits are awarded, as well.
4.10 Cash benefits, while improving the living standards of people with disabilities, also create a work disincentive. Numerous studies have shown a link between the level of disability benefits and the number of applicants for these benefits and the drop off in labor participation. Still, many people – especially if the regulations, accommodations, and counterbalances mentioned earlier are not in place – have impairments that limit or preclude work. As stated before, the challenge is to encourage participation while providing an acceptable minimum living standard. As will be discussed later in this paper, however, attempts to do this have not met with great success.
4.11 Compensation versus integration. A recent report by the OECD, entitled “Transforming Disability into Ability (2003),” lays out the following general policy approaches, which coincides nicely with the above typology.
4.12 A compensation policy approach stresses benefit payments as opposed to
economic integration. It consists of adequate and permanent benefits that are available to a broad range of disabled persons. Such an approach generates high recipiency rates and low levels of employment.
4.13 An integration policy reflects a different emphasis. Employment is encouraged with regulations and programs that try to offset the additional costs of hiring disabled persons. Moreover, this approach also incorporates tighter eligibility rules for benefits, combined with a lower level of payments.
4.14 Some countries are weak both when it comes to comp ensating or integrating. Some countries are strong in both dimensions – they have integrative policies but generous and broadly accessible benefits.
4.15 n general, OECD countries have been incorporating the precepts of the integration policy approach, and moving away from compensation policy. The range of programs, though, contains many different variations.
4.16 Table 4.1 groups countries by recent changes in disability policy. Countries in the row labeled “strong expansion” have significantly increased or strengthened policies that promote the inclusion of disabled people in the workforce. Countries in the “minor expansion” row have made much smaller steps in that direction. Interestingly, the OECD study found no countries with recent policy reforms actually limiting inclusion.
4.17 The columns in Table 4.1 correspond to recent changes in compensation policy. Italy and the Netherlands have reduced the extent of cash benefits in recent years. That has not been the case in Poland, Canada, Franc e, Korea, the United States or Switzerland. 4.18 So, for example, Australia has tightened their compensation policy to some extent – that is lowered the amount of cash benefits it provides, but at the same time has
strongly expanded its efforts to support disabled people in their efforts to gain and secure employment.
Table 4.1: Direction of Disability Policy Change in the Period 1985-2000 Compensation Policy Strong Contraction Some Contraction No contraction or expansion Strong Expansion Netherlands Australia Denmark United Kingdom Poland Intermediary Expansion Italy Austria Germany Norway Spain Sweden Canada France Korea United States Integration policy Minor Expansion Belgium Mexico Portugal Turkey Switzerland
Source: Table 7.1 in “Transforming Disability Into Ability” (2003) from OECD database on programs for disabled persons, see text for column and row definitions
4.19 In assessing any disability policy, the effectiveness of targeting must be examined. The operative definition of disability boils down to one of eligibility for benefits. But as Aarts and De Jong point out, “even among the population that is covered by disability insurance, being disabled and being a disability benefit recipient are two contingencies that do not fully overlap. The sizes of the non-overlapping parts – disabled without benefits and non-disabled with benefits – are an indication of the targeting
performance of a disability insurance system. Due to the elusiveness of disability these parts will ne ver be empty.”11
V. Disability Policy in Developed Countries: How well have policies performed? 5.1 Disability policy comprises a wide range of policies that include cash payments, job-related services and supports, anti-discrimination laws, quotas, and even separate employment. This section will review these different policy tools and their use in a number of developed countries.
5.2 Cash Benefits. All OECD countries provide direct cash benefits to disabled persons. These benefits are provided through three types of programs: universal
programs that pay benefits to all people with disabilities, contributory programs that pay
11
Aarts, L. and P. De Jong, 1999. “Disability Insurance in a Multi-Pillar Framework, Paper Prepared for World Bank Conference: New Ideas about Old Age Security)
benefits to disabled workers who have made tax-based contributions to the program, and non-contributory programs that are often means-tested and sometimes targeted to
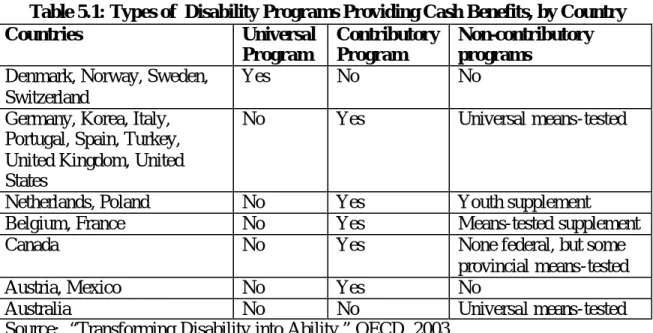
particular groups. In OECD countries, benefits from contributory programs are about 50 percent higher than non-contributory programs.12 Table 5.1 shows the types of programs found in various OECD countries.
Table 5.1: Types of Disability Programs Providing Cash Benefits, by Country
Countries Universal Program Contributory Program Non-contributory programs
Denmark, Norway, Sweden, Switzerland
Yes No No
Germany, Korea, Italy, Portugal, Spain, Turkey, United Kingdom, United States
No Yes Universal means-tested
Netherlands, Poland No Yes Youth supplement
Belgium, France No Yes Means-tested supplement
Canada No Yes None federal, but some
provincial means-tested
Austria, Mexico No Yes No
Australia No No Universal means-tested
Source: “Transforming Disability into Ability,” OECD, 2003
5.3 Generally speaking, once recipients go on these programs they rarely exit them to return to work. In fact, the outflow rate in most of these countries is about 1 percent (Aus tralia, Canada, Germany, Norway, Portugal, Sweden, and the United States). Two reasons could account for such low exit rates: first, recipients have disabilities severe enough to preclude returning to work, at least in the work environments that are available to them. Second, the programs have strong economic disincentives for finding
employment. That is, the financial rewards for returning to work are not large enough for people to make the effort. This situation can especially be true in a country like the United States, where health insurance is also provided through eligibility for the disability program but not guaranteed if the recipient returns to work.
5.4 Low exit rates from disability programs exist in programs with a strong focus on reducing inflow by providing vocational rehabilitation and training on intake (e.g., Denmark Germany, Norway, and Sweden) as well as countries with historically poor economic incentives for returning to work (e.g., Australia and the United States). These results are expected. Countries that promote employment are more likely to screen out those people most likely to leave the program, therefore letting in a higher proportion of people whose employment options are more limited and reducing exit rates. People in countries with poor economic incentives for becoming employed, will not see a financial advantage to working themselves off of the program.
12
5.5 Outflow rates are remarkably stable, even in response to programmatic changes, and are similar across countries with very different levels of benefits. For example, in the countries cited with the smallest outflow rates, the maximum replacement rate for lost earnings due to a disabling condition range from about 35 or 40 percent in the United States (plus medical insurance) to about 70 percent in Sweden. The unresponsiveness of outflow rates to policy parameters, such as replacement rates, is troubling and not well-understood. Clearly, other barriers to employment are dominating the ability to leave disability programs.
5.6 One possible explanation for the small outflow rates, is the risk in taking on employment even when it is found. If disabled people are uncertain about how successful they will be upon returning to work, they may opt to not jeopardize future benefits. Recipiency is based on an inability to work (or in some countries with partial benefits, a reduced ability to work). Finding employment would terminate benefits, and could call into question a recipient’s disability status.
5.7 Several reforms to cash benefit programs have tried to mitigate this risk. Some countries allow recipients to put their benefits “on hold” so if their attempt to return to work fails, they can re-start them without a new application procedure. This “on hold” period can be brief – three months in Belgium – to quite extensive – up to three years in the Netherlands, Norway, and Sweden. In Canada, benefits are not put on hold, but there is a “fast track” re-application procedure. Other countries have attempted to increase the financial remuneration from returning to work, by offering temporary wage supplements, tax abatements, or tax credits. The United States has a trial work period where cash benefits continue for at least nine months, after which there is an extended period of eligibility lasting three years, where a former recipient can immediately start receiving benefits again if his or her earnings fall below the eligibility limit.13
5.8 Few people take advantage of these programs. The reasons are not entirely clear, but there are two hypotheses. First, the problem lies on the demand side of the equation. That is, either because of the stigma they feel and the discrimination they face, or because the lack of proper supports in the workplace, jobs where people with disabilities can be successful are hard to come by. For example, people with cognitive disabilities can be quite successful in work situations, but sometimes jobs must be structured according to their strengths and abilities. The same may be true for people with physical disabilities or mental health conditions.
5.9 It is worth noting here that the range of needed supports can vary widely. In fact, for the largest number of people the supports required to stay in the workforce can be quite limited. According to a recent study, back injuries are “typically the leading physical cause of receipt of disability benefits, and the second leading cause of disability
13
In the United States, health care benefits are also tied to disability benefits. For the means tested program (SSI) these benefits start immediately. For the contributory program (SSDI) there is a five month waiting period for cash benefits, followed by two year waiting period for health care benefits.
benefits for any reason.”14 They usually occur among people who are already employed. Relatively simple interventions, such as restructuring of work responsibilities and early vocational rehabilitation interventions, can have large positive impacts on return to work. 5.10 Second, some analysts blame the effect of the cash benefit programs on the psyche of disabled people. In order to qualify for benefits, they must make the case that they are not capable of working (in a system with only full benefits) or that their capacity for working is impaired (in a system with partial benefits). A greater their degree of disability leads to larger their benefits. To return to work, they must repudiate the case they made. Without a major medical recovery, increased supports, or a perceived improvement in the degree to which employers accommodate people with disabilities in the workplace, there is no reason for this self-perception to change.
5.11 Furthermore, when they are out of the workforce job skills and self- identification as a worker can atrophy. This is especially true for programs with a waiting period. In some countries, after qualifying on the basis of a disability, people must wait a period of time – without improving their work status – before receiving benefits. In the United States this period is five months (with an additional 24 months for health insurance). In Belgium, Italy, and Switzerland the waiting period is a full year.
5.12 Even if a disabled person wants to substitute work for cash benefits, structural barriers such as inaccessible transportation and workplaces can impinge on their ability to do so. And in countries with no partial disability benefits, the choice between cash
benefits and work can be an all or nothing decision.
5.13 A few countries have seen higher numbers of recipients exit their programs. For example, in the mid-1990s the exit rate from the Netherlands disability program was about 7 percent. This resulted from a major re-testing effort to determine disability status, as well as a young recipient population and a relatively low level of earning
capacity reduction required to qualify for the program initially.15 For similar reasons, the United Kingdom also has a relatively high outflow rate at about 3 percent.
5.14 The higher rate of returning to work in the Netherlands in the past decade, though, is counterbalanced by the unusually high entry rates. Poland is another country that experienced very high recipiency rates. The experience of these two countries – summarized below – demonstrates the unintended consequences that a well- meaning cash benefits program can create.
5.15 Benefit levels do have an impact, just not on outflow rates. Higher levels of benefits seem to attract more applicants to disability programs. Not surprisingly, the
14
International Social Security Association Research Program, “Who Returns to Work and Why: Evidence and policy implications from a new disability and work reintegration study,” 2002
15
Only a 15 percent earnings-capacity reduction is required to qualify for benefits in Netherlands (25 percent for self-employed and disabled youth). Germany and Sweden also have a low threshold – 25 percent. Other countries have higher thresholds, for example: Norway and Mexico (50 percent), France and Turkey (67 percent), and the United States at almost 100 percent.
larger benefits are relative to potential earnings, the more attractive the program, which is often offered as an explanation for the dramatic differences across countries in the
percentage of workers receiving disability benefits. 16
The Netherlands.
5.16 In the 1980s, The Netherlands sickness and disability programs provided easy access to benefits and a very high rate of compensation. Cash payments under the
sickness benefits program had no waiting period. They lasted up to one-year, required no medical certification, and were linked to previous wages. In the early 1980s the
maximum benefit was 80 percent of previous wages, but collective bargaining
agreements often supplemented them to 100 percent. After one year, beneficiaries could apply for long-term disability benefits, which coincidentally had a one-year waiting period.
5.17 This situation lead to a fairly high recipiency rate. So during this time, the government acted to reduce cash benefits. As early as 1980 the government introduced social insurance taxes on benefit income. In 1984, benefits were explicitly reduced and in 1985 the maximum replacement rate was lowered to 70 percent of previous wages. 5.18 When unemployment levels rose dramatically during the 1980s, the government decided to shift more people to disability programs than to the unemployment program. This not only suppressed the unemployment rate but offered more long-term assistance to laid-off workers since disability benefits, unlike unemployment benefits, were not time limited. As a result, program enrollment grew dramatically. Out of a labor force of less than seven million, over 900,000 received disability benefits in 1999. 17
5.19 The Netherlands recently acted to reverse this situation. Employers were made responsible for at least 70 percent of the wages of sick employees, as opposed to the government paying the full amount. Employers were also required to launch safety and health programs.
5.20 Changes were also made in the long-term disability program. A system of subsidies and fines was established for hiring and not firing disabled workers. The fine, though, was extremely unpopular and was soon repealed.
5.21 The benefit entitlement was changed from being based on whether a people were capable of work that was “suitable” to their experience and skills, to “generally accepted” work. Benefits were thus no longer determined by earning capacity lost, but earning
16
Bound and Burkhauser, “Economic Analysis of Transfer Programs Targeted on People with Disabilities,” Chapter 51 in Handbook of Labor Economics, Volume3, Edited by Ashenfelter and Card,
1999 17
Zeitzer, “The Challenges of Disability Pension Policy: Three Western European Case Studies of the Battle against the Numbers,” Chapter in Reforming Worker Protections: Disability Pensions in Transformation, Fultz and Ruck, eds., ILO, 2003
capacity remaining. Furthermore, every claimant under the age of 50 years old had to be re-assessed based on this new standard of work disability. Thus, benefit amounts were lowered for many recipients. Some had their benefits terminated, and thus had to rely on time- limited unemployment benefits.
5.22 At first, these policies stopped the rise in the number of beneficiaries, and even lead to some outflow from the program. Nevertheless, the still high number of
beneficiaries resumed rising in the mid to late nineties. As a result, the Netherlands passed a law in 1998 making employer contributions to the disability program a function of the number of past employees who claimed benefits. The idea was that the financial incentive created would get employers to improve the health and safety of their
workplace and make accommodations for disabled workers. The problem, though, is that it also affected the hiring process by offering an incentive for employers to screen out workers they perceived as being likely to receive benefits in the future.
Poland.
5.23 After the fall of the communist government and the transition to a market-based economy, the pressure to lay-off workers began to grow in Poland. Rather than increase unemployment rolls, people were funneled into the disability pension system.
5.24 The ease of being legally defined as disabled led many employed people with minor disabilities to apply for a disability certificate if they believed their jobs were in jeopardy. Disability was defined based on a medical characterization. That is, eligibility was not based on a demonstrated incapacity to work stemming from an impairment, but followed directly from that impairment. Furthermore, no precise regulations were established, leading many determinations to be made from the standpoint of sympathy, without an eye towards promoting inclusion in the workforce.18
5.25 Some evidence suggests that a market for fraudulent disability certificates also developed.19 These influences may have been behind the rise in the percentage of adults defined as disabled from 11.3 percent in 1988 to 14.3 percent in 1996.
5.26 By 1995 the cost of the disability insurance in Poland was 4.3 percent of GDP and the ratio of beneficiaries to labor participants ranked among the highest in Europe.20 About 5.5 percent of the population received disability.
5.27 The rising numbers of people receiving benefits lead to reforms in 1995 and 1997. First of all, eligibility for the program was tightened to only include people with a
18
Fultz, E., “A Comparative Overview of Disability Pension Reforms in the Czech Republic, Estonia, and Poland,” a chapter in Fultz, E. and M. Ruck, Eds. Reforming Worker Protections: Disability Pensions in Transformation, ILO, 2003
19
Hoopengardner, T. “Disability and Work in Poland”, SP Discussion Paper No. 0101, The World Bank, January 2001, p.vi
20
Hoopengardner, T. “Disability and Work in Poland”, SP Discussion Paper No. 0101, The World Bank, January 2001
demonstrated loss in functional capacity that precludes work. This change in eligibility standards was coupled with increased training and supervision of doctors making disability determinations. These doctors were hired and trained by the government in an effort to preclude the perceived practice of buying one’s way on to the program.
5.28 A second reform was to directly tie benefits to previous wages. In addit ion, payments were indexed to the overall price level instead of to average wages. Since real wages are projected to increase, this change in indexing lessens the value of benefits. Thirdly, termination requirements were eased for certain temporary pensions. And finally, a new training pension was established that pays higher benefits, but can only be received for a limited period of time.
5.29 Of course, any tightening in eligibility not only weeds out people who should not be on the program, but will also increase the number of errors that exclude people who should receive benefits. Furthermore, reductions in benefits from changing the indexing procedure lowers the standard of living for people who are not capable of working. Clearly, any policy that attempts to rein in disability programs that are viewed as expensive and anti-work also need to incorporate planks that make work a realistically attainable option for disabled persons.
5.30 The situation in Poland, though, seemed to require tightening, and reforms are working. Disability pension expenditures as a percentage of GDP have begun to fall. From 1995 to 2000, that percentage dropped from 4.3 percent to 3.8 percent. Newly awarded pensions in 1990 numbered 241,400. By 1996 that number fell to 151,600 and continued falling until 2000 when they numbered 102,400.21
5.31 Quotas. A quota is an obligation to employ a set number or percentage of persons of a particular group. Disability quotas are a regulatory approach for promoting the employment of people with disabilities by directly influencing labor demand. The implicit assumption is that without quotas employers are turning away disabled workers, either because of discrimination, a perception that they are not as productive as disabled workers, or the unwillingness to bear the costs needed to accommodate disabled workers so they could be equally productive.
5.32 Quotas can be voluntary, and thus a moral obligation, or as is usually the case, they can be a legal requirement. Over one-third of OECD countries have some type of quota, ranging from 2 percent in Spain and Korea to 6 percent in France and Poland, and even 7 percent in Italy. Failure to comply with the quota sometimes results in a fine.22 5.33 Quota are often adjusted according to the employer’s size or type of industry. For example, although Spain and Korea have similar percentage quotas, they have very
21
Fultz, E., “A Comparative Overview of Disability Pension Reforms in the Czech Republic, Estonia, and Poland,” a chapter in Fultz, E. and M. Ruck, Eds. Reforming Worker Protections: Disability Pensions in Transformation, ILO, 2003
22
different size exemptions. Korean employers with fewer than 300 employees are not covered by the quota, while in Spain the cut-off is 50 employees.
5.34 A variant of quota policies is the quota-levy system. This system allows
employers to opt out of hiring disabled persons by contributing money to a special fund. The basic idea is that all employers have a responsibility to create employment for disabled workers, either through direct employment provision, or failing that, to the special fund. These funds usually disperse resources to disabled workers, service providers, and employers. Payments to employers are intended as compensation for additional costs associated with hiring people with disabilities. Countries where quota-levy systems are operative include Austria, Czech Republic, Germany, Hungary, Japan, Poland, Romania, the Russian Federation and the Slovak Republic.
5.35 Quotas, however, often go unfilled. In fact, in most OECD countries the average quota fulfillment tends to run from 50 to 70 percent. Quota- levy arrangements in Africa and Asia are usually not even enforced. These include Azerbaidjan, Morocco, Pakistan, Thailand, Tunisia and Viet Nam.23
5.36 Quotas serve the positive purpose of raising awareness of workers with disabilities, and generating some employment opportunities. Also, when fines are collected and distributed to programs for disabled people they can provide some needed resources. However, sometimes fines are not enforced. And of course many small employers are not covered by quota systems. Finally, quotas can easily turn into caps on the employment of disabled persons, and allow employers meeting quotas of, say, 2 percent to feel they have done all that is necessary.
5.37 Without a system of supports for creating appropriate work environments, quotas have a limited effect. That may be one reason desire is growing in Europe for an
approach based on anti-discrimination legislation.
France.
5.38 In 1987, France enacted a law establishing an employment quota for disabled persons and allowing employers to meet that quota in a variety of ways. According to the law, all companies with 20 or more employees must have 6 percent of their personnel be disabled workers. This obligation can be achieved in a variety of ways:
-directly employing disabled workers
-sub-contracting with a sheltered work establishment
-implementing a program for the employment of disabled workers
5.39 If employers do not meet the obligations of the quota system through these three mechanisms, they can do so by contributing to a fund for the vocational integration of
23
Thornton, P., “Employment Quotas, Levies, and National Rehabilitation Funds for Persons with Disabilities: Pointers for policy and practice,” ILO, Geneva, 1998
disabled persons. This annual contribution ranges from 300 to 500 times the hourly minimum wage per job not filled, depending on the size of the establishment.
5.40 Money from the fund can be used to subsidize the extra cost of training activities for disabled workers, developing or implementing workplace adaptations, or for
vocational rehabilitation. 24
5.41 Results from this program are mixed. Approximately half of the establishments covered by the legislation have not met the quota, and the rate of employment of people with disabilities has risen only slightly, from 3.76 percent in 1991 to 4.05 percent in 1995. On the other hand, the fund financed by the quota legislation has grown,
distributing 398 million euros in 2002. Thirty- five percent went to employers, 17 percent went to disabled persons for direct services, and 48 percent went to service providers who were to facilitate the placement and accommodation of disabled workers.
China.
5.42 China established a quota- levy system in the early 1990s. At that time disabled persons constituted less than one percent of the total number of employees in the general workforce and the sheltered workshop system was in crisis (the desirability of sheltered workshops will be analyzed in a later section of this paper). The quota in China is not set at a national level, but separately by province. The law states that quotas are to be “in line with [a province’s] actual conditions.”25
5.43 If employers do not meet the relevant quota, they must contribute money to an “employment security fund” that is devoted to secur ing the employment of people with disabilities. The contribution is equal to the gap between the quota and the number of employees with disabilities multiplied by the annual average wage for the city where the employer is located. The funds are used to pay for vocational training, wage subsidies to employers, and to offset additional costs of hiring disabled persons. Money can also be awarded to employers who exceed the quota.
Japan
5.44 Since 1998, enterprises with more than 56 employees have been subject to a quota of 1.8 percent.26 Employers who are not in compliance are subject to a levy of 50,000
24
Thornton, P., “Employment Quotas, Levies, and National Rehabilitation Funds for Persons with Disabilities: Pointers for policy and practice,” ILO, Geneva, 1998, pp. 8-16
25
Thornton, P., “Employment Quotas, Levies, and National Rehabilitation Funds for Persons with Disabilities: Pointers for policy and practice,” ILO, Geneva, 1998, pp. 43-44
26
Japan Association of Employment of Persons with Disabilities, “Employment Promotion Services Under the Levy and Grant System for Employing Disabled Persons,” www.jaed.or.jp/english/levy.html
yen for each person- month below their quota. Employers who exceed the quota, are paid 25,000 yen per person- month for the number of disabled workers in excess of the quota.27 5.45 In addition to the previously mentioned awards, collected levies are used to fund a variety of grants. These grants are aimed at promoting the hiring and retention of
disabled workers. Grants can fund workplace accommodations and facilities for
employers and personal assistants, commuting costs, and training for disabled workers. 5.46 The total amount of levies collected in fiscal year 2002 was 24,652 million yen. Over 57 percent of firms did not meet their quota during that time.
Anti-Discrimination Laws.
5.47 Anti-discrimination laws make it illegal to base employment decisions on a person’s disability. In addition, such laws can include requirements for employers to make all reasonable accommodations necessary for a disabled worker to fully perform his or her duties. This legislation began with the United States Americans with Disability Act (ADA) and was soon followed by similar acts in the Canada, the United Kingdom, and Australia. More recently, other countries have moved in this direction, although they have opted to incorporate language prohibiting discrimination against people with
disabilities into more general legislation (e.g., Sweden, Norway, and Germany). 5.48 Like quotas, this approach operates on the demand side of the labor market. Productivity differences between disabled and non-disabled workers are seen as the result of a lack of accommodations. Designing and implementing accommodations are
generally the employers responsibility – obviously in cooperation with employees. Paying for these accommodations is sometimes offset by the use of tax credits or subsidies. For example, in Australia grants of up to $5000 are available for making workplace modifications.28 The effectiveness of these programs, however, has generally not been evaluated.29
5.49 In addition to modifications geared towards making accessible work stations, accommodations can also include the re-design of job characteristics. For example, after a back-injury a person may be able to only perform a subset of his or her prior
27
Presently, however, employers with fewer than 300 workers are exempt from the levy and only receive 17,000 yen per person-month in excess of their quota.
28 Thornton, P. and N. Lunt, “Employment Policies for Disabled People in Eighteen Countries: A Review” Social Policy Research Unit, University of New York, ILO, 1997
29
United States General Accounting Office, Business Tax Incentives: Incentives to Employ
Workers with Disabilities Receive Limited Use and Have an Uncertain Impact, GAO-03-39 December 2002
responsibilities. The job could be re-structured to take away certain tasks and add other, more back- friendly tasks. The notion of accommodations and structuring work with disabled persons in mind will be addressed more fully in the Supported Employment section of this paper.
The United States.
5.50 The Americans with Disabilities Act (ADA) of 1990 intended to promote the hiring and retention of disabled workers by providing them with certain rights. The ADA, which took effect in 1992, has two major components.
• Employers are prohibited from discriminating against people with disabilities in regards to compensation, hiring, firing or promotion; and,
• Employers are required to provide reasonable accommodations, which include things such as accessible work stations, job restructuring, and special equipment or assistive devices.
5.51 According to the ADA, a worker is disabled if an individual has “a physical or mental impairment that substantially limits one or more of the major life activities” or if that individual has a record of such an impairment, or is even regarded as having such an impairment.
5.52 If a worker believes he or she has been discriminated against in violation of the ADA, then that worker can pursue civil remedies through judicial proceedings.
5.53 The overall effect of the ADA is difficult to measure. The impact hinges on the definition of disability that is used in the empirical research. 30 Among people with functional limitations who identify themselves as being able to work, it appears that the ADA has increased employment. Among those reporting themselves as not able to work because of a disability, the effect is not as positive. Some argue, though, that the latter definition does not cover the target group of the legislation. Others say that if the ADA were effective, people’s disabilities would not be hindering their employment. One conclusion many researchers agree upon, though, is that whatever the influence of the ADA it is probably most effective at preventing job terminations resulting from the onset of a disability.
Vocational Rehabilitation and Training
5.54 Unlike quotas and anti-discrimination laws, vocational rehabilitation and training programs operate on the supply side of the labor market by trying to increase the
productivity of disabled persons. Or, in the language of the policy typology outlined earlier in this paper, it is a counterbalancing approach.
30
5.55 According to the ILO, vocational rehabilitation is defined as “…the continued and coordinated process of rehabilitation which involves the provision of those vocational services, e.g. vocational guidance, vocational training, and selective placement, designed to enable a disabled person to secure and retain suitable employment…”31 This process can involve many things, including: assessments of work capacity and aptitude,
vocational counseling, short and long-term training, job placement services, and career counseling. Training sometimes takes place in a classroom setting, but can also include on-the-job training.
5.56 The idea behind these programs is to both restore and develop the capabilities of people with disabilities so they can participate in the general workforce. While vocational rehabilitation and training services are similar in many OECD countries, the nature of the programs that govern who gets those services and when can be quite different.
5.57 In certain countries, vocational rehabilitation programs are considered a right. In France, Germany and Poland, all disabled persons, regardless of their eligibility for cash benefits, are provided with services. In other countries, such as Austria, this right is limited to people qualifying for benefits. However, in the United States vocational rehabilitation services are even more restricted. Being disabled only qualifies someone to apply for services, which are generally targeted to more severely disabled people without significant work experience.
5.58 Many countries make vocational rehabilitation mandatory. Once people apply for benefits they are required to seek services prior to being eligible for cash payments. These systems promote early intervention, the idea being to assist someone immediately at the onset of a disability and maybe even prevent their withdrawal from the labor market.
5.59 Countries that do not have mandatory programs – such as, Canada, Mexico, Portugal, and the United States – tend to provide vocational rehabilitation after a long-term illness, once it is clear a disabled person is not going to be successfully employed on their own.
5.60 Prolonging the entry into vocational rehabilitation doesn’t necessarily imply fewer people receive the benefit. Germany and the United States, which have very different approaches, both have about half as many people receiving vocational rehabilitation as the number of new benefit recipients.
5.61 Is vocational rehabilitation cost-effective? For each person receiving services who finds stable employment who would not have otherwise, the reduction in cash benefits almost certainly exceed the cost of the services. However, undertaking a full-scale benefit-cost analysis is difficult.32 One confounding influence is that vocational
rehabilitation providers may pre-select people they think will be successful. These people
31
ILO, “Vocational Rehabilitation and the Employment of Disabled Persons,” Geneva, 1998 32
would be more successful than non-participants even without a program. Not accounting for this process, known as “creaming”, would overestimate the impact of the program. Similarly, even if vocational rehabilitation services are offered to everyone, people may self-select based on their ability and willingness to work. On the other hand, some people with less severe disabilities find employment without vocational rehabilitation. Ignoring this would underestimate the effect of vocational rehabilitation programs. Uncovering the net effect of vocational rehabilitation programs requires studies using high quality data on the nature of people’s impairments and other socio-economic characteristics, including work history. It also involves setting up adequate control or comparison groups to control for possible selection bias. Finally, to truly measure the impact of such services, longitudinal data that follows people over time is also essential. Unfortunately, such studies are rare and usually inconclusive.33
Germany.
5.62 In Germany, all disabled people have a right to assistance “necessary in order to avert, eliminate, or ease the disability, prevent its aggravation or to reduce its effects and to secure a place in the community, in particular in working life…”34
5.63 Before the Growth and Employment Act was passed in 1997, all people with disabilities had a legal claim to vocational rehabilitation services. That law mandated that new claims be determined on a case-by case basis. That determination, however, is made early. Unlike in most countries (other than Sweden) there is no waiting period or need to demonstrate difficulty in securing employment.
5.64 Assistance is granted regardless of the cause or degree of disability, and is obtained upon referral from the disability pension program, local employment agencies, or the health insurance system. The health insurance system, however, must assess the necessity for vocational rehabilitation before, during and after medical rehabilitation. Physicians must abide by published guidelines in prescribing treatment and making vocational rehabilitation referrals.
5.65 Vocational rehabilitation services include job accommodations, assistive devices, technical aids, transportation allowances, and part-time work coupled with partial
benefits that ease the transition to work. This last strategy is also used in a number of European countries. 35 Data are suggestive that the costs of vocational rehabilitation pays off in the medium term if recipients who would not otherwise secure employment get re-integrated into the workforce.36
33
OECD, “Transforming Ability into Disability,” 2003, p.112 34
Thornton, P. and N. Lunt, “ Employment Policies for Disabled People in Eighteen Countries: A Review” Social Policy Research Unit, University of New York, ILO, 1997, p. 114
35
Sim, J., “Improving Return-to-Work Strategies in the United States Disability Programs, with Analysis of Program Practices in Germany and Sweden,” Social Security Bulletin, Vol. 59, No.3, 1999
36
Supported Employment.
5.66 Supported employment programs are designed to help integrate people with disabilities directly into the workplace. They consist of ongoing support services that enable a disabled persons to learn and perform their jobs. Usually the support is for a limited period of time, but some countries offer long-term supported employment for workers who are more severely disabled, including Australia, Norway, the United Kingdom, and the United States. Denmark actually has no time limit in its supported employment program, and Germany has recently established a right to supported employment for a period of up to three years. On the other hand, a number of OECD countries have no supported employment program, including Poland, Portugal, Spain, and Switzerland.
5.67 Job coaches are a common feature of supported employment programs. These coaches offer individualized assistance to enable people with disabilities learn at an appropriate pace. They provide on-site training not only on job performance but on adjusting to the work environment, and also serve as a link between the individual and the employer in determining what workplace accommodations are needed.
5.68 Sometimes job coaches work with small groups of disabled people. This enclave model takes two forms. A dispersed enclave trains together at an integrated worksite and then the individuals in that group are dispersed througho ut the organization. At other times, the disabled workers form a single work group that operates within the
organization.
5.69 Other services falling under the category of supported employment include transportation services, assistive devices, specialized job training, and individually tailored supervision. All of these services are designed to work with the disabled individual to improve his or her productivity on the job, with the goal of complete integration. One concern of employers is the gap in productivity for some workers. To offset this concern, some countries also have wage subsidy policies and other financial incentives.
Wage Subsidies and Other Employer Incentives.
5.70 Wage subsidies and other employer incentives aim to boost the demand for disabled workers. People with disabilities may either be perceived as being less
productive, or have costs that inhibit their being hired. Examples being additional training time and other accommodations. By effectively decreasing the wages paid by employers without decreasing the income received by the disabled workers, these policies can even the playing field in the job market while still allowing workers to secure their livelihood. 5.71 Subsidies are usually phased out over a period of years, but can be quite high. Norway and Austria, for example, provide a full wage subsidy. A few countries provide