How to successfully quantify readiness for change
Kristina Linnea Matsdotter Fagernæs
Master’s thesis in work- and organizational psychology
Department of Psychology
UNIVERSITY OF OSLO
May 2015
Norwegian Police University College (NPUC) as part of a larger, ongoing research project conducted in cooperation with the Department of Psychology at the University of Oslo.
I want to thank my supervisor Cato Bjørkli at the University of Oslo, for his advice, helpful guidance and constructive criticism. I also want to thank Alexander Garnås for assistance with the methodological questions that arose during this
process. I would also like to thank Police Inspector Trond Myklebust and the research department at The Norwegian Police University College, for letting me participate in this exciting research project. This past year has been very interesting and
educational, and has contributed to a richer view of the police organization. Last, but not least, I owe a big thanks to my family and friends for endless support and necessary distractions along the way. Especially, I want to thank my mom for inputs, and Erlend Løken for support and encouragement.
Oslo, May, 2015
Abstract
The purpose of this thesis is to clarify central aspects of change readiness, focusing on how to successfully quantify this attitude. This was done by investigating three
hypotheses: quantitative versus qualitative method; relationship between individual and organizational change readiness and relationship between positive and negative change readiness.
Research on change readiness is hindered by the absence of a reliable and valid measure on both individual and organizational level. Hence, the Organizational Climate Measurement (OCM) survey was used in this thesis to measure change readiness. The Open system quadrant in the Competing Values Framework (CVF) was operationalized as positive change readiness while Internal process quadrant was operationalized as negative change readiness. In addition to the survey, qualitative interviews were used on the same sample. The results indicate that the interviews and surveys detected different amounts of change readiness. It is therefore not indifferent which method is chosen to examine change readiness.
The relationship between individual and organizational change readiness were not surprisingly found to be different from each other. It is therefore important to separately measure change readiness at both levels. Results also indicate that change readiness at an individual level can be both positive and negative at the same time. It is therefore important to measure both positive and negative change readiness, not just overall change readiness. Finally, a number of suggestions for future research are identified, focusing on the conceptual and methodological issues that need to be addressed.
Keywords: change readiness, multilevel framework, Competing Value
Table of contents
Change Readiness ... 1
Measuring Change Readiness ... 5
OCM: Organizational Climate Measure ... 7
Measuring Change Readiness using OCM ... 10
The Present Study ... 11
Method ... 13
Qualitative Interview Data ... 13
Quantitative Survey Data ... 16
Combined Data ... 17 Ethical considerations ... 18 Results ... 18 Descriptive Statistics ... 18 Inferential Statistics ... 22 Discussion ... 23
Implications for Theory and Practice ... 25
Limitations ... 31
Directions for Further Research ... 32
Conclusion ... 33
References ... 35
Appendix A – Letter of information ... 41
The accelerating rate of change, driven by science and new technologies, has profound effects on the world economies, social structures and cultures. The rapid speed at which new innovations and faster communications are implemented, leads to faster changing environmental conditions. This results in an increasing pressure on organizations to adapt and successful changes are necessary for survival, (Holt & Vardaman, 2013). However, successful organizational change efforts have proven difficult and many studies report a high failure rate of 70% or more (e.g. Brodbeck, 2002; Burnes & Jackson, 2011; Burns, 2005). Since change is unavoidable and there is a high probability of failure, extensive research on organizational change has been undertaken. Not surprisingly, motivation for change is a key factor for a successful change process and in particular, the importance of readiness for organizational change is crucial (Rafferty & Simons, 2006).
Change initiatives are both time consuming and costly. It is therefore important to resolve how change is successfully adapted and sustained. In order to increase the probability of a profitable outcome, Rafferty, Jimmieson, and Armenakis (2013) argue that it is necessary to consider and measure change readiness prior to large-scale change implementation. This is supported by Armenakis, Harris, and Mossholder (1993) who argue that change readiness should be assessed in order to identify gaps in employees’ change readiness, and thereby reducing resistance to change and other obstacles to successful conversion. However, there is a lack of research on reliable and valid measurements of change readiness.
The idea of change readiness appears to be a fairly intuitive and appealing construct, namely that individuals are more likely to participate in and support change that they are ready for. However change readiness is also a complex concept,
appearing to have multiple dimensions and operating at different organizational levels. Despite the fact that change readiness is identified as a key element in
successful organizational change (Burke, Clark, & Koopman, 1984), few studies have been conducted on the multifaceted nature of change readiness (Stevens, 2013; Szabla, 2007). Based on this, the purpose of this thesis is to clarify central aspects of change readiness, focusing on how to successfully quantify readiness for change.
Change Readiness
A key objective in the field of organizational change is the identification of endorsing or facilitating factors (e.g. Lewin, 1952; Rafferty & Simons, 2006). Early theorist such as Kurt Lewin modeled change as a three-stage process, consisting of
the stages unfreezing, changing, and refreezing (Lewin, 1947). The approach to organizational change developed over the years, evolving from planned approach in the 1950s to 1980s originated by Lewin, to emergent approach, surfacing in the early 1980s (Burns, 2005). Today the concept of organizational change is regarded more complex (Burnes & Jackson, 2011) with an increasing focus on the drivers of successful change (Rafferty & Simons, 2006). A number of researchers identify change readiness as a prevalent factor involved in employees’ initial support for change initiatives (e.g. Holt, Armenakis, Feild, & Harris, 2007a).
Armenakis et al. (1993) identify readiness for organizational change as being similar to Lewin´s concept of unfreezing, and emphasize the importance of creating readiness as a precursor to organizational change. Armenakis et al. (1993) also
propose the most accepted definition of change readiness and define change readiness as “beliefs, attitudes, and intentions regarding the extent to which changes are needed and the organization’s capacity to successfully undertake those changes” (p. 681).
Armenakis et al. (1993) identified two beliefs as key components of change readiness: the belief that change is needed and the belief that the individual and the organization have the capacity to undertake change. This is supported by Holt and Vardaman (2013) who argue that change readiness includes individual factors that reflect the extent to which individuals hold key beliefs regarding the change, and recognize that a problem needs to be addressed. Vakola (2013) takes this further and argues that individuals must be willing to support the change and perceives their work group or social environment as supportive of the change initiative.
Even though the definition by Armenakis et al. (1993) is the most used in change readiness literature, there is a discrepancy in the literature on how it ought to be defined and conceptualized (Stevens, 2013). The concept of change readiness has been understood throughout research in different ways, conceptualized as an attitude (e.g. Bouckenooghe, 2010; Rafferty et al., 2013; Rafferty & Simons, 2006),
multifaceted concept (e.g. Bouckenooghe, Devos, & Van den Broeck, 2009; Holt, Armenakis, Feild, & Harris, 2007b; Holt & Vardaman, 2013), a stage of preparedness for change (e.g. Ingersoll, Kirsch, Merk, & Lightfoot, 2000) a commitment to change (e.g. Fedor, Caldwell, & Herold, 2006), or a process (e.g. Stevens, 2013) to mention some. As a consequence, the literature on the readiness for change lacks conceptual clarity, which creates confusion about the concept of change readiness (Vakola, 2014).
There is a strong overlap between the definition of an attitude and the content of change readiness (Bouckenooghe, 2010). Rafferty et al. (2013)goes even further andargue that change readiness is either a positive or negative attitude towards change. This is in line with the traditional idea that attitudes are either positive or negative. However, research has shown that positive and negative attitudes co-exist (e.g. Cacioppo, Gardner, & Berntson, 1997; de Liver, van der Pligt, & Wigboldus, 2007). Despite conceptualizing change readiness as an attitude, there has been little or no research on the co-existence of positive and negative change readiness.
Despite the growing number of studies on organizational change, it is unclear how the various attitude-related constructs overlap or differ. Some works have, however, tried to differentiate between resistance to change and change readiness. Among these are Armenakis et al. (1993) who underline that creating readiness for change has most often been explained in conjunction with reducing resistance to change. Also Ford and Foster-Fishman (2012) points out that change readiness may act to reduce the likelihood of resistance to change, hence increasing the potential for change efforts to be more successful.
Piderit (2000) draws on attitude theory and argues that it is essential to consider change attitudes as a tridimensional construct with both the cognitive, affective and intentional aspects when defining and measuring it. Bouckenooghe (2010) argue that these three components are also reflected in the beginning of the definition by Armenakis et al. (1993). This concerns the explicit reaction to what change recipients think (cognition), how they feel (affect), or what they intend to do (intention) in response to the change (Oreg, Vakola, & Armenakis, 2011). This is supported by Rafferty et al. (2013) who argue that it is essential to consider both the affective and cognitive aspects of change readiness when defining and measuring this attitude. There are different number of dimensions in the model by Rafferty et al. (2013) and the conceptualization by Piderit (2000). This illustrates that there is no consensus in the literature concerning the number of dimensions change readiness consists of.
There is a general consensus that organizational change is a multilevel phenomena (e.g. Bouckenooghe, 2010; Kozlowski & Klein, 2000). However, when studying a part of organizational change, namely readiness for change, few
researchers have adopted a multilevel perspective (Bouckenooghe, 2010). Rafferty et al. (2013) argue that it is essential to understand the implications of change readiness
on both the individual and organizational levels.
Change readiness has predominantly been studied and conceptualized on an individual level (Vakola, 2014). Researchers often base their statements on
organizational change readiness on results from the individual level. This is
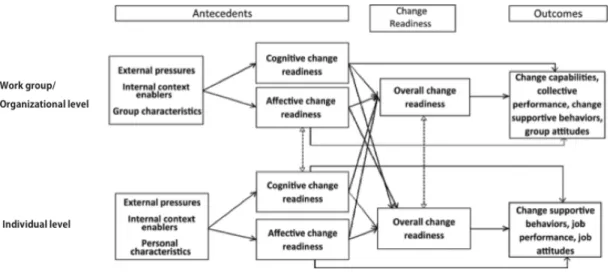
questionable since relationships that hold at one level of analysis may be stronger or weaker at a different level of analysis, and may even reverse. Rafferty et al. (2013) found that the processes that contribute to change readiness differ at the individual, group and organizational level. They found that there are different antecedents for the individual and organizational level. As illustrated in figure 1, they theorize that important antecedents for change readiness are external pressures, internal context enablers and personal or group characteristics. They developed a multilevel
framework that identifies the antecedents and consequences of change readiness at these levels of analysis (Figure 1).
Figure 1. Multilevel framework of the antecedents and consequences of readiness for change. Heavy dashed lines represent the process through which lover level
phenomena are compiled to result in higher-level phenomena. Lightly dashed lines represent potential cross-level relationships. After “Change Readiness: A Multilevel Review,” by A. E. Rafferty, N. L. Jimmieson and A. A. Armenakis, 2013, Journal of Management,39, p. 113.
Some recent conceptualizations have acknowledged the importance of considering individual and collective levels of analysis separately (e.g. Holt & Vardaman, 2013; Stevens, 2013; Wheland-Barry, Gordon, & Hinings, 2003).
However, this is difficult since change readiness lacks conceptual clarity. Change readiness has been conceptualized as an attitude, a process, and a stage of change to name a few. In addition, there has been little or no research on the co-existence of positive and negative change readiness. Consequently, it remains unclear how to measure positive and negative change readiness. In addition, it remains unclear how the levels of analysis may interact with each other, as well as what the appropriate measurement should be.
Measuring Change Readiness
Holt et al. (2007b) found, after extensive research, that existing measurements of change readiness lack evidence of validity and reliability. In addition, most
measurements on change readiness have not differentiated between individual and organizational change readiness (Vakola, 2014). Vakola (2014) also argue that there was no relevant instrument that measure individual readiness to change as one factor. However, in response to this lack of instrument in the field, both Holt et al. (2007a) and Vakola (2014) have developed questionnaires on individual change readiness.
As previously mentioned, change readiness has been conceptualized and defined in different ways, and the following questionnaires are two examples. Vakola (2014) uses a conceptualization of change readiness as an attitude based on the definition by Armenakis et al. (1993). Whereas Holt et al. (2007a) define change readiness as a multidimensional construct that is simultaneously influenced by different factors. This shows the importance of studying this concept further and clarify the definition as well as how to measure it.
Holt et al. (2007a) define change readiness as comprehensive attitude that is influenced simultaneously by the content (what is being changed), the process (how the change is being implemented), the individuals (attributes of those being asked to change), and the context (attributes of the environment that the change is occurring in). This definition differs from previous research and conceptualization of change readiness. Holt et al. (2007a) states that their scale is in the initial stage and that the scale and its conceptualization needs more research. In addition, the scale was only tested in two organizations, both responsible for information technology and both undergoing structural changes. This can limit the scale’s generalizability.
Furthermore, the theorized factor structure did not emerge. Based on this, Holt et al. (2007a) argue that there is a need for further refinement of the scale.
readiness based on the well-established definition by Armenakis et al. (1993). The item pool in Vakola’s (2014) scale was based on literature on change readiness and instruments that measure similar concepts, such as empowerment readiness survey. The six items were chosen by five experienced human resource officers and directors. This questionnaire is also in the preliminary stages. In addition, it is not validated in another sample than in a technological company in Greece.
Both of these two questionnaires measure change readiness at the individual level and both are in their preliminary stages. Consequently, more research is needed on both questionnaires, covering different types of organizations. As pointed out earlier, there is a general, lack of validated and reliable instruments that measure change readiness at the individual level.
Weiner, Amick, and Lee (2008) examined instruments of change readiness at the organizational level. They found that a majority did not assess face- or content validity, thereby not assessing the extent to which the items in the instrument fully represent the theoretical content. They found only seven instruments that had undergone a systematic assessment of reliability and validity. Of these, only one measured overall change readiness at an organizational level. This measurement, by Lehman, Greener, and Simpson (2002), consists of 118 items divided on four dimensions, which in turn consists of 18 sub-scales. Recent studies showed that this scale had variable levels of reliability, concurrent validity and predictive validity (Weiner et al., 2008). Consequently, Weiner et al. (2008) encourage development of a reliable and valid instrument that measure change readiness at the organizational level.
Armenakis et al. (1993) argue that change readiness can be assessed through different methods such as questionnaire, interview and observation. However, most research on change readiness has been with questionnaires. The results of close-ended questionnaires might not capture or reflect the respondent’s actual experience.
Accordingly, Rafferty et al. (2013) argue that there is a need to examine change readiness using different methodologies. Piderit (2000) elaborates on this and mention the need for qualitative interview research when studying change. When using
qualitative open-ended interviews the interviewee is free to use his or her own words and categories. The results could more likely reflect the person’s actual experience of his or her environment. Furthermore, interview can play a role in discovering
can therefore enhance our understanding of change readiness.
Jick (1979) argues that multiple and independent measures provide more certain information about a construct. Accordingly, triangulation can be used to enhance the knowledge of a concept. Triangulation is defined by Denzin (1978) as “the combination of methodologies in the study of the same phenomenon.” (p. 291). A purpose of triangulation is to increase the comprehensiveness of a study, and thus to provide a more complete understanding of the phenomena (Jonsen & Jehn, 2009). Triangulation can therefore be a good method to increase the conceptual clarity of change readiness and increase the knowledge about how the different organizational levels relate to each other.
There is a lack of research on change readiness that uses triangulation. In addition there is a lack of research with qualitative methods. Using both qualitative interviews and quantitative surveys to explore the construct change readiness can increase the conceptual clarity. However, there is a lack of reliable and validated questionnaires on change readiness both on the individual and organizational level. A solution could be to use a validated and reliable general measurement on
organizational climate, like the Organizational Climate Measure (OCM). Patterson et al. (2005) argues that the OCM can be used to study organizational change, and specifically focus on employees’ experience of change. In addition, it would be interesting to use the OCM to improve the understanding of change readiness since organizational climate is related to change readiness (Cunha & Cooper, 2002). In addition, exploring change readiness with an alternative measurement, like the OCM, can give much needed clarity to the concept of change readiness.
OCM: Organizational Climate Measure
The OCM is a global multidimensional measure of organizational climate. The OCM has acceptable reliability and is tested for concurrent validity as well as
predictive validity (Patterson et al., 2005). The OCM also has discriminant validity, meaning that it can be used to discriminate between organizations. It also has consensual validity, indicating that employees within the same organization tend to assess the work environment in a similar fashion. The OCM has been tested in different countries; among them the UK (Patterson et al., 2005) and Norway (Bernstrøm, 2009).
The OCM consists of 82 items that assess 17 dimensions (see appendix B for the list of the OCM questions and dimensions). The OCM uses the Competing Values
Framework (CVF) as a basis for selecting climate dimensions. This gives the OCM a robust theoretical foundation. The CVF by Quinn and colleagues has been named as one of the 40 most important frameworks in the history of business (Cameron, Quinn, Degraff, & Thakor, 2006). It was developed as a response to the need for a broadly applicable framework that could foster successful leadership, improve organizational effectiveness, and promote value creation. It has been studied in organizations for more than 30 years, and has received empirical support from several different studies (Cameron et al., 2006; Patterson et al., 2005). The CVF captures the fundamental values and culture that exists in an organization.
Quinn and colleagues proposed that organizational effectiveness criteria could best be understood when organized along fundamental dimensions - external versus internal focus and flexibility versus control. This leads to four different quadrants, see figure 2.
Flexibility
Human relations Open system
Internal focus External focus
Internal process
Rational goal Control
Figure 2. The Competing Values Framework (CVF). After “A Spatial Model of
Effectiveness Criteria: Towards a Competing Values Approach to Organizational Analysis” by R. E. Quinn & J. Rohrbaugh, 1983, Management Science, 29, p. 369.
The Human relations quadrant is defined by human commitment, decentralization and maintenance of the socio-technical system. It has values associated with belonging, trust and cohesion, achieved through means such as training and human resource development. The Human relations quadrant reflects the tradition derived from the socio-technical perspective (Patterson et al., 2005).
The Open system quadrant emphasizes the interaction and adaption of organization in its environment, with managers seeking resources and innovation in response to environmental, or market demands (Cameron et al., 2006). It is defined by decentralization, expansion and focus on the competitive position of the overall
system. Patterson et al. (2005) argue that this quadrant has a focus on readiness, innovation and change, where norms and values are associated with growth, resource acquisition, creativity and adaption.
The Internal process quadrant is defined by centralization-integration, continuity and maintenance of the socio-technical system. It emphasizes stability, where the effects of the environmental uncertainty are ignored or minimized
(Patterson et al., 2005). Coordination and control are achieved by adherence to formal rules and procedures.
The last quadrant, the Rational goal quadrant focuses on the competitive position of the overall system, maximization of output, and centralization-integration. It reflects a rational economic model of organizational functioning in which the emphasis is upon productivity and goal achievement. The focus is on the pursuit and attainment of well-defined objects, where norms and values are associated with efficiency, goal fulfillment and performance feedback (Quinn & Rohrbaugh, 1983).
These four quadrants represent opposite or competing assumptions (Cameron et al., 2006). Each continuum highlights value creation and key performance criteria that are opposite from the value creation and performance criteria on the other end of the continuum – i.e. internal focus versus external focus, flexibility versus stability. The dimensions produce quadrants that are also contradictory on the diagonal. The competing elements in each quadrant give rise to one of the most important features of the CVF, the presence and necessity of paradox (Cameron et al., 2006). However, Quinn and Rohrbaugh (1983) emphasize that the different values are not mutually exclusive within one organization. This implicates that one organization can
emphasize a value form the Human relations quadrant and at the same time with equal strength emphasize a value from the Rational goals quadrant.
Finding an appropriate measure on change readiness at both individual and organizational level has proven difficult. An alternative to using questionnaires that still are in their preliminary stages is to use a conceptual related measurement with questions that capture the same content as change readiness. As mentioned earlier, organizational climate is related to change readiness (Cunha & Cooper, 2002). An alternative could therefore be to measure readiness for change by using an instrument widely used to measure organizational climate. OCM could be an appropriate
measurement since it, unlike measurements of change readiness, is validated and reliable, in addition to having a robust theoretical basis. It would therefore be
interesting to examine whether the OCM can be used to measure change readiness.
Measuring Change Readiness using OCM
Although the OCM can offer an alternative for measuring the internal context under which change embarks, it was not designed to diagnose specific events like organizational change. Among others, Bouckenooghe et al. (2009) argue that the OCM cannot be used to study change, since it was not designed to diagnosed change-specific context. Consequently, a major issue when applying the OCM to a change context is that this tool incorporates a large number of dimensions that are not relevant for the diagnosis of employees’ readiness for change, and as such would imply a breach of the scientific principle of parsimony. However, Patterson et al. (2005) argues that the OCM can be used in a more refined way by selecting scales most applicable to the research question being posed. Hence, the OCM can be used to measure a specific construct, such as change readiness, while in accordance with the principle of parsimony.
Jones, Jimmieson, and Griffiths (2005) found a relationship between culture and change readiness. They found that employees who perceived a supportive and participative culture reported higher levels of change readiness. Further research found that organizational members are more likely to have higher levels of individual readiness for change when they perceive their work environment to have the
characteristics associated with Human relations or Open system cultures (e.g. Cunha & Cooper, 2002; Haffar, Al-Karaghouli, & Ghoneim, 2014). Knight (2014) examined this further and found that the Open system and Human relation quadrant had
employees with increased levels of change readiness compared to the other two quadrants.
Patterson et al. (2005) argue that the Open system quadrant and its OCM dimensions have an emphasis on readiness for change. The dynamic and innovative nature of the Open systems quadrant would suggest that employees in this culture are more likely to possess positive attitudes towards organizational change (Jones et al., 2005). This is supported by Zammuto and Krakower (1991) who found that Open systems cultures are dynamic and entrepreneurial, usually displaying significant levels of adaptability and change readiness.
In addition to being conceptually related, the questions of the three OCM dimensions in the Open system quadrant are similar to Vakola’s (2014) individual change readiness scale. However the level of analysis is different. While Vakola
(2014) focus on an individual perspective with question formulations such as “When changes occur in my company, I have always the intention to support them”, the OCM questions in the Open system quadrant are on the organizational level and have formulations such as “This company is quick to respond when changes need to be made”. Despite the fact that the two surveys are on different levels, the content of the six Vakola (2014) questions are similar to the 16 OCM questions in the Open system quadrant (Patterson et al., 2005).
Patterson et al. (2005) argue that the OCM can be used to examine relationship of a specific construct in or across quadrants in the CVF. This is fascinating because the quadrants on the diagonals in the CVF are diametrically opposite of each other. Accordingly, opposing or competing values can be examined. Patterson et al. (2005) argue that while studying change one should both examine the change related Open system quadrant and the opposite, the Internal process quadrant.
To summarize, Patterson et al. (2005) argue that parts of the OCM can be applied to measure organizational change. This is supported by empirical research which have shown that the Open system quadrant of the CVF is related to change readiness (e.g. Knight, 2014; Zammuto & Krakower, 1991). In addition to being conceptually related, the content of the OCM questions in the Open system quadrant are similar to the change readiness questions by Vakola (2014). This illustrates that the Open system quadrant can be used to measure change readiness.
The Present Study
The purpose of this thesis is to clarify central aspects of change readiness, focusing on how to successfully quantify readiness for change. Specifically this thesis examines how change readiness at different organizational levels are related to each other, the relation between positive and negative change readiness and whether qualitative measurements detects the same amount of change readiness as quantitative questionnaires.
Ongoing and successful changes are necessary for organizations to survive, be effective and sustain a competitive advantage. Despite the fact that change readiness is identified as a core issue related to a successful organizational change (Burke et al., 1984), organizational researchers and practitioners know little about the multifaceted nature of readiness for change (Szabla, 2007). Rafferty et al. (2013) argue that it is necessary to measure change readiness prior to a planned change in order to develop an accurate understanding of the likelihood of a successful change. This is supported
by Armenakis et al. (1993) who argue that change readiness should be assessed in order to identify gaps in employees change readiness, and thereby be able to reduce resistance to change and other threats to a successful change. It is therefore important to clarify how to successfully quantify change readiness.
Change readiness has often been understood as a positive attitude to change, while resistance to change has been understood as the opposing negative attitude to change (Bouckenooghe, 2010). It is therefore not surprising that there is a lack of research on a negative component of change readiness. Accordingly, it is unclear whether change readiness is similar to attitude research, where researchers have found that separate positive and negative attitudes can and do co-exist (e.g. Cacioppo et al., 1997; de Liver et al., 2007), or whether positive and negative change readiness are significantly different from each other. Understanding the nature of ambivalence in employee responses to change can be useful in identifying the most appropriate method to ensure a successful change (Piderit, 2000).
Hypothesis 1: “Positive change readiness is significantly different from negative change readiness”
A number of researchers have expressed a need to examine change readiness using qualitative methods (e.g. Rafferty et al., 2013; Szabla, 2007). Piderit (2000) takes this further and argue that there is a need to study change using qualitative interviews. Since there is a lack of qualitative research on change readiness it is not surprising that there is also a lack of research using triangulation. By using more than one method, limitations and flaws in one method can be eliminated by the strengths of the other. When independent measures show the same pattern, or at least not
contradictory, more certain and complete information can be obtained (Jonsen & Jehn, 2009). This thesis responds to the previously mentioned limitations in the research field and these authors call for further research by using both quantitative questionnaire and qualitative interviews to examine change readiness, thereby also taking advantage of the method of triangulation.
Hypothesis 2: “The change readiness pattern measured by the survey will be identical to the change readiness pattern measured by the interview”
One major limitation of previous research is that few researchers have adopted a multilevel perspective. In response to this limitation and the call for future research of Rafferty et al. (2013), this thesis will examine the relationship between overall change readiness at the organizational and at the individual level. This relationship is theorized by Rafferty et al. (2013) and is represented with a lightly dashed line in their model (see Figure 1). They argue that there is a potential cross-level relationship between individual and organizational change readiness. However, they also state that this relationship needs further research.
Hypothesis 3: “There is no difference in overall change readiness between individual and organizational level”
Method
Research on change readiness have mostly been done on organizations before the implementation of a big planned change (e.g. Holt et al., 2007a; Vakola, 2014). The Norwegian police will be facing substantial organizational changes in the near future due to the evolution of crime in Norway, the demand for more cost-efficient organizations and recent evaluations and analyses of the present Norwegian police force (e.g. NOU 2012:14, 2012; NOU 2013:9, 2013; Yilmaz, 2013). It has been signaled that the reforms will be in line with the recommendation from the evaluations and analyses (NOU 2013:9, 2013).
Qualitative Interview Data
Sample. The qualitative interview data collection was conducted over a
four-year period from 2009 to 2012. This was part of a large ongoing research project, in collaboration between the Norwegian Police University College and the University of Oslo. A strategic sampling procedure was used to ensure subjects with three different job levels within each of the districts. The police chiefs in all of the 27 police districts in Norway were contacted. They selected the participants in the district based on their job level. 89 in-depth and open tape-recoded interviews were held with 30 police investigators, 30 principal investigators, and 29 chief police officers. From all but one district, three or four respondents, with at least one from each level, was interviewed. There were 26 female and 63 male respondents. In the largest district, a total of eight interviews were conducted to cover the range of different experiences and the
complex crime picture. All participants received a letter of information with the interview questions prior to the interview (Appendix A).
Interview procedure. A trained interviewer from the Norwegian Police University College with extensive knowledge of the police organization conducted all of the 89 interviews to secure the reliability. In addition, a co-interviewer from the University of Oslo participated, with the purpose to ask follow-up questions. The co-interviewers were either members of the research group or master’s students on the project. The interviews were conducted in the investigators’ offices.
Being careful not to impose any ready-made categories, the respondents were asked to reflect on the strength, weaknesses, opportunities and threats of criminal investigation. This structure was chosen because it encourages the subject to reflect upon many different aspects of work, while still allowing for an open interview form. In addition to the four questions, follow-up questions were asked to make the subject clarify or elaborate on previously mentioned topics. The interviewers did not
introduce new topics through follow-up questions, as this could bias the data.
Treatment of the interviews. The interviews were recorded on tape and were
transcribed verbatim. Thereby including everything that is said during the interview, and excluding non-verbal communication such as gestures and facial expressions. This was done to ensure that as little information as possible is lost in connection with processing of the data. All local dialects were translated into Norwegian Bokmål.
The transcripts were then unitized, a step that is necessary before performing further coding of the data (Neuendorf, 2002).Unitizing is based on the principle of having the smallest possible meaningful interview statements. The whole data set consisted of a total of 18 929 units.
The statements were then coded on different frameworks, such as four organizational levels (IGLO - individual-, group-, leadership-, and organizational level) and SWOT (strengths, weaknesses, opportunities, threats). The statements were also coded on the 17 different OCM dimensions. Statements that did not fit any of the categories were coded as residuals. The OCM coding was done by first attempting to identify the quadrant of CVF the statement belonged to. The purpose of doing this is to reduce the number of potential categories to a more manageable number. Doing so can also ensure more consistent coding on categories that otherwise might seem to overlap. How statements had previously been coded on SWOT and IGLO was also considered.
Inter-rater tests were conducted in the different steps of the data treatment to control the reliability throughout the process (Neuendorf, 2002). Inter-rater reliability
among coders was measured by calculating pairwise Krippendorff’s Alpha and
percentage agreement across three different interviews. Reliability was measured both for the top-down coding on SWOT and OCM. On SWOT Krippendorff’s Alpha ranged from 0.44 to 0.66 with an average of 0.57. The pairwise percentage agreement ranged from 57.8% to 73.7%, with an average percentage agreement of 67.1%. The OCM inter-rater was measured in the middle of the coding process. Krippendoff’s Alpha was 0.36. Pairwise percentage agreement had an average of 49.26%.
Measure. The interview was used as a measurement at the individual level.
To test the first hypothesis which addressed whether positive and negative change readiness are different from each other, the Open system and Internal process quadrant in the CVF were used. The Open system quadrant was used as an operationalization of positive change readiness since this quadrant and its OCM questions capture the phenomena change readiness (see “Measuring Change
Readiness using OCM”). The Internal process quadrant was chosen for examining the competing values to the change readiness quadrant. The Internal process quadrant was used as an operationalization of negative change readiness.
The OCM dimensions in the quadrants were used to calculate the score on the CVF quadrants in accordance to Patterson et al. (2005). The Open systems quadrant includes the OCM dimensions Innovation & flexibility, Outward focus and
Reflexivity, and Internal process quadrant consists of Formalization and Tradition. Only the statements coded on these five OCM dimensions were used. Of 18929 statements, only 2984 were coded on these dimensions belonging to the Open system quadrant or the Internal process quadrant. The rest of the statements were discarded, since they were not relevant for change readiness. Of the 89 participants, one
participant did not mention topics that are included in these two quadrant and was therefore excluded from the analysis.
To test the first hypothesis, whether positive and negative change readiness are different from each other, the SWOT dimensions were used. A value on strength and opportunity was valued as a positive statement, while weakness and threat as a negative statement. The positive and negative statements were then compared both in the Open system quadrant and in the Internal process quadrant. Since the Open system quadrat was operationalized as positive change readiness, a positive coded statement in this quadrant was interpreted as positive change readiness. A negative coded statement in this quadrant was interpreted as negative change readiness.
Following the same logic, a positive statement in the Internal process quadrant, which was operationalized as negative change readiness, was interpreted as a negative change readiness statement, and a negative statement in this quadrant was interpreted as a positive change readiness statement.
Analysis. The hypotheses were tested with a mixed strand of the qualitative
interview data. The mixed strand of data was aggregated at the level of each participant. This involved summing up of the number of statements coded at each SWOT dimension and OCM for each participant. The aggregated file did therefore have the participants in the rows, with one participant in each row, and the different variables as columns. The variables were the number of statements for each of the four SWOT dimension and residuals divided on the five OCM dimensions and the CVF quadrants (35 variables in total).
A Kolmogorov-Smirnov test was performed to test if the interview data was normally distributed. The Open system quadrant D(87) = 0.14, p < 0.01, and Internal process D(87) = 0.18, p < .01 were both significantly non-normal. It was therefore necessary to use non-parametric tests (Field, 2011).
Quantitative Survey Data
Sample. The quantitative sample for the questionnaire originated from the
interview sample, as each interviewee was asked to fill out a survey after their interview. The sample consisted of 76 participants. All but one were also part of the interview sample. Everyone of the 27 districts were represented.
The first 51 participants received an email following the interview, inviting them to complete the survey, and then the survey was sent by mail. 39 (76.5%) participants completed the survey. In addition one person who had not been interviewed completed the survey. The last 38 participants were handed a physical copy of the survey after the interview. This increased the response rate. 36 (92.3%) participants responded. Combined, 75 of the 90 participants completed the survey, resulting in a response rate of 83.3%.
Procedure. Quantitative data was gathered using the Organizational Climate
Measure (OCM). As previously mentioned, the OCM consists of 82 items that assess respondents’ perception of their work environment on 17 scales. A version of the questionnaire translated to Norwegian was used to increase comprehension within the given context. This translation has been validated by Bernstrøm (2009).
The first 51 participants received the survey by mail after their interview. The letters were personally addressed and sent to the place of work. The letters contained a personal letter, an instruction, the survey and an addressed return envelope. The last 38 participants were given the questionnaire and handed it in to the interviewer immediately or sent the completed survey by post using a stamped addressed envelope accompanying the survey.
Measure. The OCM was used at an organizational level. The OCM
dimensions in the quadrants were used to calculate the score on the CVF quadrant in accordance to Patterson et al. (2005). The Open system quadrant was used as an operationalization of positive change readiness since this quadrant captures the change readiness concept (see “Measuring Change Readiness using OCM”). The Internal process quadrant was used as an operationalization of negative change readiness.
Analysis. The results were manually punched into SPSS version 20. Missing
values were replaced by the mean on the respective scale. Then, the values on the respective scales for each respondent were combined in order to generate an
aggregated score for each respondent on each scale. This was done in accordance with the guidelines provided by Patterson et al. (2005).
A t-test was used. The dependent t-test is a parametric test and therefore assume that the sample follows a normal distribution and that data are measured at least at the interval level (Field, 2011). To test if the survey data were normally distributed, a Kolmogorov-Smirnov test was performed on both the Open system quadrant D(75) = 0.06, p = .20, and Internal process quadrant D(75) = 0.09, p = .18, showing that both these measures have normal distribution. The data were measured with a 4 point Liket scale and is therefore an interval variable. Both assumptions for the paired-sample t-test are therefore fulfilled.
Combined Data
The combined data sample consisted of 75 participants. This sample was based on the interview and the survey data samples. The combined data sample consisted of the participants that were interviewed and completed and returned the OCM survey. One of the participants who completed the OCM questionnaire was not interviewed and was therefore excluded from the combined data sample. The sample, procedure and measure for the combined method sample are therefore the same as the
above description for the qualitative interview and the quantitative survey data. All of the 27 districts were represented.
A separate aggregated file was created for the combined data. Like the interview data, the combined data had an aggregated file with each participant in the rows and variables in the columns. In addition to the 35 variables form the interview data, the combined data file also included the survey score for each of the five OCM dimensions, and a score for the two CVF quadrants. This made a total of 43 variables.
Since the combined data included a different number of participants than the interview data, a Kolmogrov-Smirnov test was performed on the combined data interview sample to test whether it was significantly non-normal. The Open system quadrant was significantly non-normal D(74) = .13, p < .01. The Internal process data were also significantly non-normal D(74) = .11, p < .05. Non-parametric test were therefore used for the combined data sample.
Ethical considerations
The project is approved by the Norwegian Social Science Data Service (NSD – Norsk Sammfunnsvitenskaplige Datatjeneste). Before participation, all participants were informed about the procedure and purpose behind the study (Appendix A). The participation was voluntary, and the participants received and signed informed consent forms. It was possible to withdraw at any time during the interview or afterwards. The interviews were recorded, which the participants agreed to in advance. After transcription the recorded files from the interviews were deleted.
To ensure anonymity, the survey and interview data are in separate files. Another researcher on the project paired the interview and survey data, as only two persons have the key with the pairing number. This was done to further ensure anonymity. The final data file is numerical and does not provide any information regarding the participants’ identity or contains the statements from the interview. It only contains the frequency of statements coded on SWOT and OCM, and the OCM scores and CVF scores from the survey.
Results Descriptive Statistics
Qualitative interview data. The interview data was used to test the first
hypothesis. It consisted of 2984 statements from 88 participants that were coded on either the Open system or the Internal process quadrant of the CVF. One of the 89 participants did not mention topics that are included in these two quadrants, hence did
not have any statements that were coded on neither Open system nor Internal process. This participant was excluded from the analysis. The number of statements ranged from 1 to 84 per person, with a mean of 21.14 for Open system and from 1 to 61 per person with a mean of 12.87 for Internal process. As previously mentioned, the Open system quadrant was operationalized as positive change readiness, while the Internal process quadrant was operationalized as negative change readiness. Table 1 show the distribution of statements coded on SWOT.
Table 1
SWOT statements distributed on positive and negative change readiness
Strength Weakness Opportunity Threat Residual Total
Positive change
readiness 511 372 700 226 30 1839
Negative change
readiness 333 417 183 175 37 1145
Total 844 789 883 401 67 2984
There were approximately an equal amount of statements coded on strength (844 statements, 28.3%), weakness (789 statements, 26.4%) and opportunity (883 statements, 29.6%), while threat had 401 statements (13.4%). Positive change
readiness had a total of 1839 statements (61.6%), while the negative change readiness had a total of 1145 statements (38.4%). The positive change readiness had most statements coded on opportunity with 700 statements (38.1%), while the negative change readiness had most statements coded on weaknesses with 417 (36.4%). A total of 67 (2.2%) statements were coded as residuals. This indicates that the SWOT
structure is capable of catching a large proportion of the statements given during the interviews.
To test the first hypothesis, the strength and opportunity were combined to positive scores and weaknesses and threats were combined to negative scores. As shown in table 2, which is derived from table 1, positive change readiness had 1211 positive statements (65.9%), while negative change readiness had 516 positive statements (45.1%). Positive and negative change readiness have almost the same amount of negative statements with 598 and 592 respectively. However, positive
change readiness has more then twice as many positive statements, thereby reducing the percentage of negative statements.
Table 2
Positive and negative statements distributed on positive and negative change readiness
Positive Negative Residual Total Positive change readiness 1211 598 30 1839
Negative change readiness 516 592 37 1145
Quantitative survey data. The survey data consists of data from 76 OCM
questionnaires. Table 3 presents the descriptive statistics for the survey measure for positive and negative change readiness.
Table 3
Descriptive statistics for positive and negative change readiness
Min Max Mean SD
Positive change readiness 1.60 3.51 2.60 0.47 Negative change readiness 1.90 4.00 2.88 0.41
The OCM questionnaire uses a 4 point Likert scale ranging from 1 “definitely false”, 2 “mostly false”, 3 “mostly true” to 4 “definitely true”. An aggregated score below 2 is considered negative, a score between 2 and 3 is considered neutral, and a score above 3 is considered positive. Both the positive and negative change readiness had a mean between 2 and 3, and are therefore considered to be neutral. The survey data indicates that the participants on average were neutral toward both positive and negative change readiness.
Combined data. The combined data was used to test the second and third
hypotheses. It was extracted from the interview sample by extracting only the
participants that were both interviewed and completed the survey. The combined data sample consisted of 75 participants. One of the participants who completed the OCM questionnaire was not interviewed and was therefore excluded from the combined data sample.
Open-ended interview data were standardized through a transformation process in order to be comparable with the survey data, inspired by the calculations of Berglund (2012). The positive SWOT statements (strength and opportunity) were added and computed as positive values, while the negative SWOT statements (weakness and threat) were added and computed as negative values. Individual indexes were calculated for participants on the respective CVF quadrant with the equation:
𝐶𝑎𝑙𝑐𝑢𝑙𝑎𝑡𝑒𝑑 𝑖𝑛𝑑𝑒𝑥 𝑠𝑐𝑜𝑟𝑒= 𝐶𝑜𝑚𝑝𝑜𝑛𝑒𝑛𝑡!"#−𝐶𝑜𝑚𝑝𝑜𝑛𝑒𝑛𝑡!"#
𝐶𝑜𝑚𝑝𝑜𝑛𝑒𝑛𝑡!"#+𝐶𝑜𝑚𝑝𝑜𝑛𝑒𝑛𝑡!"!
This calculation gave an estimate of whether the participant was mostly positive or negative, ranging from -1 to 1. The formula by Berglund (2012) was changed to make this index comparable and in the same range as the OCM survey, where scores ranges from 1 to 4:
𝐶𝑎𝑙𝑐𝑢𝑙𝑎𝑡𝑒𝑑 𝑖𝑛𝑑𝑒𝑥 𝑠𝑐𝑜𝑟𝑒= 𝐶𝑜𝑚𝑝𝑜𝑛𝑒𝑛𝑡!"#−𝐶𝑜𝑚𝑝𝑜𝑛𝑒𝑛𝑡!"#
𝐶𝑜𝑚𝑝𝑜𝑛𝑒𝑛𝑡!"#+𝐶𝑜𝑚𝑝𝑜𝑛𝑒𝑛𝑡!"#× 1.5 +2.5
Table 4
Descriptive statistics for the combined sample using the calculated index score
Interview Questionnaire
Mean SD Mean SD
Positive change readiness 2.89 0.61 2.60 0.41 Negative change readiness 2.37 0.79 2.88 0.40
As shown in table 4, the positive change readiness had a more higher mean when measured with interview at the individual level compared to the organizational level measured by questionnaire. However, negative change readiness had a higher score at the organizational level compared to the individual level. A t-test was performed to se if this relationship between individual level and organizational level was significant.
Inferential Statistics
Hypothesis 1. The hypothesis “positive change readiness is significantly
different from negative change readiness” was first tested for the Open system quadrant, and for the opposite quadrant, the Internal process quadrant. A t-test was used to examine whether the positive attitudes to change readiness were significantly different from negative attitudes in each quadrant. The SWOT coding made it
possible to test whether the difference between positive and negative change readiness was significantly different in both quadrants, one was operationalized as positive change readiness (Open system quadrant) and one was operationalized as negative change readiness (Internal process quadrant).
The non-parametric Wilcoxon Signed ranked test was performed since the interview data was non-normal distributed. There was a significant difference between the frequency of the positive and negative statements for the Open system quadrant. There were significantly more positive statements than negative statements (T = 215.5, p < .001). However, there was not a significant difference between the positive and negative change readiness for the Internal process quadrant
(T = 868.0, p = .13).
Another way to test this hypothesis is to calculate an index score in each quadrant. The calculated index score was used to compare positive change (Open system quadrant) to negative change readiness (Internal system quadrant). There was a significant difference (T = 513, p < .001) when using the calculated index score.
A third way to test this hypothesis is to test the relationship between positive and negative change readiness at an organizational level. Since the qualitative survey data is normally distributed, a t-test was used. When comparing positive change readiness (Open system quadrant) with negative change readiness (Internal process quadrant) there was a significant difference (t(75) = 3.58, p < .001).
After running four different tests on the first hypothesis, it is only partially supported. There was a significant difference at the organizational level, however in one of three tests at the individual level there was not a significant difference.
Hypothesis 2. Two separate t-tests were performed to test whether interviews
can detect the same pattern in change readiness as the survey. One t-test was used on the interview calculated index score and another on the survey data. The relationship between the positive change readiness and negative change readiness was tested for
both samples. This was done in order to examine whether the pattern in the two samples were similar.
The positive change readiness had a significantly higher score than the negative change readiness when measured by the interview (T = 513, p < .001). However, the pattern was opposite in the survey data. Negative change readiness (M = 2.88, SE = 0.05) had a higher score compared to positive change readiness (M = 2.60, SE = 0.4), t(75) = 3.58, p < .001. Since the patterns are different in the interview sample and survey sample, the second hypothesis is discarded.
Hypothesis 3. A Wilcoxon Signed ranked test was used to test the hypothesis
“there is no difference in overall change readiness between individual and
organizational level”. The organizational level measured by the questionnaire was compared to the individual level measured by the interview calculated index score. When comparing the interview and questionnaire, positive change readiness was significantly different at the individual and organizational levels (T = 765, p < .001). This was also true for negative change readiness; the individual and organizational level were significantly different (T = 610, p < .001). This shows that there is a difference in change readiness between individual and organizational level, thereby rejecting the third hypothesis.
Discussion
The purpose of this thesis is to clarify central aspects of change readiness, focusing on how to successfully quantify readiness for change. As pointed out above, there is little knowledge about the multifaceted nature of change readiness (Szabla, 2007). In order to provide researchers and practitioners with insight and more knowledge on the topic, this thesis studies three hypotheses related to change readiness and how to measure it.
The first hypothesis addressed the issue of whether positive change readiness was different from negative change readiness and it was partially supported. Positive change readiness was significantly different from negative change readiness when measured for the Open system quadrant of the CVF. In addition, a significant difference was found when using the calculated index score and comparing positive readiness measured by the Open system quadrant to negative change readiness measured by the Internal process quadrant for both the interview and the survey data. However when measuring for the Internal process quadrant there was not a significant
difference. This indicates that there is an ambivalent relationship between positive and negative change readiness.
The second hypothesis addressed whether the interview detected the same pattern in change readiness as the survey, and it was discarded. The interview
detected more positive than negative change readiness. The survey, on the other hand, detected more negative than positive change readiness. By using interviews to
measure change readiness the interviewee is free to use his or her own words and categories. Open-ended interviews allow for in depth exploration of individuals’ evaluation of relevant themes in a specific context. This could lead to a different level of change readiness then by using a survey with pre-selected categories.
The third hypothesis addressed whether change readiness at individual and organizational level were the same and it was also discarded. A significant difference between change readiness at the individual level and at the organizational level was found both for positive and negative change readiness. This indicates that individual and organizational change readiness are different from each other.
The second and third hypotheses were tested using two different methods to measure change readiness at two different levels. A significantly more positive score was detected measured by interview at the individual level compared to the survey which measured at the organizational level. It is therefore difficult to say whether the difference detected was a result of an effect from the measurement, the level it was measured at or a combination of the two. This is discussed further in the next section.
As illustrated by these three hypotheses and their findings, measuring change readiness is not as easy as first thought. These three hypotheses addressed different gaps in the research field. There has been a lack of research on how positive and negative change readiness are related to each other. Results from this thesis indicate that there is an ambiguous relationship between positive and negative change
readiness. In addition to a lack of research on negative change readiness, there is also a lack of research on change readiness done with qualitative methods. It was found that interviews and surveys did not detect the same level of change readiness. Lastly, individual and organizational change readiness were significantly different from each other. This addresses a lack in the research field on research using and examining different levels of change readiness. In summary, this thesis contributes to the field by shedding light on different gaps in the field of change readiness and focus on how to successfully quantify readiness for change.
Implications for Theory and Practice
Change readiness has been identified as a core issue related to the success of an organizational change (Armenakis et al., 1993). In order to develop an accurate perception and thereby increasing the probability of an effective change, it is
important to measure change readiness prior to large-scale change implementation. In addition, understanding that reaction to change can be ambivalent on a
multidimensional level helps practitioners choose better measurements that can identify this ambivalence.
Seo, Putnam, and Bartunek (2004) identified the dimension positive versus negative as crucial characteristics of the change process. However, there is a lack of research on negative change readiness in general and more specifically how negative relates to positive change readiness. A possible explanation is that change readiness often has been interpreted as a positive attitude towards change, while resistance to change has been understood as the opposing negative attitude.
In the absence of substantial research on negative change readiness, a description of these attitudes can be based on the more general research on attitudes of change. Negative change readiness can be described as a pessimistic focus that accentuates negative aspect of organizations, such as various problems at hand (Bouckenooghe, 2010). On the other hand, positive change readiness can be said to emphasize the optimistic reasons for change, such as creating new opportunities or developing a positive future vision (Seo et al., 2004).
Results from this thesis indicate that the relationship between positive and negative change readiness is not as simple as first thought. In one of the three tests at the individual level, a significant difference did not emerge. This indicates that change readiness at an individual level can be both positive and negative at the same time. However, when tested at the organizational level, there was a significant difference between positive and negative change readiness. This indicates that the co-existence between positive and negative change readiness only exists on the
individual level.
The results indicate that people are nuanced and have complex attitudes to change at the individual level. This is in contrast to the conceptualization of change readiness as defined by Armenakis et al. (1993). They conceptualize change readiness only as a positive attitude, ranging from low to high. Based on their definition, one would expect to find a significant difference between positive and negative change
readiness in all of the three tests. The findings in this thesis is also in contrast with Rafferty et al. (2013) whoargue that change readiness is either a positive or a negative attitude towards change. However, the results are more in compliance with newer attitude research, where researchers have found that separate positive and negative attitude co-exist (e.g. Cacioppo et al., 1997; de Liver et al., 2007). The findings show that change readiness is more complex than earlier assumed, and thus increase the diversity of the perception of change readiness.
The co-existence of positive and negative attitudes reflects the ambivalent nature of change readiness. Drawing on attitude research, the ambivalence can result from simultaneously conflicting beliefs within the cognitive component, or from a conflict between the cognitive and affective component (Ajzen, 2001; Eagly & Chaiken, 1993). This is in line with Piderit (2000) who argue that attitudes towards change are tridimensional with a cognitive, an affective and an intentional component. The ambivalence detected in change readiness can therefore be a consequence of conflicting positive and negative change readiness within the cognitive dimension or from conflicts between positive and negative change readiness in the cognitive and affective dimension. Understanding that reaction to change can be contradictory helps practitioners understand that negative beliefs and negative emotions not necessarily lead to negative intentions and actions, as positive beliefs and positive emotions not necessarily lead to positive intentions and actions (Szabla, 2007).
It is unclear how co–existence of positive and negative change readiness influences a person’s overall change readiness level. It is possible that negative change readiness acts as an opposite force to positive change readiness and thereby they could neutralize each other in a linear fashion, or exponential, or even not at all. By using just one score to indicate change readiness it is uncertain what this value reflects. It is therefore important for managers to assess both the negative and the positive change readiness independently in order to get a complete picture of the employees’ change readiness level. Thereby being able to more accurately assess readiness for change before a planned transition.
Understanding the nature of ambivalence in employee responses to change can be useful in identifying the most appropriate method to ensure a successful change (Piderit, 2000). The results from the first hypothesis in this thesis indicate that, in contradiction to previous research and definitions of change readiness, there is an ambivalent relationship between positive and negative change readiness indicating
that these two can co-exist. Accordingly, it is still unclear how positive and negative change readiness influence a persons overall change readiness. It is therefore
important to measure separately both positive and negative change readiness. In order to test the second and third hypotheses in this thesis, two different methods were used to measure change readiness at two different organizational levels. The two methods were not used in parallel at the same level. A significantly more positive score was measured at the individual level using interviews compared to the score at the organizational level where a survey was used. It is therefore difficult to conclude if the difference detected is a result of an effect of the measurement itself, an actual difference in change readiness at the two different organizational levels or a combination of the two. In order to examine these findings systematically, the discussion will first focus on analyzing the implications assuming that the difference detected is a result of the method chosen. Then the implications for the organizational level will be discussed assuming that the difference observed is an effect of the relationship between individual and organizational levels. The implication of not using the methods in parallel will then be further discussed under “Limitations”.
Many researchers have expressed a need to examine change readiness using qualitative methods (e.g. Rafferty et al., 2013; Szabla, 2007), and specifically with qualitative interviews (Piderit, 2000). Since there is a lack of qualitative research on change readiness it is not surprising that there is also a lack of research using
triangulation.An objective for using triangulation is to increase the understanding of a phenomena, and thereby also provide more complete information (Jonsen & Jehn, 2009). Cambell and Fiske (1958) recommend that more than one method should be used to confirm that the variance detected reflects that of the construct.To assess the limitations in the field of research, this thesis used both questionnaires and interviews to examine change readiness.
Various research on mixed-methods show that interviews and surveys are based on incompatible and incommensurable philosophical assumptions (e.g. Howe, 1988; Ogborne, 1995). However, this is in contrast with other research which show that these methods are comparable (e.g. Jex, Adams, Elacqua, & Lux, 1997; Lund, 2005). The results from this thesis show that change readiness was different
measuring with interviews compared to using a survey. The results indicate that the construct change readiness depends on which method is used to measure it. It is therefore not indifferent which method is chosen. This has practical implications,
making the choice of method of utmost importance. Taken to an extreme, measurements of change readiness can be biased by the sole choice of method.
The results show that the participants have a higher score on negative change readiness in the survey compared to the interview. In addition, a higher score on positive change readiness in the interview compared to the survey was found. A possible interpretation of these results is that the participant aims to mirror more social desirable attitudes, behaviors or perceptions. Answers from surveys may reflect what a participant assumes to be an appropriate answer based on the wording of the question. However, this may also occur or even be stronger in the interviews. Richman, Kiesler, Weisband, and Drasgow (1999) found that survey reduced social desirability compared to interviews since they are self-administered and more
removed from the social cues that emerge in an interview situation. This could lead to more positive change readiness in the interview compared to the survey.
Richman et al. (1999) also found that face-to-face interviews were motivating and encourage longer, more elaborated answers. Hence, the participant could be more reflected in the interview, giving longer answers. This could also lead to more
positive change readiness in the interview compared to the survey. Through
interviews employees can more openly express their feelings, attitudes and concerns regarding change, not being limited to the preselected questions. In addition,
interview research can play a role in uncovering important work components that are not covered by structured survey instruments. Through interviews it is also possible to receive suggestions on necessary actions to be implemented in order to make the whole change process more successful. This represents a bottom–up input. However interviews are time consuming, subjective and difficult to prove reliable and valid. Surveys, on the other hand, are time-efficient and easy to administer. However, surveys consist only of pre-selected items and components. Because of these
differences, the method can accentuate different opinions regarding the components (Lund, 2005).
In this thesis the interview can influence the results of the survey since the participants may have been primed with the same themes twice. However, the questions differ. The questions in the interview were general questions regarding the daily work, and the questions in the survey were specific questions measuring organizational climate.