Bioproducts Development Survey:
Analysis of the Summary Results
by David Sparling John Cranfield, Spencer Henson Pamela Laughland prepared for
Agriculture and Agri-Food Canada
BIOPRODUCTS DEVELOPMENT SURVEY : ANALYSIS OF THE SUMMARY RESULTS
September 2006Research and Analysis Directorate Strategic Research
Agriculture and Agri-Food Canada
David Sparling and John Cranfield are Associate Professors and Spencer Henson is a Professor in the Department of Agricultural Economics and Business at the University of Guelph. Pamela Laughland is a research assistant in the Department of Agricultural Economics and Business.
© Her Majesty the Queen in Right of Canada, 2006
Any policy views, whether explicitly stated, inferred or interpreted from the contents of this publication, should not be represented as reflecting the views of Agriculture and Agri-Food Canada (AAFC).
AAFC does not control the availability of Internet web sites featured in this report. Therefore, it does not take responsibility for severed hyperlinks or discontinued web pages mentioned herein. Links to these web sites are provided solely for the convenience of users. AAFC does not endorse these sites, nor is it responsible for the accuracy, the currency or the reliability of the content. Users should be aware that information offered by sites other than those of the Government of Canada are not subject to the Official Languages Act.
Electronic versions of Research and Analysis Directorate publications are available on the Internet at www.agr.gc.ca/ pol/index_e.php
Publication 10170E ISBN 0-662-44024-2
Catalogue A38-1/2-2003E-PDF Project 06-052-r
Aussi disponible en français sous le titre :
Bioproducts Development Survey: Analysis of the Summary Results iii
T a b l e o f C o n t e n t s
Foreword... xi
Executive summary... xiii
Introduction... xvii
Limitations... xix
Overview of the bioproducts survey results ... xxi
Common themes in the Canadian bioproducts sector ... xxi
Provincial differences... xxii
Firm size differences ... xxv
Policy implications ... xxvii
Detailed Analysis of the Bioproduct Development Survey Summary... xxix
Chapter 1
Canadian bioproducts businesses ... 1Entry into the bioproducts sector... 2
Ownership ... 3
Chapter 2
Bioproduct development and use... 5Bioproduct development ... 5
Biomass use ... 7
Chapter 3
Bioproduct revenue and expenses ... 13Bioproduct revenue... 13
Bioproduct research and development expenditures ... 15
Chapter 4
Intellectual property ... 17Chapter 5
Contracts and collaborations... 21Contracts ... 21
Collaborations... 23
Foreign collaborations ... 27
Chapter 6
Financing... 31Bioproducts Development Survey: Analysis of the Summary Results
iv
Chapter 8
Human resources ... 41Chapter 9
Benefits and barriers... 45Benefits from bioproduct development and production... 45
Barriers to bioproduct development and production ...47
Chapter 10
Business strategies ... 51Chapter 11
Discussion and conclusions... 55Suggestions for improvements to the survey instrument... 55
Recommendations for further analysis... 56
Appendix A Product development by region, 2003 ... 59
Appendix B
Use of government support programs, 2003... 63Appendix C
Provincial ranking of different reasons for bioproduct employee vacancies, 2003 ...65Appendix D
Methodology of the survey...69Bioproducts Development Survey: Analysis of the Summary Results v
L i s t o f T a b l e s
Summary
Table 1
Key bioproduct firm indicators by region (2003) ... xvSummary
Table 2
Key bioproduct firm indicators by firm size ... xviTable 1
Number of years of involvement in bioproducts, 2003 ... 2Table 2
Number of firms by origin of spin-off, 2003... 3Table 3
Ownership of Canadian bioproducts firms, by region, 2003 ... 4Table 4
Ownership of Canadian bioproduct firms, by firm size... 4Table 5
Percent of firms reporting use of different biomass types, by region, 2003 ... 7Table 6
Percent of firms by type of biomass used, by firm size, 2003... 8Table7
Percent of firms by principal biomass input, by region, 2003... 8Table 8
Percent of firms by principal biomass input, by firm size, 2003... 9Table 9
Percent of firms by end user of bioproducts, by region, 2003 ... 10Table 10
Percent of firms by end user of bioproducts, by firm size, 2003 ... 11Table 11
Revenue for bioproducts firms, by region, 2003 ... 14Table 12
Average revenue/firm, by region, 2003... 14Table 13
Bioproduct firm revenue, by firm size, 2003... 15Table 14
Bioproduct firm research and development expenditures, by region, 2003 ... 15Bioproducts Development Survey: Analysis of the Summary Results
vi
Table 15
Average research and development expenditures,by firm size, 2003 ...16
Table 16
Intellectual property arrangements, by region, 2003...18Table 17
Intellectual property arrangements, by firm size, 2003...19Table 18
Total number of contracts, by partner type and region, 2003...23Table 19
Percentage of contracting firms, by firm size, 2003 ...23Table 20
Motivations for collaborations, by region, 2003...25Table 21
Motivations for collaborations, by firm size, 2003...27Table 22
Number of firms by degree of importance of purpose of arrangement with foreign partners, by region, 2003 ...28Table 23
Number of firms by degree of importance of purpose of arrangement with foreign partners, by firm size, 2003 ...29Table 24
Financing success, by region, 2003...32Table 25
Financing success, by firm size, 2003...32Table 26
Purpose of securing financing, by firm size, 2003 ...33Table 27
Number of firms by reasons for lender limiting or refusing capital requests, by region, 2003 ...34Table 28
Number of firms by reasons for lender limiting or refusing capital requests, by firm size, 2003...34Table 29
Sources of financing, by region, 2003 ...35Table 30
Sources of financing, by firm size, 2003 ...36Table 31
Firm use of SR&ED tax program in the past five years, by region, 2003 ...37Table 32
Firm use of SR&ED tax program in the past five years,, by firm size, 2003 ...38Table 33
Firm use of Government Support Programs in the past five years, by region, 2003...38Bioproducts Development Survey: Analysis of the Summary Results vii
Table 34
Firm use of Government Support Programs in the past fiveyears, by firm size, 2003... 39
Table 35
Average employees per firm with bioproduct responsibilities, by region, 2003... 41Table 36
Average employees per firm with bioproduct responsibilities, by region, 2003... 42Table 37
Total bioproduct firm employee responsibility, by firm size, 2003... 42Table 38
Average employees per firm with bioproduct responsibilities, by firm size, 2003 ... 43Table 39
Importance of factors in efforts to fill bioproducts-related vacancies, by region, 2003... 44Table 40
Importance of factors in efforts to fill bioproducts-related vacancies, by firm size, 2003... 44Table 41
Importance scores for benefits, by region, 2003 ... 46Table 42
Importance scores for benefits, by firm size, 2003 ... 47Table 43
Importance scores for barriers, by region, 2003 ... 48Table 44
Importance scores for barriers, by firm size, 2003 ... 49Table 45
Mean importance of strategies for firm, 2003 ... 22Table 46
Mean importance of strategies for firm, by region, 2003 ... 25Bioproducts Development Survey: Analysis of the Summary Results ix
L i s t o f F i g u r e s
Figure 1
Bioproducts firms by province, 2003 ... 1Figure 2
Initial entry into the bioproducts sector, 2003 ... 3Figure 3
Bioproduct development by product type, 2003 ... 5Figure 4
Product development by stage shown as a percentage of total products under development, 2003 ... 6Figure 5
Bioproduct development by product type and firm size, 2003 ... 7Figure 6
Percent of firms by distance from location of principal biomass input, by region, 2003 ... 9Figure 7
Percent of firms by distance from location of principal biomass input, by firm size, 2003 ... 10Figure 8
Percentage of firms with IP rights, by region, 2003... 18Figure 9
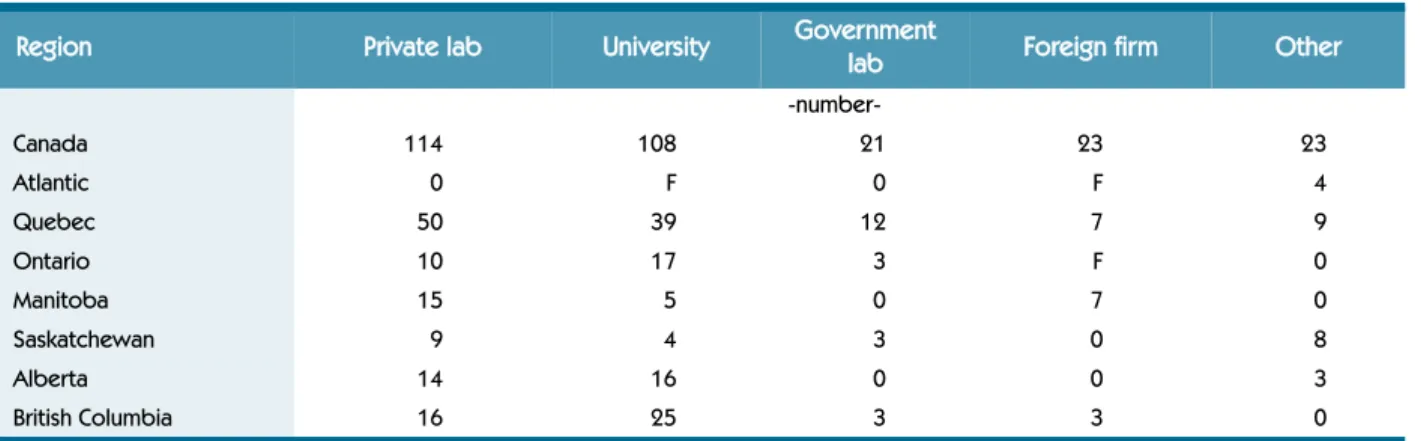
Number of firms which acquired by source of IP, by region, 2003 ... 19Figure 10
Percentage of firms with IP, by firm size, 2003 ... 20Figure 11
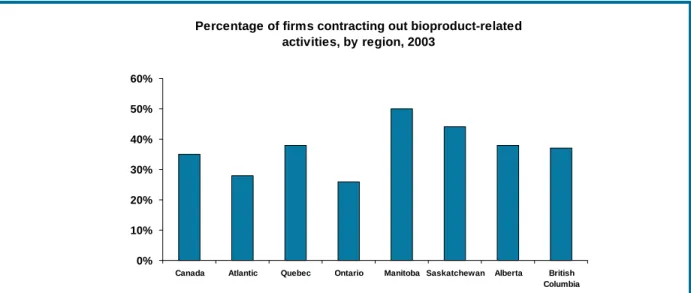
Percentage of firms contracting activities, by region, 2003 ... 22Figure 12
Contracting arrangements by partner type, 2003 ... 22Figure 13
Percentage of firms involved in collaborations, by region, 2003 ... 24Figure 14
Percentage of firms in collaborations, by firm size, 2003... 24Figure 15
Farm financing success, by firm size, 2003... 33Figure 16
Number of firms using different financing methods, by region, 2003 ... 35Figure 17
Degree of importance of factors related to efforts to fill bio-products-related employment vacancies, 2003... 43Bioproducts Development Survey: Analysis of the Summary Results xi
Foreword
Recent advances in information and communication technology (ICT), biochemistry and engineering are creating a new range of environmentally-friendly replacement products which can be made from agricultural and other renewable feedstock. Referred to as bioproducts, these products are biologically-based commercial or industrial products other than food, feed and medicines made with biological or renewable agricultural (plant or animal), marine or forestry materials.
In an effort to better define the size and structure of the bioproducts industry in Canada, Agriculture and Agri-Food Canada (AAFC) commissioned Statistics to conduct the Bioproduct Development Survey in 2004. This report analyses summary tables generated by Statistics Canada representing the responses to the survey questions provided for the year 2003 and provides a basis and benchmarks for future research into size, structure and activity of the Canadian bioproduct industry. It helps us better understand the drivers behind developing bioproducts, the challenges facing the industry and the gaps in knowledge that may require future research to enable the Canadian bioproducts industry to grow.
Overall, there were 232 bioproduct firms in Canada in 2003. Firms were predominantly situated in Quebec, Ontario, BC and Alberta with 82% of firms residing in these four provinces. While each region exhibited varying degrees of strengths and weaknesses, Quebec and Alberta were leaders on many dimensions (i.e. R&D, revenues, financing) while Atlantic Canada and Manitoba lagged behind the rest in several areas. Bioproduct development in Atlantic Canada appears to be behind the rest of the country with relatively low levels of research and develop-ment and limited success in accessing funding. Quebec, with the most firms in Canada, seemed to be highly successful in creating an environment where new firms could enter the sector and access knowledge and partnerships with universities and private firms as well as both public and private funding.
Firms were also organized according to firm size. In 2003, there were 154 small (< 50 employees), 40 medium-sized (5-149 employees) and 38 (> 149 employees) bioproduct firms. Small firms were in the process of developing/producing 574 bioproducts while medium and large firms had 222 and 252 bioproducts, respectively. Although small firms had the largest number of products, large firms averaged the largest number of products per firm (6.6), average total revenue per firm ($244,654) and average R&D per firm ($2,906).
Bioproducts Development Survey: Analysis of the Summary Results
xii
Bioproducts development is taking place in many different industries including fuels, bio-chemicals, bio-energy, bio-plastics and bio-fibres. In 2003, most bioproducts were developed/ produced in the field of bio-chemicals. Bio-chemicals accounted for 432 (41%) bioproducts with bio-fuels ranking second with 201 (19%) bioproducts. To develop these bioproducts, firms look to numerous sources of biomass to convert into new products. Biomass sources include agricul-tural, forestry, marine, animal manure and organic wastes. Agricultural biomass is the most pop-ular type of feedstock preferred by firms with 93 firms reporting the use of agricultural biomass in their operations. Forestry biomass ranked second with 77 firms using forestry products and byproducts as their preferred biomass.
As an emerging sector, bioproduct firms tend to be young with 65% of firms being involved in bioproduct development and production for less than 10 years. These firms have entered the sec-tor in different ways (i.e. start-ups, spin-offs, corporations extending their core activities) and usually maintain bioproduct development as only a portion of total firm activity. In 2003, nearly all firms became involved with bioproducts as either the result of internal R&D (66% of firms) or began as a spin-off from either universities or other firms (32%). Some firms devote all of their resources to bioproducts while other firms see bioproduct development as a complementary activity to already established operations. Overall, bioproduct activity accounted for less than one-third of total employees and one-quarter of total firm revenues.
This report examines additional characteristics related to bioproduct firms such as intellectual property (IP) rights, collaborative arrangements and provides in-depth coverage of regional/ provincial and size aspects. Because the analysis is based solely on tables provided by Statistics Canada, it has not allowed this report to go beyond surface level analysis but provides a basis and benchmarks for further research into the size and structure of the Canadian bioproduct industry.
Bioproducts Development Survey: Analysis of the Summary Results xiii
Executive summary
Bioproducts are non-food products developed from biomass originating from agricultural, food, forestry, marine and industrial and municipal sources. This report analyses the results of the first Canadian survey of bioproducts firms commissioned by Agriculture and Agri-Food Canada and conducted by Statistics Canada in 2004. This analysis is performed using summary tables of the responses to the survey questions provided by Statistics Canada. The summary tables were organized on two dimensions, by region/province and by firm size. Some of the key results of the analysis are presented by region and firm size in Summary Tables 1 and 2 respectively. For most of Canada’s 232 bioproducts firms, bioproducts are just one part of the business acti-vities, accounting for less than one third of employees and slightly more than one quarter of total firm revenue. Most firms (66 percent) entered the bioproducts business as a result of internal research and development. Only eighteen percent started as spin-offs, usually from universities (64 percent of spin-offs) or other firms (32 percent). The major benefits from bioproducts were new product/market opportunities, but environmental benefits and benefits related to product performance and production costs were also significant. Reducing energy was a low rated benefit from bioproducts except for large firms and firms in Atlantic Canada and B.C.
Capital was the most commonly cited factor limiting the expansion of bioproduct activities. Although financing was a challenge, only 47 percent of Canadian bioproducts firms took advan-tage of the Scientific Experimentation and Research Development Tax Credit program. Cost and timeliness of regulatory approval was the second most cited barrier to expansion and it ranked among the top three barriers in all firm sizes and all provinces except Manitoba and Alberta. A related issue, lack of product standards or certification, was relatively highly rated across Canada and for both small and large firms. Problems related to intellectual property, negative public perception or acceptance and human resources were generally not seen as major inhi-bitors to bioproducts expansion.
The importance of knowledge to the bioproducts sector was revealed in firm strategies. Acquir-ing industry knowledge was rated as the top knowledge management strategy across all firm sizes and five of the seven regions. Firms used a combination of internal and external know-ledge management strategies, accessing external knowknow-ledge from industry and research insti-tutions while at the same time promoting employee development. Quebec firms were more focused on intellectual property (IP) management and were the most successful at acquiring IP.
Bioproducts Development Survey: Analysis of the Summary Results
xiv
Summary Table 1 highlights some of the provincial differences. While each region exhibited strengths, Quebec and Alberta were leaders on many dimensions while Atlantic Canada and Manitoba lagged behind the rest on several measures. Bioproduct development in Atlantic Canada appears to be behind the rest of the country with relatively low levels of research and development and limited success in accessing funding. Quebec, with the most firms in Canada, seemed to be highly successful in creating an environment where new firms could enter the sector and access knowledge and partnerships with universities and private firms as well as both public and private funding. Although Ontario had the highest overall revenue from bioproducts, it lagged on several dimensions: attracting companies into bioproducts, developing new prod-ucts, securing IP, raising money and using government programs, relationships with other firms and expenditures on both general and bioproducts R&D. With the lowest percentage of firms entering the sector in the last five years and the highest percentage of public companies, Manitoba gives the impression of an older sector more focused on production than on generating new products and firms. Although Manitoba led Canada in average bioproducts R&D expendi-ture/firm, it was the least active region in terms of numbers of firms, total employment in the sector and reported IP assignments. Saskatchewan had many new entrants but with most firms starved for cash and having to lever their relatively small expenditures on R&D by being the most active collaborators with universities and other firms. Alberta bioproducts firms appear to be very well funded, active in product development and committed to bioproducts. R&D expen-ditures were the highest in Canada and bioproducts R&D was among the highest and they had the highest average number of products under development (5.4/firm) with almost two thirds on the market. Bioproducts employees per firm, revenue per firm and bioproduct revenue per firm were the highest in Canada, with most bioproduct revenue coming from exports. In terms of characteristics like product development, employment and revenue, B.C. was in the middle of the pack. Still, financing was a challenge, with much of 2003 funding coming from government sources.
For Canada’s 154 small bioproducts firms, bioproducts were a large proportion of their business, with a significant percentage of their employees and R&D targeted at bioproducts. They were more heavily involved in the development of early stage products, more likely to have IP and also more likely to export, with over 61 percent of bioproducts revenue from exports. Capital was the major barrier to expansion but surprisingly small firms that sought capital were more successful that their larger counterparts.
Of the 40 medium sized bioproducts firms in Canada in 2003, 37 percent were public and 44 per-cent were subsidiaries of multi-national corporations. Of their average of 98 employees, 69 were devoted to bioproducts and 70 percent of those were either scientists or technicians. They spent $1.5 million/year on R&D, but only 34 percent went into bioproducts. They had an average of 5.5 products/firm, with 74 percent of those on the market. They were the least likely to have bio-products IP (15 percent) and the least likely to be involved in collaborations (15 percent). Unlike small or large firms, medium sized firms secured the majority of their revenue from bioproducts. In general, large firms were involved in bioproducts as a minor sideline or supplement to their main businesses, often using by-products of their other businesses. Only 19 percent of employees were involved in bioproducts and 18 percent of their revenue came from bioproducts. They were more active in using forestry products and in developing bio-fuels. They are more likely to be public (60 percent) and foreign owned (40 percent) than smaller firms. They appeared to have significant difficulty raising money. Research and development expenditures were lower as a percentage of revenue than for smaller firms. Large firms spent almost $3 million on total R&D but only 21 percent was used for bioproduct development.
Bioproducts Development Survey: Analysis of the Summary Results xv
Executive summary
Summar y T able 1 : K ey Bioprod uct Fir m In dic ators by Re gi on (2003 ) Note: F indicates unreliable data
Ca teg or y Ca nada Atlantic Q uebec Ontario Ma nitoba Sask. Al be rt a B.C . Nu mber o f F irm s 23 2 15 72 53 9 18 27 38 Fir m Charac teri sti cs % < 5 ye ar s in BP % Publ ic companies A vg . # of e m plo yee s/ BP emp. % BP em ploy ee s 34 .6% 29 .3% 105 /3 4 32 .5% 21. 2% 18. 9% 262/15 5. 8% 42. 7% 20. 9% 83/3 5 41. 7% 30 .0 % 24 .5 % 77 /39 50 .7 % 29. 0% 65. 1% 108 / 32 29. 5% 39 .4% F 157 / 12 7. 7% 39 .6% 43 .9% 96 / 40 41 .6% 24. 5% 45. 0% 10 0/39 39. 4% En tr y in to b io p ro duct s % from in te rn al R & D 65 .9% 49. 6% 73. 2% 65 .9 % 34. 4% 84 .8% 42 .8% 72. 5% Biom ass Use: To p 3 Bi oma ss So ur ces :% primar y/ % by -prod. Ag/F/Other 46/47 F/Ag/ Food 61/22 Ag /F/ Mari ne 46 /4 7 Ag /F/ Ot he r 43 /5 2 Ag ma inly 50 /45 Ag/ Ma nu re /F 47 /5 3 Ag/F/Other 58 / 43 F/Ag/F ood 37 /5 1 Re venue ($ 000): A ver ag e to ta l/fi rm A ver ag e % fr om B P % BP re v. fr om ex por t $ 5 1, 560 26 .4% 47 .5% $ 26, 966 F F $ 32 ,50 4 33. 5% 30. 8% $ 5 2,6 66 31 .2 % 48 .5 % $ 43 ,38 5 32. 5% 59. 0% $ 85 ,77 5 6. 5% 78 .4% $ 105 ,49 2 21 .9% 80 .6% $ 43, 243 38. 6% 27. 1% R & D ($ 000): A ver ag e R& D/f irm A ver ag e BP R & D/fi rm Av g. # o f B Ps u nd er devel opme nt/fi rm % on m arke t $ 1 ,03 3 $ 4 03 4.5 60 .3% $ 288 $ 33 3. 0 71. 8% $ 1, 32 7 $ 57 2 5. 1 54. 1% $ 6 74 $ 3 09 3.2 70 .4 % $ 1, 58 9 $ 64 0 F F $ 562 $ 206 4.9 54.2% $ 1 ,92 2 $ 5 26 5.4 65 .6% $ 736 $ 310 4. 5 59. 1% Financing - % se eking fi nancing - A vg. rai sed/f irm s eeki ng ($00 0) 53. 6%$ 2,21 8 39. 2% $ 407 61. 4% $ 2, 86 4 53 .2 % $ 7 00 34. 8% $ 2, 35 1 49 .9% $ 176 47 .9% $ 7 ,13 3 55. 0% $ 1, 221 IP % fi rm s wi th IP 30 .5% 28. 5% 43. 0% 23 .0 % 32. 9% F 27 .9% 30. 2% Co llabor ati ons - % wi th c oll aborations - M ain co lla b or at io ns 35 .7% Non-bioP 39. 1% No n-bi oP 41. 4% Academic 24 .1 % Non-bioP 34. 4% F 57 .9% Bio P/ Academic 37 .1% No n/ b ioP 28. 8% Academic St rat egie s - To p knowledge dev . - To p bu si ne ss st ra te gy Ac quire Ind. Kn ow . Ne w R&D Ac quire Ind. Kn ow . Ne w R & D Pu b. Kn ow /IP Au d it New R&D
Acquire Ind. Kno
w . Tr ia ls /N ew R & D St aff E d uc . Tr ials Acquire Ind. Know . T rial s Acqui re In d. Kn ow . New R&D Ac quire Ind. Kn ow . Tr ia ls /R & D Benefits – T op tw o iden tifi ed (P M = P ro d uc t/Mar ket ) Sal es/ Ne w PM Env . Im pact/ Ne w P M New PM / Sal es New PM / Env . Im p act Sal es/ New PM New PM / Env . Im p act New PM/ Sales Env . I m pact/ Pr od ’n cos t Bar rier s – To p tw o iden tifi ed Capi tal /R eg. approv al Re g. approv al/ Capi tal Re g. approval / Capi tal Capi tal /R eg. approval Tr an sp or -tat io n/ Pr ic e of M at’ l Capi tal /Pr ice of M at’ l Ca pit al/P rice of M at’ l Capi tal /R eg. approval
Bioproducts Development Survey: Analysis of the Summary Results
xvi
Summary Table 2: Key Bioproduct Firm Indicators by Firm Size (2003)
Firm Size
Category Small Medium Large
Number of Firms 154 40 38
Firm Characteristics
% less than 5 years in bioproducts % Public companies
# of employees/ # BP employees % Scientific R&D or Technicians
42.6% 19.8% 14 / 11 77.7% 17.4% 37.1% 98 / 69 70.4% 17.8% 60.1% 476 / 89 18.8% Entry into bioproducts
% as a result of internal R&D 72.0% 47.1% 60.4%
Biomass Use:
Top Three Biomass Sourcesa
Source:% primary/ % by-product
a. Ag: Agriculture, F: Forestry, Ind – Industrial Organic Waste Ag/F/Other 48%/46% Ag/F/Marine 44%/48% F/Ind/Ag 40%/53% Revenue ($ 000): Average total/firm Average % revenue from BP % BP revenue from exports
$ 6,026 45% 62% $ 43,429 63% 53% $ 244,654 18% 41% Research and Development ($000):
Average R&D/firm
Average bioproduct R&D/firm
$ 444 $ 321 $ 1,517 $ 512 $ 2,906 $ 618 Average # of BP under development/
firm (% on market) 3.7 49.5% 5.5 72.3% 6.6 74.5% Financing - % seeking financing
- Avg. raised/firm seeking ($000)
60.4% $2,468 45.0% $2,539 31.6% $1,441 Intellectual Property
- % of firms with IP rights 35.8% 15.0% 24.9%
Collaborations - % with collaborations - Main collaborations 42.8% Non-BP 15.0% BP 28.9% Academic Strategies
- Top knowledge development - Top business strategy
Acquire Ind. Know. New R&D
Acquire Ind. Know. Trials
Acquire Ind. Know. New R&D Benefits
– Top two identified New PM/ Sales Improve Value performance/ Sales Env. Impact/ Prod’n costs Barriers
– Top two identified
Capital/regulatory approval Price of material/regulatory approval Price of material/ transportation
Bioproducts Development Survey: Analysis of the Summary Results xvii
Introduction
Canada, like many other countries, has been actively developing bioproducts and promoting the companies behind them. To better understand the Canadian bioproducts sector, Agriculture and Agri-Food Canada (AAFC) commissioned Statistics Canada to undertake the first national bioproducts survey in the world. The survey was based partially on the Biotechnology Use and Development Surveys administered by Statistics Canada every two years. The Bioproducts Development Survey was administered in 2004 with firms required to answer questions and report results based on their 2003 data.
This report is the first examination of the results of the survey. The data for this report was provided by AAFC from tables supplied by Statistics Canada. Data was provided in the form of tables summarizing responses to the survey questions by province and by firm size; small, medium or large1. The analysis which follows is based on those two methods of classifying the data. Unless noted, all data in this report was derived from the results of the Bioproducts Devel-opment Survey. The data captured in the survey and reported in this paper is 2003 firm data, unless otherwise noted. The limitations on the analysis are discussed in the following section. The report is organized into key sections as follows. The first section discusses the limitations imposed by the data used in the study. This is followed by an overview of the analysis and summary of the key results of the study, which is designed to act as a stand-alone document. The overview reports common themes found in the results and some of the most significant differences between provinces and firm sizes. Next, the main body of the report begins with an examination of the structure of the Canadian bioproducts sector and the firms in the sector. The second section examines the products being developed and the use of biomass by firms in the sector. Succeeding sections examine bioproducts revenue and the factors that play a role in revenue and expenditures, intellectual property, contracts and collaborations, human resources. These are followed by an analysis of benefits from and barriers to bioproducts development and commercialization. The next section considers an analysis of the business strategies used by bioproducts firms. The final section includes concluding remarks examining the differences between provinces, suggestions for improvements to the survey instrument and recommen-dations for further analysis.
Bioproducts Development Survey: Analysis of the Summary Results xix
Limitations
This report is intended to provide an initial analysis of the bioproducts sector using data tables provided by Statistics Canada. All tables and figures in this report are derived from the Bioproducts Development Survey and contain responses based on 2003 activity and the summary tables provided by Statistics Canada. The authors had no access to the original survey data. In cases where data was deemed by Statistics Canada to be unreliable, the data in question was replaced with an F. If data was deemed to possibly compromise the confidentiality of a firm the data was withheld and replaced with an x.
The data analyzed in this report was organized and reported on two dimensions. The first is regional, with data provided for the Atlantic provinces as a single region and for each of the remaining six provinces individually. The second categorization is by firm size, measured by the number of employees. Firms are classified as small (less than 50 employees), medium (50-149 employees) and large (more than 149 employees). For this initial analysis, data was not provided on any other dimension and so the analysis necessarily is performed on these two dimensions. The presentation of the data also prohibited analyzing on the two dimensions simultaneously. It is therefore not possible to analyze the number of firms of each size in an individual region. The authors had no access to the underlying survey results and could not perform any additional analysis beyond the two dimensions provided. It is the intention of AAFC to perform a more in-depth analysis in the future, but that is beyond the scope of the data provided. This analysis reveals that the survey has provided a rich data set for a more in-depth analysis of the bio-products sector.
Bioproducts Development Survey: Analysis of the Summary Results xxi
Overview of the Bioproducts
Development Survey Results
The survey studied bioproducts use and development in Canada. For the purposes of the survey bioproducts were defined as those products which were derived from biomass, specifically biomass from agricultural crops, forestry, marine & aquaculture, food processing, animal manure, industrial and municipal organic waste. In 2003, the bioproducts sector in Canada exhibited striking regional differences on some dimensions but similarities on others. Some of the key characteristics of Canadian bioproduct firms are identified by region in Summary Table 1, and by firm size in Summary Table 2.
Common Themes in the Canadian Bioproducts Sector, 2003
Bioproducts are just one part of firm business activities and the proportion decreases with firm size - The first observation is that, in general, bioproducts was just one part of the business activ-ities of most of the 232 Canadian firms involved in bioproducts in 2003. Canadian bioproducts firms had less than one third of their employees involved in bioproducts and derived just over one quarter of their revenue from bioproducts activities. Almost half of firms secured their inputs from by-products and most of the rest as primary products purchased as inputs.
Bioproduct firms generally entered the business as a result of internal R&D - Almost two thirds of firms (66 percent) entered the bioproducts business primarily as a result of internal research and development. Only 18 percent entered as spin-offs, primarily from universities (64 percent of spin-offs) or other firms (32 percent). The benefits firms received from involvement in bioproducts varied significantly. The most common dealt with new product/market opportu-nities, however firms also secured environmental benefits and other benefits related to product performance and production costs. Except for Atlantic Canada and B.C., reducing energy was a low-rated benefit from bioproducts. However, the recent increase in energy costs will almost certainly increase both the interest in the development of bio-energy products and focus of companies toward bioproducts as a means of reducing energy costs. This benefit was relatively important only for large firms. Thus, there are many reasons for firms to enter the bioproducts business and there is no obvious single motivation which can be used to promote the bioproducts business in general.
Bioproducts Development Survey: Analysis of the Summary Results
xxii
Barriers to expansion include capital, particularly for small firms, regulation and access to personnel - The factors limiting the expansion of bioproduct activities are relatively consistent across Canada, with capital as the most commonly cited barrier and difficulties related to regula-tory approval second. A closer look at data by size reveals that the dominance of capital is related to the number of small firms in the survey. Access to capital is the major barrier for small firms, who make up 66 percent of the population, but is less important for large ones. However, cost and timeliness of regulatory approval was among the top three barriers in all firm sizes and all provinces except Manitoba and Alberta. Although not among the top barriers mentioned, the related issue of lack of product standards or certification was relatively high-rated across Canada and for both small and large firms. It was not seen as a barrier by medium sized firms.
One interesting finding regarding financing was that survey respondents generally did not make good use of the Scientific Experimentation and Research Development Tax Credit program. Across Canada the average participation was only 47 percent with smaller firms slightly more likely to participate than larger firms.
Also of interest are the factors that were not cited as barriers – problems related to intellectual property, negative public perception or acceptance and human resources were not seen as major inhibitors, except for Alberta and B.C. firms who rated human resources as a moderate barrier. The final area of similarity across firms and provinces related to firm strategies. Acquiring indus-try knowledge was rated as the top knowledge management strategy across all firm sizes and six of the seven regions. Firms used a combination of internal and external knowledge management strategies, accessing external knowledge from industry and research institutions while at the same time promoting employee development.
Provincial Differences
A glance at Summary Table 1 shows that the differences between provinces are significant in most sector indicators. Some areas of the country, particularly Quebec, Alberta and British Columbia seem to be more successful in developing active, successful and growing bioproducts sectors, while others have had more difficulty. The differences highlighted here are discussed in more detail in the main body of the report.
Atlantic Canada
It appears likely that many of the bioproducts firms in Atlantic Canada are large forestry and food companies which include bioproducts as one small part of their overall business. Atlantic firms lead Canada in the number of firms using both forestry and food processing by-products. Interestingly, 60 percent of Atlantic firms produce bioproducts as primary products and almost half of firms use them internally. Both of these are significantly higher than the proportions for firms in other provinces. Few companies have entered the bioproducts business recently; only 21 percent in the last five years.
Since bioproducts is of lesser business importance Atlantic firms trail behind those of other regions on almost every dimension of bioproduct business development. Although the fifteen firms in the region are the largest in terms of employment, they have the lowest average total revenue of any region in Canada and the lowest percentage of bioproduct employees per firm. Both general research and development and bioproduct research and development expenditures lag significantly behind those of other regions. Average bioproduct R&D of $33,000 per firm is
Bioproducts Development Survey: Analysis of the Summary Results xxiii
Overview of the Bioproducts
Development Survey Results
inadequate to maintain a significant bioproduct development presence. The fact that the firms are in other businesses could explain the low percentage seeking financing, but those who sought financing raised an average of only $407,000 per firm. Relatively few are public compa-nies (19 percent), eliminating one potential capital source for most firms.
Quebec
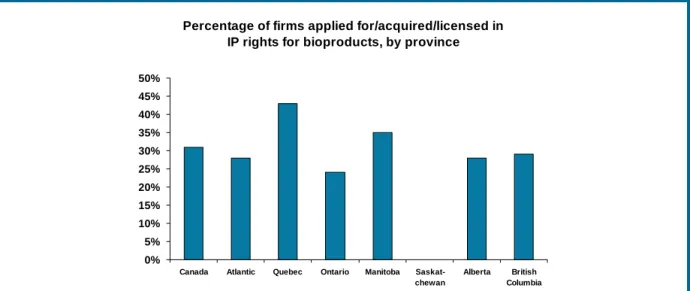
Based on the data in this survey, Quebec is the leading province in new bioproduct develop-ment. The province has attracted many young firms to the bioproducts business, with 43 percent of firms having entered in the last five years. The province was also home to 45 percent of Canadian bioproduct spin-off companies, including the most new university and company spinoffs. Quebec firms had the second highest proportion of staff dedicated to bioproduct activ-ities, the highest average number of products under development (5.1) and the highest percent-age of firms with IP (43 percent). The latter reflects the very high emphasis that Quebec firms place on intellectual property (IP) and the significant investments in bioproduct R&D. Quebec was the only province where IP audits were viewed as one of the top knowledge management strategies. Quebec firms appear to be heavily involved in early stage development, and they had the lowest percentage of products on the market.
Numerous studies have shown the importance of intellectual property in securing funding in the field of biotechnology. In the bioproducts industry the importance placed on IP may be one explanation for the success of Quebec firms in securing financing and the fact that they raised the second most funding per firm seeking financing. Firm revenues were lower on average in than most provinces, as was the percentage of bioproduct exports, likely reflecting the younger age of the companies.
Accessing outside skills was important for Quebec firms, who had high levels of both collabora-tions and contracts with private laboratories and universities. Of all bioproduct contracts in Canada, 38 percent involved Quebec firms.
Ontario
Ontario firms were heavily involved in the use of agricultural crop biomass, with over half of their inputs coming as by-products. Bioproducts were important to the province; firms in Ontario saw $871 million in bioproducts revenue, the highest in Canada. However, with the exception of products on the market, bioproduct employees and average revenue/firm, Ontario firms lagged behind Quebec on many indicators of bioproduct activity. Ontario had difficulty attracting new companies into the field and the companies in the business were not as active in developing products (3.2/firm), securing IP (23 percent) or raising money, securing less than 25 percent of the amount raised by Quebec firms. Ontario firms spent considerably less on general R&D and bioproducts R&D than other organizations and they had the lowest percentage of firms contracting out activities and involved in collaborations in Canada. The proportion of Ontario firms pursuing government funding was significantly below the national average. Overall, Ontario firms were less active than firms in most provinces in both internal and collabo-rative bioproduct development. The focus of Ontario firms was much more on producing products for sale to outside organizations, with only 19 percent of firms producing for internal use.
Bioproducts Development Survey: Analysis of the Summary Results
xxiv
Manitoba
Looking at Manitoba, one gets the impression of an older sector more focused on production than on generating new products and firms. The province had the lowest percentage of firms entering the sector in the last five years and the highest percentage of public companies. It was the least active region in the bioproducts sector in terms of numbers of firms, total employment in the sector and reported IP assignments. There were relatively few products in the research and development stage but Manitoba firms appear to have the highest percentage of products/firm in production or on the market in Canada. All the firms in Manitoba used agricultural biomass. However, firms in the province are in the mid-range of both total and bioproduct revenue. It is somewhat paradoxical that they are were the top end of R&D expenditure per firm and led Canada in average bioproducts R&D expenditure per firm. Although Manitoba had relatively few firms in the sector, those which were present appeared to be committed to bioproduct devel-opment.
Saskatchewan
New firms were entering the Saskatchewan bioproducts sector at a fair rate. Approximately 40 percent entered within the last five years and the province’s 3 spin-offs come from other companies. Internal R&D spurred entrance into the sector for 85 percent of companies in the region. Saskatchewan firms were actively using agricultural biomass, and made the greatest effort of all regions to use animal manure. Saskatchewan firms were slightly above average in terms of products under development or production but they raised the least capital to fund that development. Spending on both general and bioproduct R&D was below all regions except Atlantic Canada. The firms were the most active in collaborating with other organizations and second most active in contracting. Although average revenue/firm was second in Canada, bioproducts revenue was lowest and their spending on general R&D and bioproducts R&D was the second lowest in Canada. They seemed to lever their R&D effort by collaborating heavily with organizations of every type resulting in relatively high numbers of products under devel-opment, albeit at the earlier stages than in most provinces. Continued sector development in Saskatchewan will be constrained by the lack of capital.
Alberta
Alberta bioproducts companies appear to have been well funded, active in product development and committed to bioproducts. They had the highest average number of products under devel-opment (5.4/firm) with almost two thirds on the market. Biomass inputs came from several sources (notably agriculture, forestry and other sources) and most of the biomass was trans-ported from distances of more than 50 km. Bioproducts employees per firm, revenue per firm and bioproduct revenue per firm were the highest in Canada, with most bioproduct revenue coming from exports. R&D expenditures were the highest in Canada and bioproducts R&D was among the highest. Alberta firms could afford to spend more since, on average, firms seeking funding raised over $7 million each in 2003, two and a half times the funding of the next closest province (Quebec). Interestingly, low levels of IP did not seem to hamper attempts to raise money. Most of the money raised came from private placements and IPO’s rather than from government sources. There is nothing in the data to indicate that Alberta will slow down and the recent surge in energy prices will only enhance the province’s role in the sector.
Bioproducts Development Survey: Analysis of the Summary Results xxv
Overview of the Bioproducts
Development Survey Results
British Columbia
B.C. is very active in the bioproducts field, with a mix of young and older companies. Of no surprise is the fact that B.C. biomass came predominantly from the forestry products, with 64 percent either by-products or recycled product. In many respects it was in the middle of the pack in terms of characteristics like product development, employment and revenue. However, in some areas the province appeared to be somewhat behind. Financing was a challenge, with much of 2003 funding coming from government sources but the rest coming from a mixture of private sources. B.C. firms were second only to Quebec firms for total funding secured through the SR&ED tax program. Both general and bioproduct R&D expenditures were below the Canadian average but the number of products under development was typical. B.C. firms are less active in collaborating with other organizations.
Firm Size Differences
The companies involved in bioproducts in Canada were also analyzed by firm size with firms classified by the number of employees: Small (1-49 employees), Medium (50-149 employees and Large (more than 149 employees). A summary of key results by firm size is presented in Summary Table 2.
Small firms
Canada’s 154 small bioproducts firms made up two thirds of the firms in Canada but with just over 14 employees each they employed only 9 percent of the workers employed by the 232 firms and just 22 percent of bioproducts employees. However, 77 percent of their bioproducts employ-ees were scientists and technicians. They tended to be private (80 percent) and Canadian owned (92 percent). They were more involved in the development of early stage products and in the development of all products except bio-fuels. Rather than using their own by-products they usually had to secure raw materials from a distance and use foreign sources more than other categories.
Total revenue per firm was roughly $6 million per year, of which 45 percent came from bioproducts. These small firms were active exporters with over 61 percent of bioproducts revenue from exports. Although total R&D expenditure of $444,369 was lower for small firms, bioproduct R&D expenditure was only half the level of large firms. These companies spent 72 percent of their R&D dollars on bioproducts. Small firms were much more likely to have rights to IP than larger firms but only 35 percent of them had such rights.
Most entered the sector as result of internal R&D. The vast majority (86 percent) of the bio-product spin-off companies were small firms. Small firms supplemented their internal develop-ment capabilities by working with other firms and research institutions to take advantage of industry knowledge. Collaborations were utilized by 43 percent of firms. As in other industries, money is a major barrier to expansion; 60 percent of firms sought capital and $1.36 million was raised on average. Of the 154 firms 30 secured funding from government grants, 24 from venture capitalists and 24 from angel investors, while another 25 obtained funding from private place-ments and initial public offerings. Bank loans, government loans and matching funding programs were far less important.
Bioproducts Development Survey: Analysis of the Summary Results
xxvi
Medium Firms
There were only 40 medium sized bioproducts firms in Canada in 2003. Of these firms 37 percent were public and 44 percent were subsidiaries of multi-national corporations. The firms averaged 98 employees with 69 devoted to bioproducts (70 percent of which were either scientists or technicians). With their larger resources they have more products under develop-ment (5.5/firm) and had 72% of those products already on the market. They spent $1.5 million on R&D but only 34 percent was allocated to bioproducts. They were the least likely to be involved securing rights to bioproducts IP (15 percent) and the least likely to be involved in collaborations (15 percent).
Medium sized firms were the most active users of agricultural crop biomass (54 percent) but many used forestry biomass (30 percent). They were more likely to sell directly to consumers (78 percent) and to other firms (71 percent) with only 22 percent using the products internally. These firms had significant business activity in bioproducts. On average their revenue was seven times that of small firms at over $43 million per firm, and 63 percent came from bio-products. Their main strategies focused on increasing revenue, particularly through entering foreign mar-kets. They perceived significant benefits from bioproducts in terms of both improved value and performance and in increased sales.
Only 45 percent of medium-sized firms looked for money, and they raised less than small firms from matching funds (15), collaborations (6) and grants (5) and banks (5). They also received nearly as many credits under the Scientific Research & Experimental Development tax program as large firms, averaging $2.3 million per firm. The firms used their funding primarily for R&D and proof of concept studies.
Large Firms
In general large firms were involved in bioproducts as a minor sideline or supplement to their main business and their responses to survey questions repeatedly reflected that fact. Being larger they are more likely to be public (60 percent) and foreign owned (40 percent) than smaller firms. Forestry companies figure prominently among large firms with 70 percent securing forestry biomass compared to 30 percent and 25 percent for medium and small firms. They dominated small and medium firms in the development in bio-fuels. Over half of large firms used by-products in their processes and they sourced much of their biomass on site or nearby. Revenue was significantly higher than in other classes ($245 M/firm). Only 18 percent of their revenue came from bioproducts with 41 percent of that from exports. Although large firms had relatively more revenue, 31 percent still sought financing; however, they appeared to have substantial dif-ficulty raising money, securing far less than smaller firms. Few obtained more than half of their target. The average of $485,000 secured/firm was less than half that of medium firms, and barely over one third of the average amount typically raised by small firms which sought financing. Money came primarily from matching funds (8), banks (3) and grants (3). Most sought funding to increase production capabilities (91 percent) or to further production development through R&D and proof of concept studies (76 percent).
The firms averaged 476 employees per firm with 19 percent devoted to bioproducts. They have significantly more production/management employees but only twice the scientific and tech-nical employees per firm that small firms have. Research and development expenditures were lower as a percentage of revenue than for smaller firms. Large firms spent almost $3 million on R&D but only 21 percent of that was used for bioproducts.
Bioproducts Development Survey: Analysis of the Summary Results xxvii
Overview of the Bioproducts
Development Survey Results
Policy Implications
The different strategies and challenges of firms from different size and regions generally neces-sitates distinct policies to promote bioproducts among Canadian companies. However, the common themes point out some reasonable starting points at the national level.
One pressing issue identified was the time and cost associated with the bioproduct approval process. This was a challenge to firms across regional and size categories. It is worthwhile inves-tigating why this issue was raised so regularly and what can be done to improve the situation. One aspect of any review should deal with product standards and certification since this could be one factor in the regulatory approval process.
Addressing the lack of capital is a different matter since it involves small firms in a new technol-ogy area. While individual programs may be targeted at the bioproducts sector, programs aimed at promoting new technologies in general may help to create an environment conducive to the creation of new companies in a variety of technology sectors. Capital supplies are imping-ing on the ability of firms to attract highly qualified personnel. Although firms did not identify human resources as a major barrier, when asked about difficulties in filling positions, the impact of capital restrictions on small firms became apparent - lack of capital was cited as the main reason for not filling positions across Canada.
A related issue is the relatively low uptake and variability of government support programs. Just under half of firms used the Scientific Research and Experimental Development tax credit programs and roughly one third accessed both federal and provincial support programs. Frequency was inversely related to firm size, with smaller firms taking greater advantage of the programs across a broader range of activities. The differences by region were huge with Quebec the leading user of programs and Alberta firms least likely to access support. One obvious conclusion is that different approaches are required depending on whether the target is promo-tion of bioproducts development in large firms or increasing the number and success of small bioproducts firms focused on developing new bioproducts. Large firms incorporate bioproducts into their existing businesses for environmental, cost and market reasons; therefore, such a move must make sense on those terms. Support programs that promote such developments would have an impact. Small firms build a major portion of their business on bioproducts and commit a significant percentage of their scientific development resources to those products. They tend to require and use assistance in every area from technology development to loan guarantees and training since a lack of both financial and personnel resources are significant factors limiting their development.
From a provincial perspective, further analysis would allow for better understand of the differ-ences and would be an essential input to the policy creation process. The obvious starting points would be a regional analysis cross-tabulating firms by location, product line and size to better understand the composition of the regional sector and the challenges facing the region.
The Canadian Bioproducts Development Survey - 2003 - Analysis of the Summary Results xxix
Detailed Analysis of the
Bioproduct Development
Survey Summary Tables,
2003
Bioproducts Development Survey: Analysis of the Summary Results 1
Chapter 1
Canadian Bioproducts Businesses
Two hundred and thirty-two firms across Canada participated in the production or development of bioproducts during 2003. Quebec, Ontario, and British Columbia are home to most of these companies; 31 percent, 23 percent, and 16 percent respectively of all firms were located in these provinces (Figure 1). Revenue for these firms in 2003 totaled just under $ 12 billion. However, bioproducts revenue was just over $ 3 billion and 47 percent of the bioproducts revenue was from exports of bioproducts.
Figure 1: Bioproducts firms by province, 2003
The bioproducts sector is dominated by small firms, at least in terms of numbers. Approximately 66 percent are small in size with less than 50 employees. Of the remaining firms 17.2 percent were medium sized with 50 – 149 employees, and 16.4 percent were large firms with more than 149 employees.
Percentage of respondents by province, 2003 M anitoba 3.7% Saskatchewan 7.8% Albe rta 11.7% Ontario 22.7% Quebec 30.9% Atlantic 6.6% British Columbia 16.5%
Bioproducts Development Survey: Analysis of the Summary Results
2
Chapter 1
Many of the firms surveyed have been in the business of bioproducts for a relatively short period of time. Sixty-five percent have been involved in bioproduct-related activities for 10 years or less. Quebec, Alberta and Saskatchewan appear to have created environments conducive to the creation of new bioproducts firms. Forty-two percent of Quebec firms are five years old or less, and about thirty-nine percent of firms in Alberta and Saskatchewan are in that category (Table 1). In all other regions in Canada less than thirty-five percent of firms are five years old or less.
The proportion of firms under 10 years of age was markedly higher for small firms (75 percent) and lower for large firms (36 percent). Nearly half of large firms reported involvement in the sector for over 20 years.
Entry into the Bioproducts Sector
Approximately 19 percent of Canadian bioproducts firms originated as spin-offs (Table 2). Not surprisingly, most are small (86 percent), a few are medium (14 percent) in size and none were large. The vast majority originated from either universities (64 percent) or other firms (32 percent). Quebec had the largest share of spin-off companies, with 20 of the 44 Canadian bioproducts spin-offs. Eight of those companies have been spun out of another firm rather than out of universities, representing 57 percent of all Canadian spin-offs from companies. The results regarding company spin-offs display significant regional differences. Alberta and Ontario spinoffs are almost exclusively from universities, while Saskatchewan and British Columbia’s small number of spin-offs came solely from other firms. Government agencies did not figure prominently in bioproduct company spin-offs.
Although spin-offs are an important means of creating new bioproducts firms, most companies entered the bioproducts field as the result of internal company research and development, as illustrated in Figure 2. Other entry methods were far less frequent.
Table 1: Number of years of involvement in bioproducts, 2003
Region Number of firms 10 years or less 5 Years or less
# % % Canada 232 65.1 34.5 Atlantic 15 60.0 20.0 Quebec 72 77.8 43.1 Ontario 53 58.5 30.2 Manitoba 9 33.3 33.3 Saskatchewan 18 61.1 34.5 Alberta 27 74.1 40.7 British Columbia 38 55.3 23.7
Bioproducts Development Survey: Analysis of the Summary Results 3
Canadian Bioproducts Businesses
Figure 2: Initial entry to the bioproducts sector, 2003
Ownership
Ownership among Canadian bioproducts firms varies with location (Table 3) and company size (Table 4). Bioproducts firms in Manitoba, Alberta and B.C. are much more likely to be public companies than those in other provinces. Only Manitoba has a relatively high proportion of foreign owned companies compared to the other regions.
Table 2: Number of firms by origin of spin-off, 2003
Region Total number of spin-offs
Percentage of all Canadian
spin-offs University Another firm
Government agency/ laboratories Other # % # # # # Canada 44 28 14 F F Atlantic F 0 0 0 F Quebec 20 45.5 11 8 F 0 Ontario 10 22.7 9 1 0 0 Manitoba 0 0 0 0 0 Saskatchewan 3 6.8 0 3 0 0 Alberta 7 15.9 7 0 0 0 British Columbia F 0 F 0 0
Canadian firms by means of initial involvement in bioproduct activities 0% 10% 20% 30% 40% 50% 60% 70% Mainly as a result of activities of your firm (R&D project)
In co-operation/ collaboration w ith other firm s or organizations Merger w ith/acquisition of another firm Purchase of another firm 's bioproducts developm ent activities Other
Bioproducts Development Survey: Analysis of the Summary Results
4
Chapter 1
Large firms are far more likely to be public companies, and more likely to be foreign owned. Although only 18 percent of firms are subsidiaries of multi-national corporations (MNC’s), this increases to 44 percent for medium sized firms. Canadian ownership is highest among small and medium sized firms with non-U.S. firms owning the majority of non-Canadian bioproducts companies. However, among large companies U.S. ownership is quite high at 28 percent.
Table 3: Ownership of Canadian bioproducts firms, by region, 2003
Region Total number of firms
Percentage of firms which are public Percentage of firms which are subsidiaries of MNC’s % of firms with majority Canadian stock ownership % of firms with majority U.S. stock ownership % of firms with majority other stock ownership # % % % % % Canada 232 29.3 18.1 83.6 9.1 6.5 Atlantic 15 18.9 - 93.3 - 0.0 Quebec 72 20.9 9.7 87.5 6.9 2.8 Ontario 53 25.6 24.5 83.0 7.5 9.4 Manitoba 9 65.1 33.3 66.7 33.3 0.0 Saskatchewan 18 - - 88.9 - 0.0 Alberta 27 43.9 29.6 70.4 11.1 18.5 British Columbia 38 45.0 21.1 84.2 7.9 7.9
Table 4: Ownership of Canadian bioproduct firms, by firm size, 2003
Firm size (# of
employees) Total number of firms
% of firms which are public % of firms which are subsidiaries of MNCs % of firms with majority Canadian stock ownership % of firms with majority U.S. stock ownership % of firms with majority other stock ownership # % % % % % Small (< 50) 154 19.8 8.0 91.9 3.9 5.2 Medium (50-149) 40 37.1 44.0 74.1 10.5 13.8 Large (>149) 38 60.1 31.5 60.3 28.1 6.8
Bioproducts Development Survey: Analysis of the Summary Results 5
Chapter 2
Bioproduct Development and
Biomass Use
Bioproduct Development
Canadian firms are actively developing and producing a variety of bioproducts. In 2003, the firms had a total of 1,048 products under development or in production, an average of 4.5 products/firm. Of these, 60 percent were already on the market, 18 percent were mid-deve-lopent, and 22 percent were in early stages. The largest category of products was bio-chemicals, which made up 41 percent of all bioproducts (Figure 3).
Figure 3: Bioproduct development by product type, 2003
Total number of bioproducts under development, by type 0 50 100 150 200 250 300 350 400 450 500
Bio-fuels/bio-energy Bio-chem icals
Biopesticides/bio- fungicides/bio-herbicides
Fiber com posites/ fiberboard/agri-fiber panels Bio- sensors/biocatalysts/bio-plastics/other Bio-sensors/ biocatalysts/ bio-plastics/other Bio-fuels/
bio-energy Bio-chemicals bio-fungicides/Biopesticides/ bio-herbicides
Fiber composites/ fiberboard/ agri-fiber panels Total number of bioproducts under development,
by type 0 50 100 150 200 250 300 350 400 450 500
Bio-fuels/bio-energy Bio-chem icals
Biopesticides/bio- fungicides/bio-herbicides
Fiber com posites/ fiberboard/agri-fiber panels Bio- sensors/biocatalysts/bio-plastics/other Bio-sensors/ biocatalysts/ bio-plastics/other Bio-fuels/
bio-energy Bio-chemicals bio-fungicides/Biopesticides/ bio-herbicides
Fiber composites/ fiberboard/ agri-fiber panels
Bioproducts Development Survey: Analysis of the Summary Results
6
Chapter 2
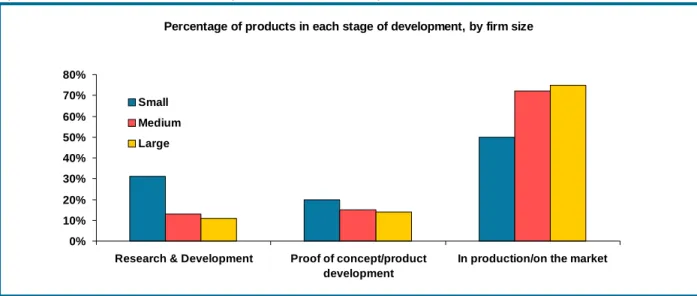
As one would expect, small companies were more focused on the early stages of research and development than the larger firms (Figure 4). In any technology development process there are typically more products in the early stages of development and much of the research and devel-opment and proof of concept work is done in small firms. As products are developed, many are trimmed as they are found to be infeasible or to have no technological or commercial advantages over existing products. Medium sized and large companies have the resources to produce and market a limited number of commercial products so they dominate the last stage of develop-ment. It is interesting to note that in the bioproducts sector more products are on the market than in development.
Figure 4: Product development by stage shown as a percentage of total products under development
With one exception, product development patterns were fairly consistent across all product types with small firms having the largest number of products under development. The exception is in bio-fuels/bio-energy products where the largest number of products is under development in large companies and 43 percent of large firms were engaged in the production of biofuels/ bioenergy. This was more than double the number of large firms producing any other single product type (Figure 5). This result reflects the nature of the chemical and energy businesses, which are dominated by large companies with significant resources
.
Percentage of products in each stage of development, by firm size
0% 10% 20% 30% 40% 50% 60% 70% 80%
Research & Development Proof of concept/product development
In production/on the market Small
Medium Large
Bioproducts Development Survey: Analysis of the Summary Results 7
Bioproduct Development and Biomass Use
Figure 5: Bioproduct development by product type and firm size, 2003
Biomass Use
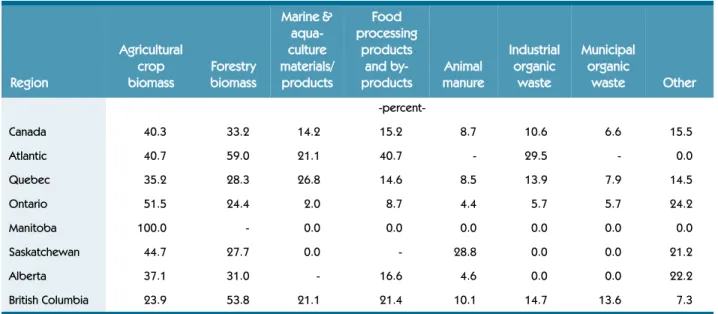
Firms were asked to indicate the type of biomass product used in 2003. Table 5 provides a break-down of responses to this question on a regional basis. (Note that responses to this question are not mutually exclusive, so the percents in any given column can sum to more than 100 percent.) Agricultural crop and forestry biomass were the most common forms of biomass used in Canada. They were used by 93 and 77 firms, respectively, more than twice the number of firms using any other single type of biomass.
Agricultural crop biomass was favoured by firms in most provinces, including Manitoba, Saskatchewan, Ontario, Alberta, and Quebec. Firms in British Columbia and the Atlantic regions made significantly more use of forestry biomass, while Quebec firms made fairly extensive use of both forestry and marine biomass. Firms in the Atlantic region made use of food processing products and by-products, in addition to agricultural crop and forestry biomass.
Table 5: Percent of firms reporting use of different biomass types, by region, 2003
Region
Agricultural crop
biomass Forestry biomass
Marine & aqua-culture materials/ products Food processing products and
by-products manureAnimal
Industrial organic waste Municipal organic waste Other -percent-Canada 40.3 33.2 14.2 15.2 8.7 10.6 6.6 15.5 Atlantic 40.7 59.0 21.1 40.7 - 29.5 - 0.0 Quebec 35.2 28.3 26.8 14.6 8.5 13.9 7.9 14.5 Ontario 51.5 24.4 2.0 8.7 4.4 5.7 5.7 24.2 Manitoba 100.0 - 0.0 0.0 0.0 0.0 0.0 0.0 Saskatchewan 44.7 27.7 0.0 - 28.8 0.0 0.0 21.2 Alberta 37.1 31.0 - 16.6 4.6 0.0 0.0 22.2 British Columbia 23.9 53.8 21.1 21.4 10.1 14.7 13.6 7.3
Number of bioproducts under development, by type and firm size
0 50 100 150 200 250 Bio-fuels/bio-energy Bio-chemicals Biopesticides/ biofungicides/ bio-herbicides Fiber composites/ fiberboard/agri-fiber panels Bio-sensors/ biocatalysts/bio-plastics/other Small Medium Large
Bioproducts Development Survey: Analysis of the Summary Results
8
Chapter 2
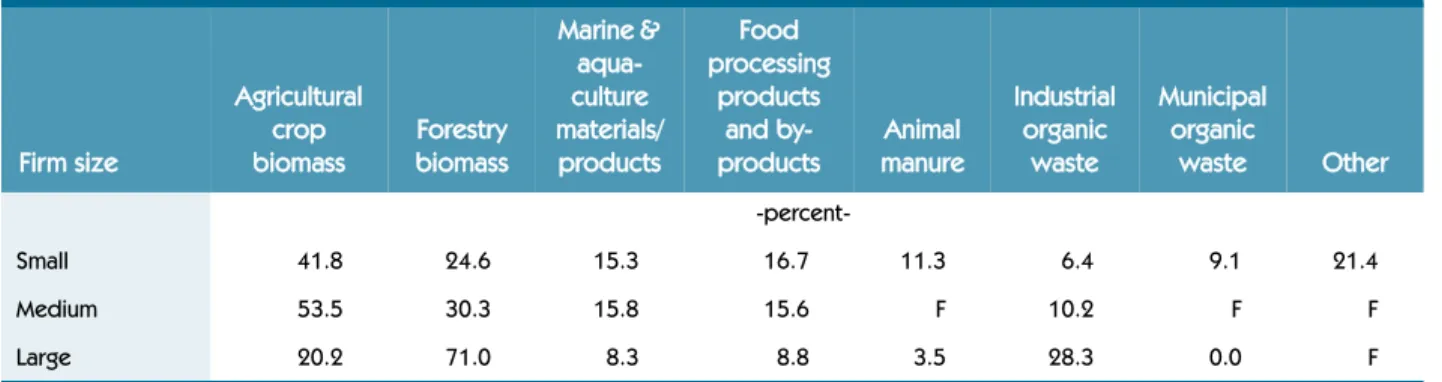
Agricultural crop biomass was the dominant form used in both small and medium sized firms (see Table 6). Large firms most often used forestry biomass in their production; however, very little use was made of marine products, food processing products, animal manure, or municipal organic waste.
Table 6: Percent of firms by type of biomass used, by firm size, 2003
Table 7 shows the percentage of firms using biomass inputs of different origins. This breakdown is based on whether firms secure their main biomass input as primary products (e.g. soybean, corn, hemp, etc.), by-products (e.g. straw, fat, etc.) or recycled products (e.g. cooking oil, indus-trial sludge, etc.). Within Canada, most firms used either primary (108 firms) or by-product (109 firms) based biomass inputs. Moreover, this pattern of biomass input type also appears to hold across the different regions, albeit in different proportions. Regardless of firm size, most used either primary or by-product based biomass inputs (see Table 8).
Table 7: Percent of firms by principal biomass input, by region, 2003
Most biomass inputs were sourced domestically. At a national level, over 80 percent of firms reported sourcing their biomass inputs domestically. Except for Alberta, where one third of firms sourced their inputs internationally, this pattern holds on a regional level. Firm size does not appear to affect whether a firm sources their biomass domestically with medium sized firms being one subtle exception with 90 percent source domestically.
Firm size Agricultural crop biomass Forestry biomass Marine & aqua-culture materials/ products Food processing products and by-products Animal manure Industrial organic waste Municipal organic waste Other -percent-Small 41.8 24.6 15.3 16.7 11.3 6.4 9.1 21.4 Medium 53.5 30.3 15.8 15.6 F 10.2 F F Large 20.2 71.0 8.3 8.8 3.5 28.3 0.0 F
Region Primary product By-product Recycled product Foreign Source
-percent-Canada 46.4 47.1 6.3 15.6 Atlantic 61.4 21.6 18.9 -Quebec 46.2 47.1 6.2 18.2 Ontario 42.8 51.6 4.9 13.0 Manitoba 50.4 45.4 0.0 0.0 Saskatchewan 46.8 53.3 0.0 -Alberta 57.5 43.0 0.0 33.2 British Columbia 36.8 51.4 12.3 10.6
Bioproducts Development Survey: Analysis of the Summary Results 9
Bioproduct Development and Biomass Use
.
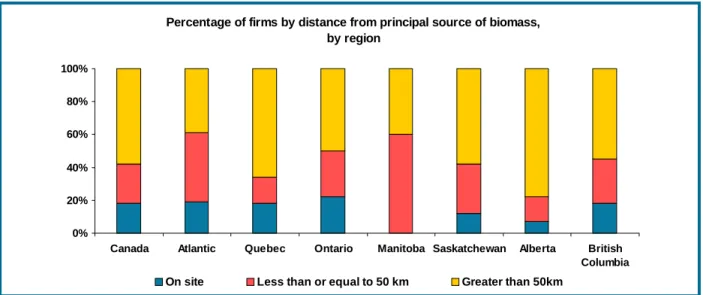
Only 18 percent of all Canadian firms had their biomass on site, and nearly 60 percent of firms were farther than 50 km from their primary source (see Figure 6). With the exception of the Atlantic region and Manitoba, more than half of the firms indicated that they traveled 50 kilometres or more to source their biomass inputs. This suggests that an active market with substantial search and transport costs exists in the sourcing of biomass inputs. As will be seen later, the cost of transporting biomass inputs is viewed by some firms as a barrier to bioproduct development/production.
Figure 6: Percent of firms by distance from location of principal biomass input, by region, 2003
Off-site sourcing was important for small and medium sized firms which predominately sourced biomass inputs from locations greater than 50 kilometres from the firm (Figure 7). As firm size increases, the share of biomass input sourced on-site increases, a finding consistent with the increasing level of by-product used with increasing firm size. This would suggest that smaller firms were focused more on processing biomass not produced by the firm, while large firms used biomass processing as a means to develop a revenue generating output based on some other production process. Alternatively, larger firms may be adjacent to sources of their biomass inputs, thus taking advantage of agglomeration economies.
Table 8: Percent of firms by principal biomass input, by firm size, 2003
Firm size Primary product By-product Recycled product Foreign Source
-percent-Small
(less than 50 employeees) 48.0 45.7 5.5 17.7
Medium
(50 - 149 employees) 44.0 48.0 8.0 10.6
Large
(more than 149 employees) 39.9 52.5 7.6 12.4
Percentage of firms by distance from principal source of biomass, by region 0% 20% 40% 60% 80% 100%
Canada Atlantic Quebec Ontario Manitoba Saskatchewan Alberta British
Columbia On site Less than or equal to 50 km Greater than 50km
Bioproducts Development Survey: Analysis of the Summary Results
10
Chapter 2
Figure 7: Percent of firms by distance from location of principal biomass input, by firm size, 2003
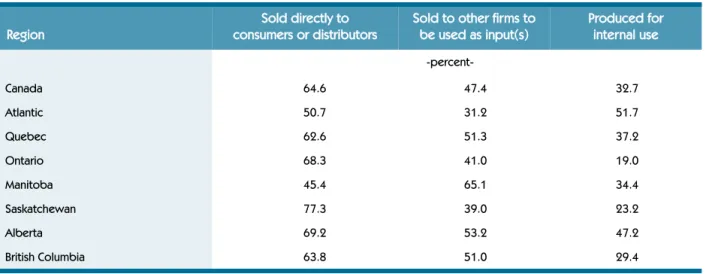
Table 9 summarizes firm’s responses regarding where their bioproducts were sold or used. Within Canada as a whole, most firms (65 percent) indicated they sold their bioproducts directly to consumers or distributors, followed by 47 percent who reported sale to another firm for use as an intermediate input, and 33 percent who indicated their bioproduct is used internally. Note that the responses to this question are not mutually exclusive, and the percentages in Table 6.1 could sum to more than 100 across a row.
Except for the Atlantic region and Manitoba, firms sell primarily to consumers or distributors, followed by sales to other firms and lastly, for own use. In Atlantic Canada, 51 percent of the firms reported sales to a