Working Paper 48
The Corporate Tax Burden in Ethiopia:
Evidence from Anonymised Tax Returns
Giulia Mascagni and Andualem Mengistu
ICTD Working Paper 48
The Corporate Tax Burden in Ethiopia:
Evidence from Anonymised Tax Returns
Giulia Mascagni and Andualem Mengistu
The Corporate Tax Burden in Ethiopia: Evidence from Anonymised Tax Returns Giulia Mascagni and Andualem Mengistu
ICTD Working Paper 48
First published by the Institute of Development Studies in March 2016 © Institute of Development Studies 2016
ISBN: 978-1-78118-284-0
A catalogue record for this publication is available from the British Library.
All rights reserved. Reproduction, copy, transmission, or translation of any part of this publication may be made only under the following conditions:
- with the prior permission of the publisher; or
- with a licence from the Copyright Licensing Agency Ltd., 90 Tottenham Court Road, London W1P 9HE, UK, or from another national licensing agency; or
- under the terms set out below.
This publication is copyright, but may be reproduced by any method without fee for teaching or nonprofit purposes, but not for resale. Formal permission is required for all such uses, but normally will be granted immediately. For copying in any other circumstances, or for reuse in other publications, or for translation or adaptation, prior written permission must be obtained from the publisher and a fee may be payable.
Available from:
The International Centre for Tax and Development at the Institute of Development Studies,
Brighton BN1 9RE, UK
Tel: +44 (0) 1273 606261 Fax: +44 (0) 1273 621202 E-mail: info@ictd.ac.uk
Web: www.ictd/en/publications
The Corporate Tax Burden in Ethiopia: Evidence from Anonymised Tax
Returns
Giulia Mascagni and Andualem Mengistu
Summary
This paper computes and analyses the tax burden on Ethiopian corporations, measured by the average effective tax rate (ETR) on their profit. Our strongest result regards the relation between tax burdens and firm size. We find a statistically significant U-shaped relation between ETR and size. While small firms face the highest tax burden, the largest firms still pay more than middle-sized firms. It is this latter group that benefits from lower tax burdens. These results suggest that both small and large firms face constraints in minimising their taxes, but these constraints are fundamentally different. While small firms do not have the capacity and resources to fully exploit the tax system, large firms are highly visible and under greater scrutiny by the tax authority. This speculative interpretation is supported by the available data on firms’ deductions. We also find that exporting firms, firms that pay their taxes in regional offices as opposed to Addis Ababa, and firms with higher leverage have lower tax burdens.
Keywords: effective tax rates; Ethiopia; corporate taxation; administrative data.
Giulia Mascagni is a Research Fellow at the Institute of Development Studies, and Capacity Building Manager at the International Centre for Tax and Development in Brighton, UK. Andualem Mengistu is a Senior Researcher at the Ethiopian Development Research Institute (EDRI) in Addis Ababa, Ethiopia.
Contents
Summary 3 Acknowledgements 5 Acronyms 5 Introduction 61 Overview of ETRs in the literature 8
2 Corporate taxation in Ethiopia 10
3 Data and methodology 12
3.1 Data and sample selection 12
3.2 ETR measure 13
3.3 Method of analysis 14
4 Results 15
4.1 Firms reporting losses and nil-filers 15
4.2 Descriptive analysis 16
4.3 Regression analysis 19
4.4 Interpretation of results and other supporting evidence 21
5 Conclusions 23
Appendices 25
References 30
Tables
Table 1 Losses and nil declarations by year and sector 16
Table 2 Firms and tax contributions by sector 17
Table 3 Average ETRs by sector 19
Table 4 BE regression results 20
Table 5 FEM regression results 21
Graphs
Graph 1 Average ETR by decile 18
Graph 2 ETR-size relation 18
Acknowledgements
This paper was prepared with the support of the International Centre for Tax and
Development, which is funded by DFID and NORAD. We are very grateful to the Ethiopian Revenue and Customs Authority for sharing anonymised tax returns data with us. In
particular, we would like to thank Ato Retta for his invaluable support throughout the project. We are also grateful to Marco Carreras for his excellent research assistance, and for the useful comments and feedback received from the participants of the 13th International
Conference on the Ethiopian Economy, the 5th ICTD Annual Meeting, and two anonymous
reviewers.
Acronyms
AETR Average effective tax rate BE Between estimator
ERCA Ethiopian Revenue and Customs Authority ETR Effective tax rate
FEM Fixed effects model
GTP-2 Second Growth and Transformation Plan MOFEC Ministry of Finance and Economic Cooperation REM Random effects model
TIN Tax Identification Number VAT Value Added Tax
Introduction
Corporate taxation has become an increasingly central topic to economic policy in
developing countries. There are two main relevant issues to consider, which are sometimes at odds. Firstly, most low-income countries still operate under great financial constraints, as domestic revenue is typically lower than financing needs. In this context, it is crucial to ensure that revenue is collected from all sources in an efficient and equitable way. Given a country’s legal system, corporations should pay what they owe to contribute to the
development of the country in which they operate. Secondly, industrial policy is key to successful economic development. Most low-income economies are still largely reliant on agriculture, with a relatively low contribution of manufacturing and other industrial sectors. However, much recent literature has demonstrated that the industrial sector in general, and the manufacturing sector in particular, is the engine of economic growth. In fact, virtually all cases of high, rapid and sustained economic growth in modern economic development have been associated with industrialisation, particularly growth in manufacturing production (see Szirmai 2009). In this context, it is crucial to promote industrialisation and structural
transformation with all available policy tools, including taxation (McMillan and Rodrik 2011). In many low-income countries, this has resulted in widespread fiscal incentives to investors and exporters. However it often remains unclear whether the benefit of incentives, in terms of growth, employment and investment, is larger than their cost in terms of revenue loss (Kinda 2014; Klemm 2010). Moreover, large informal sectors in developing countries may result in a situation where some firms are taxed only partially or not at all, while those who are fully captured in the tax net may face a high tax burden (Gordon and Li 2009).
The Ethiopian context is a particularly suitable setting to illustrate these issues, for at least three reasons. First, tax revenue in Ethiopia is still lower than the average for comparator groups such as low-income economies or sub-Saharan African countries. The tax-to-GDP ratio in 2013/14 was 13 per cent, as compared with about 15 per cent for the other two groups. Second, Ethiopia is growing very fast, at a rate of about 10 per cent in real terms in the past ten years, and is attracting increasing interest from international investors. Large corporations already operate in the country, and their presence can be expected to increase in years to come. Finally, the Government of Ethiopia has recently adopted the second Growth and Transformation Plan (GTP-2), an ambitious 5-year development plan that entails great financial needs to support industrialisation and growth in the manufacturing sector. Manufacturing contributes only 5 per cent to GDP in Ethiopia, while agriculture contributes 40 per cent.1 The gap between the low tax collection and the significant revenue needs to
achieve the goals set out in GTP-2 implies that the country needs to mobilise increasing revenue from all sources. On the other hand, the low industrial (manufacturing) base and the country’s goal of industrialisation make it necessary to provide a favourable business
environment for investors.2
Against this background, Ethiopia faces the challenge of increasing tax revenue dramatically while minimising distortions in the economy that may discourage investment and, more generally, economic growth. As far as corporations are concerned, it is therefore crucial to ensure that they contribute to the public purse, while still facing tax burdens that allow them to prosper. Despite the importance of this topic, very little evidence is available so far on the corporate tax burden in Ethiopia. This paper aims to fill this gap by calculating and analysing effective tax rates (ETRs) across Ethiopian corporations.
1 Based on data from the Ministry of Finance and Economic Cooperation (MOFEC) for 2013/14.
2 Governments often do this by providing tax incentives, although the literature has shown that other measures may be
more effective, such as simplifying tax administration and ensuring a stable and predictable tax system (Kinda 2014; Klemm 2010; Klemm and Van Parys 2012).
Effective tax rates are broadly defined as the ratio of taxes paid by a firm to its income and represent the tax burden on firms. ETRs differ from statutory tax rates, those defined in the law, because firms can benefit from a range of legal provisions and other practices to reduce their tax burden. An example of the former is tax holidays that are granted to encourage investment; the latter can involve tax-minimising strategies such as the artificial inflation of business expenses or aggressive tax planning. Importantly, it is the effective tax burden that influences a firm’s investment pattern in terms of size of capital outlay, location and other decisions.3 Despite a flat statutory rate, ETRs can vary across size categories and sectors,
amongst other firm-level characteristics. Differences related to size are likely due to compliance costs, the extent of tax planning, and the visibility of the firm to the tax
administration; differences across sectors and location may arise from sector-specific tax incentives, or because it may be easier for firms to evade or avoid taxes in specific sectors and locations.
In this context, ETRs have been used in the literature and policy debate to explore issues related to fairness in the distribution of the tax burden between smaller and larger firms, or across sectors, as well as implications for industrial policy (Adhikari et al. 2006; Kim and Limpaphayom 1998; Derashid and Zhang 2003). Although the African continent has been largely excluded from this debate, primarily due to lack of data, an influential paper examined the relation between the tax burden and firm size in Uganda (Gauthier and Reinikka 2006). The authors show that tax evasion is very common across small firms, while large ones can benefit from widespread tax exemptions. As a result, they argue that middle-sized firms bear the highest burden. We contribute to this debate by showing evidence that the opposite is true in Ethiopia: middle-sized firms actually face the lowest tax burden of all.
The relation between ETR and firm size is at the centre of this analysis. In particular, we test whether larger firms are able to exploit the tax code better, and thus benefit from lower ETRs. For example, they might be able to take more advantage of provisions for deductions and allowances than small firms. This hypothesis has sometimes been formulated in the literature as two competing possibilities: the first is related to political power, whereby larger firms are able to obtain lower ETRs, and the second to political cost, whereby larger firms face higher ETRs because they are more visible.4 Despite the validity of both possibilities, we
argue that political power and cost are not the only elements explaining differences in the tax burden between large and small corporations. In Ethiopia, and likely in developing countries more generally, technical reasons also contribute to explaining these differences. These include particularly access to professional accountants, the availability in-house of the necessary skills to perform tax planning, and the compliance costs associated with these activities. The literature shows that these technical constraints are particularly acute for small firms (Coolidge 2012). We argue that these technical reasons explain our finding that small corporations experience the highest tax burden. On the other hand, large firms experience relatively high tax burdens too, but due to fundamentally different reasons. In line with the political cost hypothesis, these firms are more visible and under greater scrutiny by the revenue authority. This higher visibility, however, may be due to technical factors, such as the use of modern technology and formal financing, in addition to political ones (Gordon and Li 2009; Kleven et al. 2015).
In addition to the results on the ETR-size relation, we also explore how tax burdens vary by location, sector, and other firm-level characteristics such as fixed capital and leverage. We pay particular attention to the industrial and manufacturing sectors, since they play a key role in Ethiopia’s development strategy. However, we show that they face relatively higher tax burdens than other sectors.
3 For a more detailed discussion of the differences between marginal and average ETRs, and their respective effects on
investment decisions, see Section 1.
Last, but not least, our analysis of ETR is based on anonymised firm-level data from corporate tax returns. This represents an element of novelty, since this type of data is still under-used in many developing countries, particularly in Africa. Our unique dataset allows us to shed light on firms’ use of tax minimising strategies, while controlling for key firm-level variables that are likely to influence the tax burden, such as capital intensity and leverage. Since the data is firm-level, we can explore how different firms use these strategies differently.
1 Overview of ETRs in the literature
Effective tax rates have been measured in the literature in various ways. A first broad
distinction regards the underlying data, which can be either macroeconomic data or firm-level microeconomic data. In the former case, aggregate tax collection is compared to the net operating surplus generated in the economy.5 However this measure does not say much
about the effective tax burden that firms experience in practice. By being aggregate, it ignores important differences across firms in terms of sector, location and size, amongst others. It may be that a low aggregate tax share averages out great distortions in the economy. Moreover, aggregate ETR also presents some methodological drawbacks due to differences in the treatment of losses in the numerator and denominator. The operating surplus of an aggregate economy includes the average surplus from loss-making and profitable firms, whereas the numerator (tax paid) only includes those firms that are profitable. As a result, the aggregate ETR may be overestimated.6 For these reasons, and
because we are interested in a disaggregated analysis at firm-level, we prefer to use microeconomic data.
The second broad distinction divides ETRs into forward-looking and backward-looking. On the one hand, forward-looking ETR measures the ETR that a potential investment or project faces.7 The main drawback of the forward-looking ETR is that it requires complex modelling,
with several assumptions, to accurately reflect all the legal provisions and tax planning strategies that may result in lower taxes.8 Even if this complexity could feasibly be
summarised in one measure, it would still not take into account the extent of tax minimisation that firms are willing or able to apply. It is increasingly clear that tax planning and tax
avoidance strategies are at least as important as statutory parameters in explaining corporate taxation. Typically, large firms have more resources to dedicate to these strategies, and are therefore more likely to benefit from them. Moreover, developing countries make extensive use of fiscal incentives, which are often granted by various
institutions and in some cases to specific firms, or categories of firms, in a rather ad hoc way. Therefore, reaching a sensible measure of forward-looking ETR is particularly challenging in practice.9
On the other hand, the backward-looking ETR overcomes these problems by looking at historical data to see how much a firm has actually paid as a share of its income in the past. By doing this, it implicitly includes all relevant laws and regulations, as well as behavioural
5 Aggregate ETRs have been used, for example, in Mendoza et al. (1994) and OECD (2000).
6 The numerator of aggregate ETR will exclude losses because taxes are not collected on loss-making firms. However
the denominator will be a sum of all gross operating profits in the economy, including positive (profit) and negative (loss) values. For a more detailed discussion on this, see (OECD 2000).
7 For applications of this measure see, for example, Devereux and Klemm (2003) for an empirical analysis, and Devereux
(2003) for a theoretical discussion.
8 Assumptions would involve, for example, the financing decisions of firms, as well as certain conditions in the functioning
of financial markets and the behaviour of financial investors (Søresen 2004). In the case of non-liberalised financial markets, as in Ethiopia, these assumptions are particularly problematic.
choices of the firm such as the extent of tax minimisation and other avoidance practices. The resulting measure is therefore firm-specific, and may differ within the same country, sector or size group. As such, this measure is better suited to analyse the tax burden of firms rather than to provide estimates on prospective tax payments of a specific investment project. However, the more stable the tax regime, the more these two measures become similar. As a result, the backward-looking ETR will be approaching the forward-looking one in a country like Ethiopia, where the tax system has been relatively stable for the past decade.10
Moreover, backward-looking ETRs can offer an overview of the overall tax burden actually experienced by firms under the current tax system. For these reasons, this is the measure we adopt in this paper.
A third distinction is between marginal and average ETRs. The former indicates the ETR that is paid on a specific additional investment that a firm may undertake. It is therefore the most useful measure to support specific investment decisions. The latter is the average rate that a firm is paying on its whole portfolio of investments, including all income that may receive different tax treatments. Average ETRs (AETRs) are therefore not a good guide for specific investment decisions, but they give a more accurate measure of the tax burden that a firm experiences. Since the main objective of this paper is to assess tax burdens in Ethiopia, the AETR is deemed more suitable. Moreover it must be noted that, while the marginal ETR can offer indications on the marginal investment decisions, firms also make other kinds of
important decisions. For example, while the optimal scale of an investment depends on the marginal ETR, the decision on where to locate an investment or firm is influenced by the AETR (Søresen 2004). This aspect is particularly relevant in Ethiopia, as attracting foreign investment is central to the country’s growth and structural transformation strategy.
Therefore, in this paper we use anonymous administrative data from the Ethiopian Revenue and Customs Authority (ERCA) to calculate backward-looking AETRs. This is a unique firm-level dataset from tax returns covering the whole population of corporate taxpayers over eight years (2006-2014). This type of data presents a couple of advantages over most of the literature, particularly in a developing country context. First, it is better than estimates
obtained with a theoretical approach using tax laws and regulations, because it reflects what firms actually pay rather than what they should pay in principle. Second, it is better than data from listed firms, which is typically used in corporate ETR literature, since only a handful of firms are listed in Africa.
The literature on firm-level ETRs focuses largely on testing the two conflicting hypotheses of ‘political power’ and ‘political cost’.11 On the one hand, the political power hypothesis
postulates a negative relation between ETR and size, on the grounds that larger firms enjoy more bargaining power in negotiating with the government, and have greater resources to devote to tax-minimising strategies. On the other hand, the political cost hypothesis suggests a positive relation between ETR and size: the greater visibility of large firms makes it harder for them to escape the tax net through evasion or aggressive tax planning. The literature does not provide a clear answer as to which one of the two hypotheses describes reality more accurately.12 Even in the early literature on the USA, some studies found a positive
relation, others a negative one, and some found no significant relation.13 More recently
Nicodeme (2002) found that smaller firms pay higher ETRs than larger ones in OECD countries.
10 For a more detailed discussion of cases in which the two measures converge, see Gordon et al. (2004).
11 See, for example, Zimmerman (1983) and Richardson and Lanis (2007).
12 Note that although all the literature mentioned above uses microeconomic data, most of it is based on information from
the financial accounts of listed firms instead of tax returns data. This is likely due to the easier accessibility of this data in countries where stock markets are well developed. However, it is particularly problematic in developing countries due to small or non-existing stock markets (as in Ethiopia).
13 For example, a positive relation was found in Zimmerman (1983), Kern and Morris (1992) and Gupta and Mills (2002); a
negative one in Porcano (1986); and no significant relation in Stickney and McGee (1982) and Gupta and Newberry (1997).
Although still very limited, the evidence from developing and emerging economies is more in support of the political cost hypothesis. For example, Kim and Limpaphayom (1998),
focusing on five countries in the Pacific Basin, suggest that a negative relation (i.e. large firms paying less taxes) may occur particularly in emerging economies where governments need to rely heavily on large corporations for the success of their development and
industrialisation strategies. This negative relation is confirmed also in the case of Malaysia (Derashid and Zhang 2003; Adhikari et al. 2006) and India (Guha 2007), while in China size seems to have a positive effect (Wu et al. 2012; Wu and Yue 2009).
The work that is closest to the ETR literature for Africa is the article by Gauthier and Reinikka (2006), based on survey data from Ugandan firms. The main result of the paper is an inverse U-shaped relation between size and the tax burden. The authors explain the relatively low tax burden on the smallest and largest tax firms with, respectively, evasion and exemptions. At the same time, middle-sized firms face the highest tax burden. Although this paper relates to our analysis very closely, there are at least three important differences with respect to our work and to the broader ETR literature. The first and most important one is the data
underpinning the analysis: a survey for Gauthier and Reinikka (2006), as opposed to tax returns (in our case) or data for listed firms. Survey data has been the only option in Africa for some time, since tax returns were not available to researchers until recently; and stock market listings of firms are shallow or non-existent in many African countries, including Ethiopia. The main difference between these data sources is that surveys may include firms that are completely informal, while datasets obtained from tax returns or listed firms would exclude informal firms. Second, these authors consider all tax types in their calculation of the tax burden, while we, like the rest of the literature, consider only corporate taxation. This choice is discussed in more detail in Section 2. Third, and partly as a result of different data, Gauthier and Reinikka use different methods than the rest of the literature, including our paper.14 These differences are likely to explain, at least partly, why our results are radically
different from the evidence of Uganda (see also Section 4).
Finally, researchers looked at differences in ETR across sectors. These may emerge as a result of measures that are intended to benefit specific sectors, such as longer tax holidays for sectors that are deemed strategic; or as an implicit effect from measures that are, in principle, available to all sectors. The cross-country analysis of Nicodeme (2002) shows that sectors explain a large proportion of the ETR variance across firms.15 For example, the
service and transport and communications sector are found to have a relatively lower tax burden than others. The limited available evidence from emerging economies also confirms the importance of sectors in determining ETRs. In particular, both Derashid and Zhang (2003) and Adhikari et al. (2006) find that firms in the manufacturing sector face a relatively lower tax burden than others – consistent with the idea that governments may incentivise its development with fiscal incentives.
2 Corporate taxation in Ethiopia
Businesses in Ethiopia are subject to various taxes: business profits tax, Value Added Tax (VAT), excises, taxes on employees’ incomes and various trade taxes, including custom duties and other indirect taxes collected at the border. For most of these taxes firms act as tax collectors, as the actual taxpayers are either the employees (for personal income tax) or consumers (for VAT and other indirect taxes). This paper focuses on business profits tax,
14 Gauthier and Reinikka (2006) use 3SLS method to estimate three simultaneous equations explaining respectively tax,
evasion and exemptions (as dependent variables).
15 The proportion explained by sectors varies between 30% and 10%, depending on the ETR measure used (Nicodeme
which is the one for which corporations are directly liable.16 This tax has the most direct
effect on business activities and decisions. For this reason, it is the key policy tool to promote investment – for example, through tax holidays – as it impacts directly on the return that investors are able to make.
The taxation of business profits in Ethiopia follows different rules depending on whether the firm is a corporation or an individual business. The latter includes both unincorporated businesses, usually comprising a single owner/employee, and self-employed professionals. While corporations are taxed at a flat rate of 30 per cent, individual businesses pay according to a progressive structure of rates ranging from 10 per cent to 35 per cent. Our analysis focuses particularly on corporations, so any reference to ‘firms’ or ‘businesses’ refers to this specific group, unless otherwise indicated. Although corporations are generally larger than individual businesses, it is not rare to find small taxpayers that are incorporated, and therefore included in our sample. For example, firms in the first and second deciles of our sample have an average annual turnover of about 270 GBP and 1,700 GBP respectively.17
Corporations are major tax contributors (15 per cent of total revenue) and they are all federal taxpayers, whereas individual businesses are typically much smaller, contribute less (5 per cent of total revenue) and pay to the eleven regional administrations of Ethiopia. In this context, our choice to focus on corporations is supported by their importance in revenue generation, and by the lack of reliable data at the regional level.
The main tax reform of the past two decades in Ethiopia was carried out in 2002, and it entailed new laws on both direct and domestic indirect taxation.18 The main innovations of
the former were the introduction of Tax Identification Numbers (TINs), the reduction of the corporate tax rate from 35 per cent to 30 per cent, and the introduction of other
administrative provisions related to deductions and loss carry-forwards. Moreover, in 2012 new investment laws regulated tax holidays for investors, building on previously existing incentive regimes.19 These laws provide holidays from profits tax for new enterprises, and for
incomes derived from expanding or upgrading existing enterprises. The holidays are granted to all eligible enterprises, both foreign and domestic. They range from zero to fifteen years, depending on the sector and the location in which the investment takes place. Beneficiary firms are still required to file declarations, although they are exempted from paying the business profits tax for a period of time. Tax holidays affect the ETRs paid in aggregate by a firm, since new investments would benefit from the tax incentives, based on location and sector, while other existing operations may still be fully taxed.
According to the tax laws, taxpayers are classified in three categories (A, B, and C) that determine the way in which they are required to pay tax. The categories are based on turnover: all large firms falling in Category A are requested to submit full books of accounts, while smaller firms in Categories B and C are subject to lower information requirements. All firms in our dataset fall in Category A, with the obvious advantage that we can have more information from their accounts, including, for example, expenses and loss carry-forward. Firms are required to send their tax declaration, together with the accounts and supporting documents, two to four months after the closure of the fiscal year, depending on the accounting requirements and the type of books of accounts kept by the firm. This deadline therefore falls between September and December. At this time firms also have to pay tax, as they already have an estimation of the amount due that will be then verified by ERCA.
16 Note that taxes on wages are usually seen by firms as part of employment costs (Søresen 2004), while indirect taxes
are eventually charged to consumers through price increases that should be similar for firms with similar characteristics (e.g. sector, exporters).
17 These figures refer to the distribution of firms in the latest year of data, 2013/2014.
18 The relevant laws regarding business profit taxes are Proclamation 286/2002 and amendments; and Council of
Ministers Regulations 78/2002 and 164/2009.
The tax laws include administrative provisions on the deductions that are allowed in the calculation of taxable profits, which are particularly relevant to this study. First, firms are allowed to deduct expenses that are necessary for the purpose of earning, securing and maintaining the business, such as salaries and wages, expenses for the distribution of goods, and the cost of renting business premises. Moreover, deductions are also allowed to take into account depreciation and amortisation of assets. Finally, taxable profits may be reduced if the firm experienced losses in the previous four years. In other words, loss carry-forwards are allowed for four years after the time when the loss occurred. In order to claim these deductions, the taxpayer has to provide supporting documents and keep detailed records.
The resulting taxable profit is the base on which the 30 per cent tax rate is applied. This tax liability is reduced by the amounts of tax credits, and the resulting amount needs to be paid at the time of the declaration. Tax credits include two main elements. The first one is taxes the firm has already paid in a foreign country, which can be deducted from the Ethiopian tax liability according to existing international treaties. The second, and most relevant in Ethiopia, is the amount of income tax that was withheld at the time of import. The tax laws provide for a withholding tax on imports at a rate of 3 per cent of the CIF value. While this tax is
collected at the border, it is effectively a tax on income and it can therefore be credited against the business profits tax liability at the time of the declaration. The same principle applies for a withholding tax on certain types of payments at a rate of 2 per cent of the amount of the payment. Once these tax credits have been subtracted from the tax liability, the remaining amount must be paid ‘in cash’ by the taxpayer at the time of the declaration.20
3 Data and methodology
3.1 Data and sample selection
Our dataset is obtained from the tax records of ERCA, for all corporate taxpayers in Ethiopia. Since Ethiopia has no stock market, and surveys do not include sufficient – or sufficiently reliable – information on tax, anonymised tax returns seem to be the most appropriate source of information. This type of data has at least three advantages. Firstly, it is disaggregated at the firm level, so we can compute ETRs for specific firms and analyse differences amongst them. Secondly, it is comprehensive: it includes all firms in the population of registered taxpayers, and a relatively large number of variables that are reported in their tax return. Thirdly, it allows us to focus on what firms actually pay, rather than what they are supposed to pay according to the law. We can therefore take into account the complexity of real taxpaying behaviour in a synthetic measure: not only including legal provisions, but also, crucially, firms’ actual take-up of these provisions. Moreover, we can draw considerations that are directly relevant to Ethiopia’s public budget, since our data reflects the resources that reach the public purse each year.
Notwithstanding these advantages, our dataset also presents a number of drawbacks. Tax records are routinely collected by the revenue authority for administrative purposes, not for research. As a result, we cannot control the process of data collection, or the firms that are included. The most notable implication is that we can only consider firms that are known to ERCA, thus excluding all purely informal firms. Therefore this paper focuses particularly on the intensive margin (tax of firms that are already making some tax payment), and not on the extensive margin (potential tax from firms that are not currently paying). In addition, we can only observe the information that firms declare to ERCA, therefore excluding any unreported
income. Since tax evasion usually occurs through income underreporting, our results speak more to issues related to tax avoidance and compliance costs than to outright evasion. Furthermore, this type of data does not come with any supporting documentation. Therefore close collaboration with the revenue authority is crucial, as well as a good knowledge of the tax system and country context.
Today ERCA compiles all the administrative information electronically, but this is a relatively new development in Ethiopia. The full dataset we obtained spans eight years, from 2006/07 until 2013/14.21 The full sample includes about 92,000 observations: more firms have been
entering the sample in recent years, so the last two years of data represent about 30 per cent of the total number of observations. The different years can be connected in a panel, so that firms can be tracked in time. Within the full sample, however, there are several cases in which firms report losses or file ‘nil declarations’ – both resulting in zero taxable income. In those cases there is no tax being paid,22 and we do not have a viable denominator for the
ETR. While we still present some findings on these taxpayers in Section 4, our sample for the ETR analysis includes only those taxpayers who have some positive income in the year considered. This restricted sample includes about 50,000 observations for which the ETR can be calculated.
By excluding firms reporting losses and ‘nil-filers’, this restricted ETR sample might suffer from selection problems. We therefore perform a simple t-test of differences in means for key variables, between the full sample and the one used for ETR analysis. The t-tests reveal statistically significant differences across the two samples, with firms in the ETR sample being relatively larger, more likely to be exporters, in the service sector, and public.
Unfortunately, the available techniques to take into account sample selection in estimation are not viable in our case, because we do not have an acceptable instrument to identify the selection equation.23 Therefore, our results should be read keeping in mind the caveat that
our sample is not fully representative of the universe of corporations operating in Ethiopia. However, it is still representative of firms that have a positive tax liability in any given year. The resulting sample includes about 16,500 firms, observed for an average of three years. Our data includes all updates made by the tax authority (e.g. audits) or by the taxpayer (e.g. rectifications) after the declaration period. However, it excludes any amount of interest or penalties applicable on the taxpayer’s account, so that we can isolate tax payments and avoid confounding them with sanctions. Although in principle all years should include all taxpaying corporations, the data for 2013/14 may not yet include late filers, if any.24
3.2 ETR measure
Using this data, we compute effective tax rates as the ratio of tax paid to gross profit. As discussed in Section 2 and in line with the literature,25 the numerator only refers to business
profits taxes. The amount of tax to be paid is reported in the tax declaration based on information provided by the firm and verified by ERCA. Based on tax returns data, we
calculate tax paid as: Tax paid = tax payments + (total credits – unused credits). Total credits include the amount that was already paid through withholding procedures (as described in
21 Ethiopia uses the Ethiopian Fiscal Year, which is seven years behind the Gregorian Calendar and starts in July. The
corresponding relevant years in the Ethiopian Calendar are 1999 until 2006.
22 However, in some cases firms may still have tax liabilities related to arrears or other due payments that are unrelated to
the specific year in consideration.
23 In particular, the Heckman procedure would require an instrument that should both be a good predictor of selection and
have no association with the outcome variable in the unrestricted population, after adjustment for other predictors of Y.
24 Corporate taxpayers are required to file and pay their taxes by October 2014, for the year ending in July 2014. Given
that we collected our data in December 2014 we should include most relevant tax returns, but we might still miss late filers or declarations that were not encoded properly in the data management system by the time we obtained the dataset.
Section 2), or foreign tax payments that can be credited against domestic liability. Unused credits arise when total credits exceed the tax liability for the firm in the given year, and they can be carried forward to the following year. Therefore, this numerator indicates the amount that ERCA actually collected from the firm, either through withholding procedures or actual tax payments. As such, tax paid may differ from the tax liability if the firm fails to fulfil its tax obligations. Some results on this possible payment non-compliance are reported in Section 4.
As far as the denominator is concerned, we use gross operating profit. This measure of income is defined asturnover minus the ‘cost of goods sold’, which includes the costs of raw materials and intermediate goods, but excludes all deductions such as interest payments, depreciation, employment costs and other business expenses. Using gross profit as the denominator allows us to take into account differences in profitability across firms and/or sectors, and thus isolate the tax-minimising effect of those deductible items that are still included in gross profit. The resulting ETR can show to what extent firms can minimise their tax through measures that operate through the base and that may be sector-specific. For example, differences in terms of treatment of depreciation, deductible items and the extent of expense claims may result in different ETR for similarly profitable firms. Moreover, variations across firms may reflect differences in terms of reliance on own funds vis-à-vis borrowing from banks,26 differences in depreciation treatments,27 and the extent to which they may
under- or over-report their business expenses. We control for some of these factors, such as capital intensity and leverage, in the regression analysis.
The resulting ETR is expected to differ from the statutory rate mainly due to the different denominator:gross profit as opposed to taxable income.28 If we were to use taxable income,
we would obtain the statutory tax rate of 30 per cent – which provides a useful test on the validity of our data. The main difference between taxable income and gross profit lies in the subtraction of deductions (see Section 2). Therefore, variations in the ETR can offer
indications with respect to the use of expenditure deductions and allowances by firms. Some studies in the literature have shown that this can be an important channel of tax evasion or avoidance, since expenses are harder to verify than income.29 Therefore although our
dataset does not capture under-reported income, we can still draw some initial
considerations on the use of deductions to reduce taxable income. It is likely that larger firms are better able to exploit the tax code to their advantage, suggesting lower ETRs according to these measures. However, they are also more visible so they may not be able to reduce their ETR by artificially inflating expenses, since they are at higher risk of scrutiny.
Finally, we capped the ETR at 100 per cent. Given our calculation of the numerator, taking into account all used and unused tax credits, there should be no reason why the ETR is larger than 100 per cent, and indeed this is the case only for a relatively small number of firms, which we treat as errors.
3.3 Method of analysis
The ETR analysis starts with a purely descriptive part (Section 4.2), which is strongly suggestive of the key results emerging from the data. However, these results need to be
26 The Ethiopian tax system allows for interest deduction. Therefore, it encourages debt over equity finance.
27 In the determination of taxable business income, the depreciation of business assets is allowed. The following two
categories of business assets shall be depreciated according to a pooling system at the following rates: 1) Computers, information systems, software products and data storage equipment: 25%; 2) All other business assets: 20%.
28 Turnover could also be used as the denominator of ETR. However, in this case, variations in ETR across firms may be
due to both deductions and to differences in the profit to turnover ratio – this making it difficult to isolate tax minimising strategies. For a more detailed discussion on measures for the ETR denominator, also see Lazar (2014) and Nicodeme (2002).
tested in a multivariate framework to identify more precisely the relations of interest. We therefore estimate a simple empirical model to explain the ETR (Section 4.3), which aims at further testing these descriptive results rather then establishing causal effects. The key variable of interest is size, measured as turnover deflated using national inflation and transformed in log.30 Given the descriptive evidence of a non-linear relation with size, a
squared term for this variable is also included in the regression. In addition, a set of
explanatory variables control for factors that determine the tax burden according to Ethiopian tax law, namely: sector, location and export status. Other variables are included because they are likely to affect the tax burden for other reasons. Namely, the age of a firm may affect its capacity to plan its affairs efficiently and minimise its tax burden. Also, firms belonging to the government may have lower incentives to minimise their tax burden, and may have less opportunity to do so. Therefore, age and public ownership are included to test these
hypotheses and control for their potential effects. Finally, for many firms it is possible to calculate measures of leverage and capital intensity based on the information included in the balance sheet that they submit to ERCA. However, since these two variables are only
available for a subset of firms, results from the model that includes them are reported separately. A description of all variables is available in Appendix A.
Since our data allows us to track firms in time through a unique ID, panel data methods can be used to alleviate issues related to unobservable variables and heterogeneity across firms. The three standard panel methods are the fixed effects model (FEM) or within estimator, the random effects model (REM), and the between estimator (BE). The Hausman test compares the FEM to the REM, and strongly suggests that in our case the former is more suitable.31 A
key advantage of FEM is that it can tackle the potential bias from unobserved factors that do not vary (or vary very little) in time, such as entrepreneurial ability, corporate culture or the firms’ reputation. However, this implies that some observable variables of interest that are relatively fixed in time, such as sector and location, are also excluded in the FEM framework. Still, these variables can be included when using the between estimator, which exploits only the variation between firms by taking averages for each one over time. While the fixed effects model explores variations within a firm over time, the between estimator looks at differences across firms. Therefore, both are relevant to our analysis, and the results from each are reported in Section 4.3.
4 Results
Although the ETR analysis necessarily focuses on firms with positive income (see Section 3), our dataset also reveals some interesting facts regarding firms that declare losses and nil-filers. Therefore, this section starts with a brief description of these cases, before moving to the descriptive and regression analysis of ETR.
4.1 Firms reporting losses and nil-filers
Table 1 shows that a third of firms in our sample declared losses in recent fiscal years.32
Moreover 23 per cent filed nil declarations, reporting zero turnovers and therefore implying
30 By using logs we can decompress the values of size, which is otherwise highly concentrated around very small values
when measured in local currency. The high concentration of data at low turnover values makes it difficult to fit a sensible regression line when we use turnover in millions as the dependent variable. The results obtained with the log transformation are further supported by evidence from Kernel polynomial graphs and by the descriptive observations from the raw data.
31 The p-value of the Hausman test is 0.000. Moreover, the F-test confirms the significance of the fixed effects with p-value
0.000, therefore supporting FEM as opposed to OLS.
32 The proportion of firms declaring loss is lower if we restrict our sample to those firms that declare positive annual
zero tax. These, taken together, amount to about 41.5 per cent of declarations, or about 6,200 corporations that yield no taxable income and no tax revenue in the last two years of data. While this may be the genuine picture of a difficult business environment in Ethiopia, it may also be indicative of non-compliance by firms through under-reporting of their true income. Our data does not allow us to distinguish between these alternative explanations, as we can only observe what firms declare to the tax authority, not their true economic activity. However, either way, it is noteworthy that only about 60 per cent of Ethiopian corporations are eligible to pay any income tax. This finding will require additional exploration in further research, perhaps by cross-checking it with other sources of information.
Table 1 Losses and nil declarations by year and sector
Firms reporting
losses Nil declarations All years All sectors 32% 23% Agriculture 47% 30% Industry 33% 25% Services 31% 22% 2013/14 All sectors 30% 19% Agriculture 47% 25% Industry 28% 22% Services 30% 17%
Notes: Authors’ calculations based on data from ERCA.
To unpack this finding further, Table 1 also reports the percentage of firms reporting losses and nil-filers by sector. Sectoral differences are particularly noteworthy for losses, as they are concentrated more heavily in the agriculture sector: almost half of all firms in this sector report losses each year. In a difficult climate like the Ethiopian one, with frequent droughts and irregular rains, this finding is entirely plausible. Similarly, nil-filers are also more concentrated in the agricultural sector, but to a lesser extent. Moreover, firms reporting losses are typically smaller in terms of turnover: the percentage of these firms is 45 per cent in the lower two deciles, compared to 14 per cent in the higher two.33
4.2 Descriptive analysis
Having shed more light on nil declarations and losses, we now focus on the restricted sample of firms with positive profits, for which ETR can be calculated. Most firms in this sample are based in Addis Ababa: corporations registered in the capital represent 86 per cent of observations, and contribute 96 per cent of the total corporate tax take.34 Although these
figures may be due to the fact that many firms have their headquarters in Addis, they still imply a very high concentration in the capital city. Perhaps even more importantly, tax
collections are heavily concentrated in the top decile of size, defined on the basis of turnover. About 90 per cent of total corporate tax revenue was collected from the largest 10 per cent of firms in the two most recent years. This implies a very high reliance on a relatively small number of large taxpayers, which generates vulnerability to any event or behaviour that may reduce taxable income within this group.
33 These figures refer to 2012/13; the corresponding ones for 2013/14 are 27% and 15%. The percentage of nil-filers by
size cannot be reported, because size is calculated in terms of turnover, which is zero by definition for nil-filers.
34 These figures, as well as other descriptive statistics reported in this section, refer to the average of the last two years of
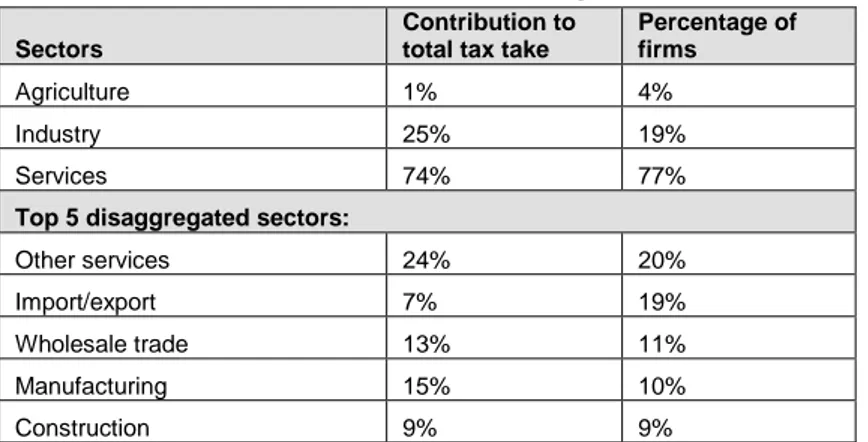
As far as sectors are concerned, most firms in the sample are in the services sector, followed by industry and, finally, agriculture (see Table 2). Although only few corporate firms operate in agriculture, they tend to be relatively large. Disaggregating sectors further, Table 2 also shows that about 70 per cent of our firms belong to five top sectors: other services, import/export, wholesale trade, manufacturing and construction. The contribution of these disaggregated sectors to total tax revenue, as reported in Table 2, suggests some
differences. For example, while import/export contributes disproportionately less than its presence in the economy, manufacturing seems to contribute more. This may be taken as a preliminary indication of a lower tax burden for the former and higher for the latter, which is explored more formally in the regression analysis.
Table 2 Firms and tax contributions by sector
Sectors
Contribution to total tax take
Percentage of firms
Agriculture 1% 4%
Industry 25% 19%
Services 74% 77%
Top 5 disaggregated sectors:
Other services 24% 20%
Import/export 7% 19%
Wholesale trade 13% 11%
Manufacturing 15% 10%
Construction 9% 9%
Notes: Authors’ calculations based on data from ERCA for all years.
Turning to the main focus of this paper, this initial descriptive analysis of the ETR focuses on two relevant dimensions in particular: size and sector. To start exploring the relation between ETRs and size, we compute average ETRs by deciles, defined based on turnover. Graph 1 plots those average ETRs across deciles, and shows that they are substantially different than the statutory 30 per cent. This feature is fully expected because the denominator, gross profit, is by definition larger than taxable income (see Section 3). Therefore, the most
interesting finding related to Graph 1 relates to the pattern across size deciles, more than the
level of the average ETR in each decile. The most notable aspect of this pattern is its U-shape: small firms face the highest tax burden, middle firms the lowest, and large firms higher than the latter but still lower than small firms. More specifically, the ETR declines until the fourth decile and then it increases starting from firms in the sixth decile. The difference between the mean ETR for the first two deciles, two middle deciles, and two highest ones is statistically significant (based on t-test of equal means). Based on the U-shape emerging from Graph 1, Graph 2 shows the fitted values of the quadratic relation between size and ETR including all available years of data. Although these graphs are highly suggestive of a U-shaped relation between ETR and size, they only represent a partial correlation that needs to be further tested in a multivariate framework.
Graph 1 Average ETR by decile
Note: Authors’ calculations based on data from ERCA for 2013/14.
Graph 2 ETR-size relation
Note: Authors’ calculations based on data from ERCA for all years.
The second dimension explored descriptively relates to sectors. Table 3 reports the average ETR for the three aggregate sectors and for the top five disaggregated sectors. There are two main results from this table. The first one is that agriculture faces a lower tax burden than other aggregate sectors, although there are a few disaggregate sectors that are taxed even less (see Appendix B). These are typically sectors related to public services (e.g. education) or mining. The second result is that industry appears to face a relatively high tax burden. Consistent with this, manufacturing in 2013/14 faced an ETR higher than any other disaggregated sector except retail trade (Table 3 and Appendix B). This finding has particularly important implications for structural transformation in a country like Ethiopia, which can only count on a small manufacturing sector.
Table 3 Average ETRs by sector All years 2013/14 All sectors 11 13 Agriculture 7 8 Industry 12 14 Services 11 13
Top 5 disaggregated sectors:
Other services 12 16
Import/export 13 12
Wholesale trade 13 12
Manufacturing 13 16
Construction 11 12
Note: Authors’ calculations based on data from ERCA for 2012/13 (core sample).
4.3 Regression analysis
Although the descriptive results presented so far are strongly suggestive, they only represent partial relations. They are therefore tested in a multivariate regression using the panel data methods described in Section 3.3, namely the between estimator (BE) and the fixed effects model (FEM).
Estimates based on the BE show how the explanatory variables affect ETR across firms. The first column of Table 4 reports estimates from a basic model including the variables that are available for all firms. The main result is a strong confirmation of the descriptive finding of a U-shaped relation between the ETR and size: the coefficient of size has a negative sign, while the one on size squared is positive – both significant at the 1 per cent level. Notably, size’s coefficients suggest a very large effect, with a 1 per cent increase in size for small firms associated with about 2.6 percentage points lower ETR.35 However, the size
coefficient’s magnitude is halved in Column 2, where leverage and capital intensity are added to the basic model. Adding these variables also results in a smaller sample size. To check whether the reduction in the effect of size is due to the additional variables or to the different sample, Column 3 re-estimates the basic model of Column 1, but using the restricted sample of Column 2. By doing this, it confirms that the size coefficient has a magnitude of about four in the restricted sample, even if leverage and capital intensity are not included. In all cases, the U-shaped relation between size and the ETR is confirmed as being statistically significant and robust to the inclusion of other variables.
35 The interpretation of coefficients is not straightforward with a quadratic relation, as it would need to take into account
Table 4 BE regression results (1) (2) (3) Size -8.49*** -3.88*** -4.45*** (-42.31) (-14.53) (-16.24) Size^2 0.29*** 0.16*** 0.17*** (37.30) (16.43) (17.43) Export -2.99*** -3.57*** -3.55*** (-7.36) (-9.85) (-9.53) Public 0.13 0.50 0.14 (0.15) (0.63) (0.17) Agriculture -1.98*** -2.54*** -2.81*** (-4.23) (-5.27) (-5.67) Industry 0.46** -0.25 -0.90*** (2.64) (-1.32) (-4.70) Young 2.15*** -0.10 0.68** (9.28) (-0.43) (3.03) Old 1.56*** 1.02*** 0.82** (4.78) (3.50) (2.72) Leverage -0.03*** (-10.09) Capital Intensity -0.06*** (-24.42) Constant 71.01*** 36.11*** 38.10*** (53.47) (19.30) (19.81)
Region Dummies Yes Yes Yes
N 49863 32426 32426
adj. R2 0.183 0.103 0.050
Notes: the dependent variable is always the effective tax rate; t statistics in parentheses; * p < 0.05, ** p < 0.01, *** p < 0.001; t statistics in parentheses. Column 1 is estimated using the full sample, Columns 2 and 3 using the restricted sample for which balance sheet variables are available.
As far as sectors are concerned, the descriptive results are broadly confirmed in the BE estimation. More specifically, the agricultural sector is always taxed less than the comparator sector, services. While the industrial sector seems to face a higher tax burden (Column 1), this coefficient is reversed once other variables are included (Column 2) or in the restricted sample (Column 3). To get more detailed insights into sectoral differences, we also estimate an alternative set of regressions, reported in Appendix C, using the top five disaggregated sectors. All the five top sectors, including manufacturing, face higher tax burdens than the rest of the economy, which is the aggregate omitted category. This result is robust to the inclusion of additional variables and valid in all samples.
Other variables have the expected sign: negative and significant at the 1 per cent for export, leverage and capital intensity. In particular, the negative effect of leverage can be interpreted as the preference of debt over equity in the tax system. The two dummies on age show that both young and old firms generally face higher tax burdens,36 compared with the excluded
category of firms aged five to ten years; this result is more significant for older firms. The coefficients of region dummies are not included for simplicity,37 but they are all negative and
significant, which is to be interpreted against the excluded group of firms registered in Addis Ababa. The results therefore suggest that being located outside the capital city is associated
36 Young firms are less than 5 years old, while old ones are more than 10 years old, as reported in Appendix A.
with a lower tax burden, which is consistent with the legal provisions for longer tax holidays in the regions and lower enforcement pressure there. Public sector ownership does not seem to influence the ETR.
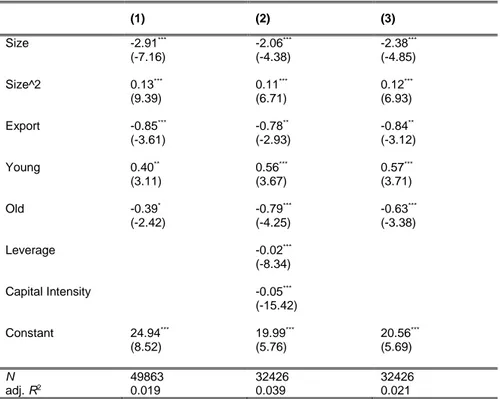
Finally, Table 5 reports the results from the FEM regressions. The most notable finding is that the U-shaped relation between ETR and size is also valid within firms, in addition to explaining variations between them (BE results). As firms grow, they experience first a decline in the ETR and then an increase. In this case the magnitude of the effect is relatively small compared to the BE results, but still substantial: a 1 per cent increase in size for small firms is associated with a decrease in ETR of 0.4 percentage points.38 Other results are also
confirmed, such as the negative and significant effects on export, leverage and capital intensity.
Table 5 FEM regression results
(1) (2) (3) Size -2.91*** -2.06*** -2.38*** (-7.16) (-4.38) (-4.85) Size^2 0.13*** 0.11*** 0.12*** (9.39) (6.71) (6.93) Export -0.85*** -0.78** -0.84** (-3.61) (-2.93) (-3.12) Young 0.40** 0.56*** 0.57*** (3.11) (3.67) (3.71) Old -0.39* -0.79*** -0.63*** (-2.42) (-4.25) (-3.38) Leverage -0.02*** (-8.34) Capital Intensity -0.05*** (-15.42) Constant 24.94*** 19.99*** 20.56*** (8.52) (5.76) (5.69) N 49863 32426 32426 adj. R2 0.019 0.039 0.021
Notes: the dependent variable is always the effective tax rate; all region dummies except Addis Ababa are included in the regression, but only significant results are reported; t statistics in parentheses; * p < 0.05, ** p < 0.01, *** p < 0.001; t statistics in parentheses. Column 1 is estimated using the full sample, Columns 2 and 3 using the restricted sample for which balance sheet variables are available.
4.4 Interpretation of results and other supporting evidence
The findings in the previous two sections draw a largely consistent picture of corporate taxation in Ethiopia. The most notable result is the U-shaped relation between size and ETR, indicating that small firms face the highest burden, while large firms still pay more than middle-sized firms – this latter group being the one that experiences the lowest tax burden. The same pattern occurs both across firms (BE) and within firms (FEM).
The reasons explaining the relatively higher tax burden for small firms and, to a lesser extent, larger firms are likely to be different. On the one hand, it is possible that small firms are not able to fully exploit the tax code to their benefit, because they do not have enough resources to produce full books of accounts and keep the necessary records. They are unlikely to be able to afford good accountants who could help them to minimise their tax, even within the limits of the law. As a result they pay more that they could, and therefore face a higher tax
burden. However, as they grow they can tackle some of these challenges and obtain a lower tax burden. This interpretation is supported by the literature on compliance costs, which have been shown to be particularly high for small firms (Coolidge 2012).
On the other hand, large firms have vast resources to dedicate to tax minimisation. They do not suffer from the same constraints as small firms. However, as discussed in Section 4.2, large corporations are major contributors to the public purse. Therefore, they are under great scrutiny by the tax authority, and are likely to face higher enforcement pressure. Moreover, they are highly visible, not least because they are more likely to access formal financial markets. Although we do not have information on access to the financial sector, the
distribution of our leverage variable across size deciles offers a first indication. Large firms in the top decile rely more heavily on debt, with a mean value of leverage of 56 per cent
compared to 34 per cent in the first decile. Although large corporations are able to minimise their tax more than small firms, and indeed face a lower ETR, they cannot push tax planning too far because they are very visible, which may explain why their ETR is higher than middle-sized firms.
Although this is certainly a speculative interpretation, it has some foundation in our data. In particular, Graph 3 shows the average deductions to turnover ratio across size deciles.39
Although this is a rough measure, it is striking that its pattern closely mirrors the U shape of ETR in Graph 2. Middle-sized firms around decile four, which face the lower ETR (see Graph 1), also have the highest ratio of expenses to turnover, around 40 per cent. This relation between expenses and size does not seem to have a clear economic justification. Instead, we believe that it reflects reporting behaviour, rather than real economic behaviour. Small firms may appear to have relatively less expenses because they may not report them to the revenue authority, not necessarily because they actually experience a lower expense to turnover ratio. Similarly, medium-sized firms report more expenses, but this may not
necessarily reflect the reality of their economic activity. Indeed the compliance literature has shown that firms may adjust their tax returns along less visible margins, like business
expenditure, to minimise their taxes (Carrillo et al. 2014; Slemrod et al. 2015). Expenditure is particularly hard to verify by the tax authority, because they are unlikely to be tracked through third party information or other tax records (like VAT records for turnover). Therefore, it is plausible for expenditure inflation to be an important mechanism for reducing taxable income. Graph 3: Deductions to turnover ratio
Note: Authors’ calculations based on ERCA data for 2013/14.
The data from ERCA does not allow us to carry out a much more detailed analysis of
deductions, because only a few firms file detailed information on what these deductions are –
which confirms the previous point about the difficulty in verifying them. However, for those firms that report disaggregated expenditure data to ERCA, the category ‘other expenditure’ represents about 20 per cent of the total, and is the largest component along with wages. Notably, anything reported as ‘other expenditure’ is even harder for the revenue authority to verify, and therefore potentially safer for firms to inflate. Others in the tax compliance literature have made the same argument (Carrillo et al. 2014; Slemrod et al. 2015).
To further test the role of deductions in explaining the relation between tax burden and size, we tried to incorporate this variable in an auxiliary regression. The results of this test are reported in Appendix D. Once deductions are controlled for, the coefficient of size is
dramatically reduced in magnitude, although it remains statistically significant. This suggests that much of the effect of size is due to expenditure, which therefore seems to be a plausible explanation for its relation with the ETR.
Finally, we can consider a possible coping mechanism that small firms may adopt to mitigate their relatively high tax burden: payment non-compliance. Since the tax authority does not have the capacity to enforce the tax law uniformly across firms, it may focus on those who have more potential to generate revenue – large taxpayers. Therefore, small taxpayers may be able to avoid or delay paying tax, even if they have a positive tax liability, thanks to weak enforcement. Payment non-compliance is only one of at least four possible aspects of tax compliance, which also include: registration, filing and doing so in time, and reporting the correct amount of income.40 We measure a payment compliance gap based on the difference
between tax paid and tax liability, normalised by gross profits. This evidence (reported in Appendix E) suggests that payment non-compliance happens to a larger extent for smaller firms. However, it appears to be a relatively small phenomenon in Ethiopia, and certainly not enough to compensate for the higher tax burden.
5 Conclusions
This paper looks at the tax burden on Ethiopian corporations, measured using effective tax rates. The analysis is based on an eight-year panel of administrative data from corporate tax returns. The use of this type of data for research represents an original contribution to the literature, and it is particularly innovative in the African context.
As stated in the Introduction, the main hypothesis tested in this paper is related to firm size, particularly testing whether large firms are able to exploit the tax code better than small firms. Our results confirm this hypothesis, but show a non-linear relation between ETR and size. While small firms face the highest tax burden, the largest firms still pay more than middle-sized firms. It is this latter group that benefits from lower tax burdens. Our interpretation of this U-shaped relation is that both small and large firms face constraints in minimising their taxes, but these constraints are fundamentally different. On the one hand, small firms do not have the capacity and resources to fully exploit the tax system. Therefore, they lose out. This is likely due to high compliance costs, since relatively small firms are required to file complex books of accounts under current Ethiopian law (see Sections 2 and 3). On the other hand, large firms are highly visible and under great scrutiny by the tax authority. Therefore, they face limits in the extent to which they can apply aggressive tax-minimising strategies. Although this interpretation is somewhat speculative, it is supported by the evidence and discussion of Section 4.4.
40 Some studies in the compliance literature (Hallsworth et al. 2014; Ortega and Scartascini 2015) have focused
particularly on payment compliance, with the advantage that it can be measured more accurately than non-compliance in terms of unreported income.
Importantly, the U-shape that emerges from the Ethiopian data is at odds with the findings of a key reference on tax burdens in Africa – by Gauthier and Reinikka (2006) – who find a reverse U-shape relation between size and tax burden. A direct comparison between these two opposite results is difficult because the two analyses differ in fundamental ways (see Section 1). The most notable difference is data: anonymised tax returns as opposed to the survey used by Gauthier and Reinikka. The main implication for the results is that the small firms included in the two datasets are likely to be very different: informal in their case, and formal, though still small, in our case. Therefore, our small firms face high compliance costs because they are part of the tax net, while fully informal firms are typically not even
registered. Although this illustrates the main drawback of administrative data (i.e. exclusion of fully informal firms), our results still speak to the effect of the tax system on those firms that pay taxes. By doing this, they can support policymakers in reforming the tax system to correct existing distortions – in this case, the fact that small firms pay relatively more. In addition, we believe our administrative data is more reliable because it captures real taxpaying behaviour. Surveys instead suffer from large potential deviations between responses and real behaviour. Although administrative data is still unable to fully capture evasion, it offers a more realistic evidence base. Despite these differences, our results remain in stark contrast with the conclusion of Gauthier and Reinikka (2006), and clearly call for more evidence to settle this inconsistency.
As far as policy recommendations are concerned, the most important element is the relatively high tax burden experienced by small corporations. The supporting evidence presented in Section 4.4 suggests that this is largely the result of high compliance costs: due to strict reporting requirements, small firms end up paying relatively more. This situation is related to the erosion of thresholds that define reporting requirements due to high inflation in Ethiopia in t