PAVEMENT MANAGEMENT SYSTEMS: INTEGRATION OF
TRANSPORTATION MODELING, LAND USE, ECONOMY AND
INDICATORS OF DEVELOPMENT
Md. Shohel Reza Amin
A Thesis In the Department
of
Building, Civil and Environmental Engineering
Presented in Partial Fulfillment of the Requirements For the Degree of
Doctor of Philosophy (Civil Engineering) at Concordia University
Montreal, Quebec, Canada October 2015
CONCORDIA UNIVERSITY SCHOOL OF GRADUATE STUDIES
This is to certify that the thesis prepared
By: Md. Shohel Reza Amin
Entitled Pavement Management Systems: Integration of Transportation Modeling, Land Use, Economy and Indicators of Development
and submitted in partial fulfillment of the requirements for the degree of Doctor of Philosophy (Civil Engineering)
Complies with the regulations of the University and meets the accepted standards with respect to originality and quality.
Signed by the final examining committee: _________________________ Chair Dr. Nabil Esmail _________________________ External Examiner Dr. Ming Zhong _________________________ External to Program Dr. Amin Hammad _________________________ Examiner Dr. Osama Moselhi _________________________ Examiner Dr. Ciprian Alecsandru _________________________ Thesis Supervisor Dr. Luis Amador Approved by ________________________________________________ Chair of Department or Graduate Program Director
________________________________________________ Dean of Faculty
iii
Abstract
Pavement Management Systems: Integration of Transportation Modeling, Land Use, Economy and Indicators of Development
Md. Shohel Reza Amin, Doctor of Philosophy, Concordia University, 2015
The physical condition of road infrastructure in Canada is not good and roads are in critically condition in many regions. Canadian transportation agencies still require a comprehensive pavement management system (PMS) to guide and recommend the best practices for their appropriate application and communication. The general objective of this research is to extend PMS by incorporating dynamic states of land use, regional economics, travel modeling, and socio-economic development criteria. The specific objectives at regional scale is to integrate regional economy, transport modeling and community development criteria to simulate freight-traffic distribution between Atlantic Provinces of Canada to improve pavement-deterioration modeling and overall province-wide PMS. The specific objective at urban scale is to develop PMS for the road network of Montreal city incorporating simulated traffic and measurement errors free pavement performance curves. Comparison of current practices and proposed PMS based on simulated truck traffic reveals that incorporation of simulated truck traffic into PMS resulted in a more accurate estimation of required levels of funding for maintenance and rehabilitation (M&R). Socio-economic factors of the communities of Atlantic Provinces of Canada are integrated with regional economy and transportation modeling to support multi-criteria based PMS considering that policy makers are not only guided by the engineering characteristics but also by socio-economic benefits of the communities to allocate M&R budget. With and without scenarios of community development criteria into PMS have different implications on M&R budgets. The Backpropagation Neural Network (BPN) method with Generalized Delta Rule (GDR) learning algorithm is applied to develop pavement performance curves for Montreal road network reducing the measurement errors. Finally, a linear programming of PMS is developed for Montreal city incorporating the simulated traffic and
iv
pavement performance curves developed by BPN networks. Lifecycle optimization of PMS estimates that CAD 150 million is the minimum annual budget to achieve most of arterial and local roads are at least in good condition (PCI>70) in Montreal city. This research will provide the transportation agencies with an improved decision-making framework capable of delivering a more balanced M&R budget for the achievement of global objectives, such as cost, condition, service, accessibility, and community benefits.
v
Acknowledgements
First and foremost all praises belong to Almighty God, the most merciful, most kind and generous to mankind.
I want to thank my advisor Dr. Luis Esteban Amador-Jiménez. I appreciate all his contributions of time, ideas, and funding to make my Ph.D. experience productive and motivating. Dr. Amador-Jiménez gave me the freedom to carry on my research, at the same time continuing to contribute valuable feedbacks, advices, and encouragement. In addition to our academic collaboration, I greatly value the close personal relationship that Dr. Amador-Jiménez and I have developed over the years.
I would like to thank Ville de Montréal for providing data on pavement condition of Montreal road network. I extend my special thanks to Nathalie Oum (Direction de la Gestion Stratégique des Réseaux d'Eau, Unité Plan directeur, Ville de Montréal) for helping me to get data from Ville de Montréal.
I would like to thank my beloved wife Umma Tamima. I cannot think of completing my Ph.D. degree without her relentless supports. Her support, encouragement, quiet patience and unwavering love were undeniably the bedrock upon which the past ten years of my life have been built. Her tolerance of my occasional impatience and frustration is a testament in itself of her unyielding devotion and love.
I am sincerely thankful of my kind, caring and wonderful parents who have always supported me in all aspects of my life even from a long distance.
Finally, and most importantly, I am blessed with a daughter (IBTISAM ZUNAIRAH AMIN) on January 2015. I am thankful to my daughter allowing me to write the thesis when she used to sleep on my lap and encouraging me with heavenly smiles.
vi
Table of Contents
List of Tables ... x
List of Figures ... xii
List of Abbreviations ... xiv
Chapter 1 Introduction ... 1
1.1. Background ... 1
1.2. Problem statement ... 4
1.3. Objectives ... 5
1.3.1. General Objective ··· 5
1.3.2. Specific Objectives at regional scale ··· 5
1.3.3. Specific Objectives at urban scale ··· 5
1.4. Tasks ... 5
1.4.1. Tasks for Specific Objectives at regional scale ··· 5
1.4.2. Tasks for Specific at urban scale ··· 6
1.5. Expected contributions... 6
1.6. Limitations and scope for future research work ... 7
1.7. Organization of the thesis ... 8
Chapter 2 Discussion on Road Infrastructure Management Practices ... 10
Abstract ... 10
2.1. Introduction ... 10
2.2. United States approaches ... 12
2.2.1. Arizona Department of Transportation (ADOT) ··· 12
2.2.2. Ohio Department of Transportation (ODOT) ··· 12
2.2.3. Michigan Department of Transportation (MDOT) ··· 13
2.2.4. Minnesota Department of Transportation (MnDOT) ··· 14
2.2.5. Georgia Department of Transportation (GDOT) ··· 14
2.2.6. Florida Department of Transportation (FDOT) ··· 16
2.2.7. California Department of Transportation (Caltrans) ··· 16
2.2.8. Pennsylvania Department of Transportation (PennDOT) ··· 16
2.2.9. North Dakota Department of Transportation (NDDOT) ··· 17
2.3. Canadian approaches ... 17
2.4. Australian approaches ... 18
2.4.1 Australian Local Government Association (ALGA) ··· 18
2.4.2 Western Australia Local Government Association (WALGA) ··· 19
2.4.3 Queensland Road Alliance (QLDRA) ··· 19
vii 2.6. Portuguese approach ... 20 2.7. Japanese approaches ... 21 2.8. Polish approaches ... 21 2.9. Comparative evaluation ... 21 2.10. Conclusion ... 25
Chapter 3 Pavement Management System (PMS) ... 27
Abstract ... 27
3.1. Introduction ... 28
3.2. Measurement of the road infrastructure productivity ... 29
3.3. Studies on life-cycle cost analysis (LCCA) ... 30
3.4. Project-based PMS: can it be an alternative to network-based PMS? ... 32
3.5. Pavement performance modelling ... 33
3.5.1 Methods of pavement performance modelling ··· 34
3.5.2. Uncertainty with pavement performance curve ··· 37
3.6. Dynamic programming process of pavement management system ... 38
3.6.1. Road user costs of pavement management system ··· 39
3.6.2. Drawbacks of Markov decision process ··· 41
3.6.3. Drawbacks of project-based pavement management system and existing practices to deal with these problems ··· 41
3.6.4. Multi-criteria pavement management system ··· 43
3.7. Conclusion ... 44
Chapter 4 Pavement Performance Modeling ... 46
Abstract ... 46
4.1. Introduction ... 47
4.2. Deterministic Pavement Performance Modeling ... 47
4.3. Stochastic Pavement Performance Modeling ... 54
4.4. Transition from Deterministic to Stochastic Performance Modeling ... 55
4.5. Drawbacks of Markov Decision Process (MDP) ... 56
4.6. Backpropagation Neural Network for Dealing with Uncertainties ... 57
4.7. Reliability Analysis of the Traffic Data and estimated pavement deterioration .... 63
4.8. Conclusion ... 64
Chapter 5 Methodology ... 65
5.1. Introduction ... 65
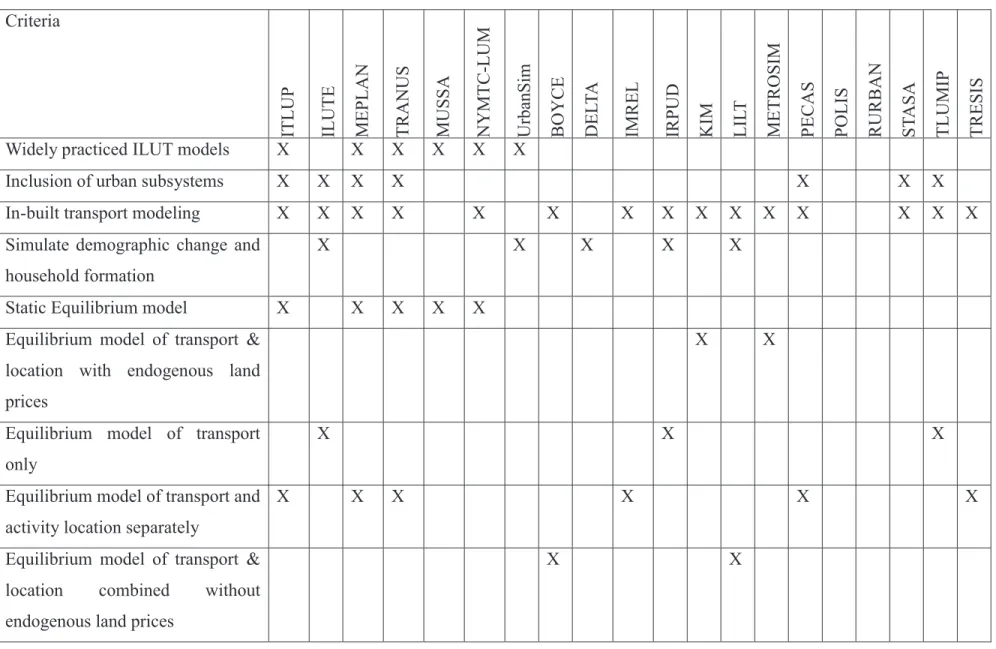
5.2. Integration of land use and transportation (ILUT) models ... 65
5.2.1. TRANUS – integration of spatial input-output and transportation models at regional scale ··· 70
viii
5.3. Pavement performance modeling ... 73
5.3.1. BPN for estimating pavement deterioration of urban road network ··· 73
5.3.2. Pavement performance modeling for regional road network ··· 77
5.4. Life-Cycle Optimization of PMS ... 77
Chapter 6 Simulating Freight Traffic between Atlantic Canada and Québec to Support Pavement Management on New Brunswick’s Regional Highways ... 79
Abstract ... 79
6.1. Background ... 80
6.2. Objective ... 81
6.3. Methodology ... 81
6.4. Mathematical Formulation for Pavement Management ... 82
6.5. Pavement Performance ... 83
6.6. Regional Spatial Economic Model ... 84
6.7. Case Study – The New Brunswick Road Network ... 88
6.8. Available Treatments for Pavements ... 94
6.9. Results and Discussion ... 95
6.10. Conclusions ... 100
Chapter 7 The Multi-Criteria Based Pavement Management System for Regional Road Network in Atlantic Provinces of Canada ... 102
Abstract ... 102
7.1. Introduction ... 102
7.1.1. Background ··· 102
7.1.2. Objective ··· 103
7.2. Methodology ... 103
7.2.1. Spatial Input-Output (SIO) Modeling ··· 104
7.2.2. Pavement Performance Modeling ··· 105
7.2.3. Community Development Indicator (CDI)··· 106
7.2.4. Optimization of Pavement Management ··· 107
7.3. Prediction of trade flow and freight movement ... 109
7.4. Pavement maintenance operations ... 110
7.5. The multivariate analysis of community development indicator ... 112
7.6. Multi-criteria index of pavement maintenance operations ... 115
7.7. Conclusion ... 120
Chapter 8 Application of Backpropagation Neural Network Dealing with Uncertainties in the Pavement Performance Modeling ... 122
Abstract ... 122
ix
8.2. Pavement Performance Models Dealing with Uncertainties ... 124
8.3. Objective ... 125
8.4. Methodology ... 125
8.3.1. Data Collection ··· 125
8.3.2. Learning Process in the Backpropagation neural network ··· 129
8.5. Data analysis ... 134
8.5.1. Back Propagation Neural Network Performance ··· 134
8.5.2. Parameter Estimation of Input Variables ··· 135
8.6. Conclusion ... 143
Appendices ... 146
Chapter 9 Improving Pavement Performance Modeling: a case study of Montreal ... 148
Abstract ... 148
9.1. Introduction ... 148
9.2. Methodology ... 151
9.2.1. Simulation of traffic loads ··· 151
9.2.2. Pavement performance modeling ··· 154
9.2.3. Linear programming of pavement management system (PMS) ··· 156
9.3. Data Analysis ... 157
9.3.1. Simulation of traffic loads ··· 157
9.3.2. Pavement performance modeling ··· 165
9.4. Conclusions ... 175
Chapter 10 Conclusions ... 177
x
List of Tables
Table 2.1: Infrastructure Management-Process Maturity Model (IM-PMM) framework for
evaluating the maturity of RIAMS practices ... 23
Table 5.1: Comparative evaluation of different land use and transportation modeling ... 68
Table 6.1: Attraction of provinces during the period of 2012-2031 ... 86
Table 6.2: Demand function for sectors in 2012, 2021 and 2031 ... 87
Table 6.3: Calculation of peak capacity ... 89
Table 6.4: Operating cost components ... 91
Table 6.5: Fixed cost for 6-axle truck (160000 km) ... 91
Table 6.6: Consumption and expenditure of energy by truck for particular speed ... 92
Table 6.7: Total demand ( ) and production ( ) in millions of dollars ... 93
Table 6.8: Weekday daily light truck trip generation rates (Fontana CA)... 94
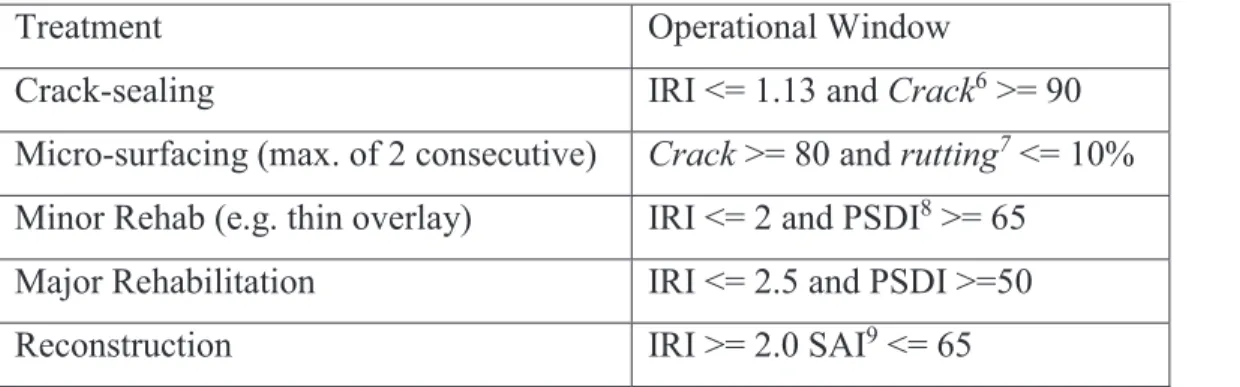
Table 6.9: Treatment and Operational Windows Used in Network-level Trade-off Analysis ... 95
Table 6.10: Results from the simulation of TRANUS ... 96
Table 6.11: Predicted ESALs per year for New Brunswick regional highways ... 97
Table 7.1. Treatment and operational windows used in network-level trade-off analysis ... 106
Table 7.2: Pavement surface treatments of selected highways (km) ... 112
Table 7.3: Total variance explained by the factors ... 113
Table 7.4: Rotated component matrix of the variables for CDI ... 115
Table 8.1: Distribution and Truck Factor (TF) of commercial vehicles on the road network of Montreal city ... 128
Table 8.2: Error Estimation of Backpropagation Neural Network Models ... 134
Table 8.3: Parameter estimation of the independent variables of PCI for Flexible pavements .. 138
Table 8.4: Parameter estimation of the independent variables of PCI for Rigid pavements ... 141
Table 8.5: Importance of input variables to estimate PCI values in BPN networks ... 143
Table 9.1: Estimated effects of explanatory variables on trips per household during peak and off-peak hours ... 158
Table 9.2: Estimated utility function of choosing different modes ... 161
Table 9.3: Traffic volume on different road segments of Montreal city during 2008 and 2013 ...
xi
Table 9.4: Distribution and Truck Factor (TF) of commercial vehicles on the road network of Montreal city ... 164 Table 9.5: Treatment and Operational Windows Used in Network-Level Trade-Off Analysis ...
xii
List of Figures
Figure 1.1: The activities-based framework of the PMS ...3
Figure 6.1: Relationship between production and consumption ...85
Figure 6.2: Predicted Roughness (IRI) trends for scenarios ILUTTAM and MAX $25M ...98
Figure 6.3: Qualitative Levels of Service (Road Condition) ...99
Figure 6.4: Distribution of Expenditure per Route (in millions CAN$) ...100
Figure 7.1. Total demand and production of five provinces ...109
Figure 7.2: International Roughness Index for moisture index of 60, 80 and 100 ...111
Figure 7.3: Distribution of Expenditure for M&R operations (in millions CAN$) ...116
Figure 7.4: Proportion of M&R operations for different highways ...117
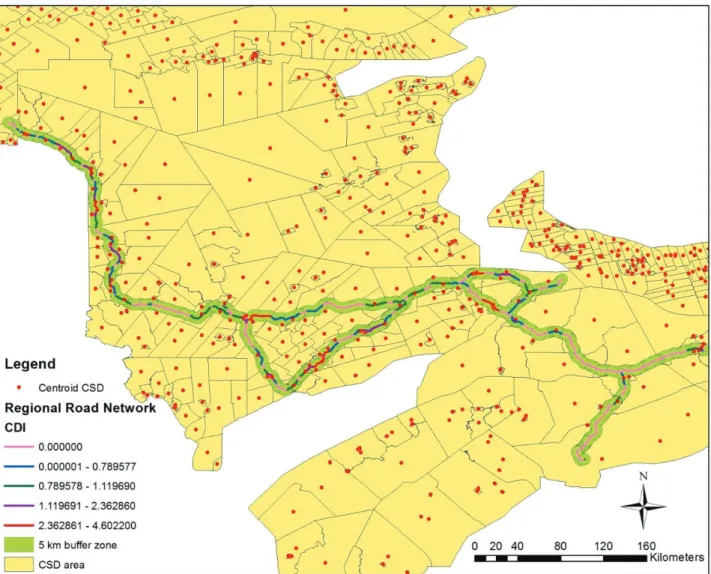
Figure 7.5: Community Development Index map of the regional road network ...118
Figure 7.6: Projection of pavement treatment operations during the period of 2012-2041 ...119
Figure 7.7: Projection of annual budget distributions for different treatment operations ...119
Figure 8.1: Pavement Condition Index (PCI) of the road network in the Montreal City ...127
Figure 8.2: BPN network diagram for flexible pavement ...129
Figure 8.3: BPN network diagram for rigid pavement ...130
Figure 8.4: Hypothetic scenario of pavement deterioration with or without treatment operations139 Appendix 8.A: Predicted-by-observed scatterplot of Pavement Condition Index (PCI) ………146
Appendix 8.B: Residual-by-predicted scatterplot of Pavement Condition Index (PCI) values..147
Figure 9.1: Flow chart of methodology ...153
Figure 9.2: Simulated origin-destination map of traffic flow in 2013 ...160
Figure 9.3: Simulated 50-percentile AADT for different road categories during the period of 2009-2058 ...163
Figure 9.4: Simulated 50-percentile ESALs (million) for different road categories during the period of 2009-2058 ...165
Figure 9.5: Pavement performance curves for different road categories during the period of 2009-2058...167
Figure 9.6: Predicted conditions of roads after treatment operations under annual maintenance budget of CAD 150 million ...171
xiii
Figure 9.7: Predicted conditions of roads after treatment operations under annual maintenance budget of CAD 125 million ...171 Figure 9.8: Predicted conditions of roads after treatment operations under annual maintenance budget of CAD 175 million ...172 Figure 9.9: Distribution of annual maintenance budget (CAD $150 million) among rigid and flexible pavements ...173 Figure 9.10: Distribution of annual maintenance budget for different treatment operations of flexible pavements ...173 Figure 9.11: Distribution of annual maintenance budget for different treatment operations of rigid pavements ...174
xiv
List of Abbreviations
AADT ... Annual Average Daily Traffic AADTT ...Annual Average Daily Truck Traffic AASHTO ... American Association of State Highway and Transportation Official ADOT ... Arizona Department of Transportation AHP... Analytical Hierarchy Process ALGA ... Australian Local Government Association AON ... All-or-Nothing ANN ... Artificial Neural Network APAS ... Action de Préparation, d’Accompagnement, et de Suivi
ASU... Arizona State University BCR... Benefit-Cost Ratio BIC ... Bayesian information criterion BMS ... Bridge Management System BPN ... Backpropagation Neural Network BPR ... Bureau of Public Roads Caltrans ... California Department of Transportation CDI ... Community Development Indicator CLPL ... Candidate Locations Priority List CMA ... Census Metropolitan Area COPACES... Computerized Pavement Condition Evaluation System CRC...Cooperative Research Centre CRCI ... Condition Ride Comfort Index CSD ... Census Subdivision DI ... Distress Index DOT ... Department of Transportation DRAM... Disaggregated Residential Allocation Model DSS ... Decision-Support System DUE ... Deterministic User Equilibrium ELECTRE ... Elimination et Choix Traduisant la Realité
xv
EMPAL ... Employment Allocation Model ESALs ... Equivalent Single Axle Loads FDOT ... Florida Department of Transportation FHWA ... Federal Highway Administration FWD ... Falling Weight Deflectometer GA ... Genetic Algorithm GDOT ... Georgia Department of Transportation GDR ... Generalized Delta Rule GHG ... greenhouse gas GIS ... Geographic Information System H-Index ... Herfindahl index HMA ... Hot Mix Asphalt HDM ... Highway Design and Maintenance Model HLM ... habitation à loyer modéré HMMS ... Highway Maintenance Management System HSOP ... Highway System Operations Plan ILUT ... Integrated Land Use Transportation ILUTTAM. Integrated Land Use and Transport for Transportation Asset Management IM-PMM ... Infrastructure Management-Process Maturity Model IMREL ... Integrated Model of Residential and Employment Location IOWADOT ... Iowa Department of Transportation IPWEA ... Institute of Public Works Engineering Australia IRI ... International Roughness Index ISO ... International Standardization Organization ISTEA ... Intermodal Surface Transportation Efficiency Act ITS... Intelligent Transportation System ITLUP ... Integrated Transportation Land Use Package ILUTE ... Integrated Land Use, Transportation, Environment modeling system KBS ... Knowledge-Based System LCCA ... Life-Cycle Cost Analysis LEF ... Load Equivalency Factor
xvi
LILT ... Leeds Integrated Land Use- Transport LOS ... level-of-service LRRS... Local Roads of Regional Significance LUT ... Land Use & Transport Modeling MCA ... Multicriteria Analysis MCI ... Maintenance Control Index MDP ... Markov Decision Process MDOT ... Michigan Department of Transportation MLP ... Multi-Layer Perceptron MMS ... Maintenance Management System MnDOT ... Minnesota Department of Transportation MNL ... Multinomial Logit M&R ... Maintenance and Rehabilitation MRP ... Maintenance Rating Program MRWA ... Main Roads Western Australia MUC ... Montreal Urban Community MUSSA ... Modelo de Uso de Suelo de Santiago NCHRP ... National Cooperative Highway Research Program NDOT ... Nevada Department of Transportation NDDOT... North Dakota Department of Transportation NLRDS ... National Local Roads Database System NYMTC-LUM ... New York Metropolitan Transit Commission- Land Use Model NZTA ... New Zealand Transport Agency OBNL ... organisme à but non lucrative ODOT ... Ohio Department of Transportation OECD ... Organisation for Economic Co-operation and Development OPAC ... Ontario Pavement Analysis of Costs PCA ... Principal Component Analysis PCC ... Portland Cement Concrete PCEs ... Passenger Car Equivalents PCI ... Pavement Condition Index
xvii
PECAS ... Production, Exchange and Consumption Allocation System PLR ... Polynomial Linear Regression PennDOT ... Pennsylvania Department of Transportation POLIS ... Projective Optimization Land Use Information System PMS ... Pavement Management System PPS&O ... Pavement Performance Simulation and Optimization PQEM ... Pavement Quality Evaluation Model PQI ... Pavement Quality Index PRISM... Pavement Rehabilitation and Improvement Strategic Model PRP ... Program and Resource Plan PSI ... Present Serviceability Index QLDRA ... Queensland Road Alliance RAMM ... Road Assessment and Maintenance Management RCI ... Roadway Characteristics Inventory RDI ... Regional Development Indicator RE ... Relative Error RIAMS ... Road Infrastructure Asset Management System RIDB ... Roadway Information Data Base RPP ... Rehabilitation Project Prioritization RQFS... Roadway Quality Forecasting System RQI ... Ride Quality Index RRGs ... Regional Road Groups RSL ... Remaining Service Life RSMS ... Road Surface Management System RURBAN ... Random-Utility Urban SAI ... Standard Application Inquires SIO ... Spatial Input-Output SNC ... Structural Number Coefficient SO ... System Optimum SSE ... Sum of Squares Error STIP ... State Transportation Improvement Program
xviii
SUDI ... Sustainable urban development Indicator SUE ... Stochastic User Equilibrium TAC... Transportation Association of Canada TARUT ... Transportation Application of Restricted Use Technology TAZs ... Traffic Analysis Zones TF ... Truck Factor TFCP ... Transportation Facilities Construction Program TPM ... Transition Probability Matrix TRESIS ... Transportation and Environment Strategy Impact Simulator UTPS ... Urban Transportation Planning System VII ... Vehicle Infrastructure Initiative WALGA ... Western Australia Local Government Association
1
Chapter 1
Introduction
1.1. Background
The pavement management system (PMS) is an approach that incorporates the economic assessment of trade-offs between competing alternatives at both the network and project levels (Ouertani, et al., 2008). A PMS can provide an organized methodology to assist decision makers at all management levels with strategies derived through clearly established rational procedures (Hudson, et al., 1979). The idea behind the PMS is to improve efficiency of decision making, expand its scope, provide feedback as to the consequences of decisions, and ensure consistency of decisions made at different levels within the same organization. A complete PMS has applications in virtually every division within a transportation agency (Peterson, 1987).
The PMS integrates and simulates the pavement activities with roadways evaluation; and achieves the optimum use of available funds by comparing investment alternatives and coordinating design, construction and maintenance. In other words, a PMS systematically integrates the activities relating to data collection, processing and analysis; identification of current and future needs; and development of rehabilitation and maintenance programs to implementation of the programs through design, construction and maintenance (Haas & Hudson, 1987). This ensures a safe, comfortable and economic transportation. The 1986 AASHTO
‘Guide for Design of Pavement Structures’ states that ‘pavement management in its broadest
sense encompasses all the activities involved in the planning, design, construction, maintenance,
evaluation, and rehabilitation of the pavement portion of a public works program’ (Allen, et al., 1992).
The methodology of the PMS uses the prediction models to estimate the structural and functional deteriorations of the pavement. The PMS methods consider both the historic pavement performance data and engineering considerations. The materials in the pavement layers, and their degradation under the effects of time and loading, are of primary concerns to those highway engineers responsible for the maintenance and performance of the pavement network (Ullidtz & Stubstad, 1992). Therefore, the pavement performance modeling by extrapolating future condition from historical data is a technically unacceptable simplification because the effects of
2
material degradation, maintenance, or rehabilitation measures cannot be considered (Ullidtz & Stubstad, 1992).
The overall structure and the logical sequences of the activities of a PMS can be outlined by Figure 1.1. This activities-based framework of the PMS assumes that route selection, feasibility studies and functional planning of the highway or street have already been conducted (Roads and Transportation Association of Canada, 1977). There are five phases in the PMS framework – planning or programming, design, construction, maintenance and in-service evaluation.
The planning or programming phases includes the acquisition of dynamic traffic load data, an assessment of the deficiencies on a network basis, the establishment of priorities, the development of a schedule for carrying out the needed works, and the determination of any extra property required. The basic investment decisions within the budget constraints are taken in this phase (Roads and Transportation Association of Canada, 1977).
The design phase initially acquires data on the pavement materials, traffic loads of different categories of vehicles, and costs, etc. The alternative designs are developed, analyzed and compared with respect to their costs and benefits. Finally, the best alternative is selected for construction. The construction phase includes specifications and contracts, work scheduling, construction operations, quality control, and processing of data (Roads and Transportation Association of Canada, 1977).
3
Figure 1.1: The activities-based framework of the PMS
The maintenance phase includes the establishment of a standard program and schedule within the budget constraints, the Maintenance and Rehabilitation (M&R) operations, and the acquisition and processing of data (Roads and Transportation Association of Canada, 1977).
The in-service evaluation of pavements includes the establishment of control selections, the periodic measurement of the pavement structural capacity, roughness, condition, and skid resistance under dynamic traffic loads. It also includes the input data, which are stored in the data bank, for use in the other cycle of the PMS (Roads and Transportation Association of Canada, 1977).
The PMS framework has separately identified the data bank to emphasize its central role as an information base for all activities. Data banks can range from simple manual record files to sophisticated computer systems. The importance of research as a major phase of the pavement management system depends largely upon the available resources and the particular requirements of each transportation agency (Roads and Transportation Association of Canada, 1977).
Planning or Programming
Design Construction Maintenance In-service Evaluation Information Information Data Bank Research
‘Working’ management Loop
4 1.2. Problem statement
Internationally, the practices of PMS are moving from condition-based approaches towards service-based approaches focusing more on customer-driven priorities. A service-based approach that expands traditional condition-based methods has to be balanced against the budget constraint, level of service and risk tolerance. However, transportation agencies have not yet address how dynamic traffic loads vary during the life-span of the pavement as a result of the economic evolvement. Currently, capital investments are somehow disconnected from PMS and must be fully incorporated within the decision making framework. Even though some research has looked into uncertainty, few state of the practice models incorporate it on the performance curves. The economic impact of multiple strategies (i.e., rehabilitation versus capital investments) for condition, congestion, pollution and social cost, has not been addressed. The perception of congestion combined with condition, highway capacity, and accessibility impact the personal choices of modes, routes and links (Donaghy and Schintler, 1998) and must be included in a wider PMS framework.
In most cases, the PMS is based on the Markov Decision Process (MDP) optimization method that has some limitations. The optimization programming of M&R strategies are calculated from the steady-state probabilities. However, in reality, the pavements under a given maintenance policy usually takes many years to reach the steady state and the proportion of the pavements are changing year by year. Therefore, the use of steady-state probabilities in the optimization objective function does not fully reflect reality, especially when this transition period is very long (Li, et al., 2006).
Transportation agencies usually minimize the agency and user costs; and maximize the pavement condition in the life-cycle cost optimization of the PMS. They are giving little attention on the effect of M&R strategies on the other road users such as residents in close proximity from the road, industrial settlements, trade centres, etc. (Cafiso, et al., 2002).
Transportation agencies should develop a performance-based PMS which ensures the serviceability, accountability, stewardship, long-term financial plans, transparent investments, and the betterment of the communities.
A framework that incorporates the states of land use, regional economies and trade flow, transportation modeling, pavement condition, environmental costs and socio-economic development indicators into the performance-based PMS is required.
5 1.3. Objectives
1.3.1. General Objective
The general objective of this research is to extend PMS by incorporating dynamic states of land use, regional economics, travel modeling, and socio-economic development criteria into pavement management systems.
There are two groups of specific objectives: one for regions and another for cities.
1.3.2. Specific Objectives at regional scale
i. To integrate regional economy and transport modeling at a regional scale to forecast freight-traffic distribution to improve pavement-deterioration modeling and overall province-wide PMS.
ii. To expand multi-criteria based PMS incorporating community development criteria.
1.3.3. Specific Objectives at urban scale
i. To develop pavement performance model for the road network of a city that integrates land use and transport modeling and reduces the measurement error of pavement performance model
ii. To develop a linear programming of PMS for the road network of a city that accommodates the simulated traffic during a long term period and deals with the measurement error of the pavement performance modeling.
1.4. Tasks
1.4.1. Tasks for Specific Objectives at regional scale
i. Collect data on historical pavement condition and regional economies.
ii. Estimate traffic flow on the regional networks of the Atlantic Provinces by integrating the spatial input-out and transportation models.
iii. Develop pavement performance curves
iv. Calculate the community development criteria for each census subdivision (CSD) of Atlatic Provinces of Canada.
6
v. Develop a multi-criteria PMS incorporating the regional economies, travel modeling, pavement performance, and community development criteria.
1.4.2. Tasks for Specific at urban scale
i. Collect data on the historical pavement condition, land uses, urban development and economic characteristics.
ii. Anticipate the traffic flow on the different road networks by applying travel demand model of urban transportation planning package (UTPS) during the period of 2009-2058.
iii. Apply the Backpropagation Neural Network (BPN) method with Generalized Delta Rule (GDR) learning algorithm for reducing the measurement errors of the pavement performance modeling.
iv. Develop pavement performance curves for flexible arterial, flexible local, rigid arterial and rigid local roads of Montreal city durng the period of 2009-2058.
v. Develop the linear programming of PMS for the road network of Montreal city that accommodates the simulated traffic during the period of 2009-2058 and deals with the measurement error of the pavement performance modeling
1.5. Expected contributions
This research provides new methods to address drawbacks of current transportation management systems. The input of the dynamic traffic loads resulted from the integration of Land Use and Transport Modeling into the PMS enables a significant improvement in the allocation of economic resources.
The periodic incorporation of the travel demand models into the PMS will not only make it accommodative to most growth-theory frameworks and distribution models, but also provide a better way of depicting ongoing aggregate behavior and a more satisfactory PMS (Donaghy and Schintler, 1998). The improved performance models of the PMS will reflect a more realistic measure of travel demand and trip redistribution, therefore, improving the user's satisfaction and ability to generate and support economical activities. The integration of these modeling frameworks represents the opportunity to deploy performance-based trade-off analysis (as oppose to lifecycle cost-benefit) for the monetary allocation of resources among competing
7
alternatives for maintenance and rehabilitation, safety retrofitting, mobility and accessibility improvements, network expansion and capital upgrades.
The inclusion of the community development criteria within the PMS addresses the effect of M&R strategies on other road users such as residents in close proximity from the road, industrial settlements, trade centres, etc. This helpes the transportation planner and policy makers to understand the positive impact of transport infrastructure maintenance on the community development.
Overall, the possible integration of these frameworks will represent the opportunity of a more comprehensive representation of the economic development of city and region. It will provide us with an improved decision-making framework capable of delivering a more balanced budget for the achievement of global objectives (cost, condition, service, accessibility, and pollution). The final product of this research should provide transportation authorities with the capacity to build alternative scenarios to assess the impact of policies intended to address major transportation issues such as pricing traffic congestion and to estimate the environmental impact of vehicle emissions. Ultimately, the research can be extended to cover all infrastructure systems and to identify viable means to estimate performance measures to be used to evaluate how well the infrastructure systems support urban and economic development strategies.
1.6. Limitations and scope for future research work
This study simulates the commercial and urban traffics based on the aggregate data of travel behavior. People travel in order to satisfy a need undertaking an activity at particular locations. This is equally significant for goods movements. In order to understand the demand for transport, we must understand the way in which these activities are distributed over space, in both urban and regional contexts. There is a whole range of specific demand for transport which are differentiated by time of day, day of week, journey purpose, type of freight transport, importance of speed and frequency, and so on. Transport demand modeling has very strong dynamic elements. Future study should develop a travel demand modeling considering disaggregate data and dynamic attributes of travel behavior.
Pavement deterioration is caused not only by vehicles induced deformations but to a large extent by the interaction of traffic and climate. Climate effects, particularly during spring-thaw cycles, must be addressed to attain comprehensive and long-term PMS in cold regions. Future
8
study should simulate the climate change and traffic growth and estimate the implications of climate change and traffic growth on PMS in cold region. This will have two-fold contributions to the currently practicing PMSs. First, it will accommodate the climate change induced seasonal variability in the traditional PMS for the road network of cold regions. Second, it includes dynamic traffic loads into PMS rather than simply based on anticipate traffic growth during the life-span of pavement structures.
1.7. Organization of the thesis
This dissertation is prepared into ten chapters as follows. Chapter 1 defines the problem and presents the objectives of the research and structure of the thesis. Chapter 2 discusses the practices of Road Infrastructure Asset Management System (RIAMS) adopted in different countries. This discussion mainly focuses on PMS. Chapter 3 discusses the methods of PMS and outlines a conceptual framework of a PMS that incorporates dynamic states of land use, traffic volumes, design capacities, and pavement conditions. Chapter 4 discusses various deterministic and stochastic approaches for calculating pavement performance curves. This chapter discusses the Backpropogation Artificial Neural Network (BPN) method with generalized delta rule (GDR) learning algorithm to reduce the measurement error of the pavement performance model. This chapter also argues for the application of reliability analyses dealing with the randomness of pavement condition and traffic data. Chapter 5 presents the methodology employed for the collection, processing and analysis of the data. Chapter 6 integrates the spatial input-output and transportation models to simulates freight traffic distribution in order to improve pavement deterioration modeling. A case study of trade flows between Canada’s Atlantic Provinces and
Quebec is used to show the pitfall of current management models to estimate rates of deterioration underfunding maintenance and rehabilitation strategies. Chapter 7 integrates the regional economy and socio-economic factors of communities with transportation to support multi-criteria based PMS for the regional road network of Atlantic Canada provinces. Chapter 8 applies the BPN method with GDR learning algorithm for reducing the measurement errors of the pavement performance modeling. The Multi-Layer Perceptron (MLP) network and sigmoid activation function are applied to build the BPN network. Local and arterial roads of both flexible and rigid pavements in Montreal City are taken as a case study. Chapter 9 develops the linear programming of PMS for the road network of Montreal City that accommodates the
9
simulated traffic during the period of 2009-2058 and deals with the measurement error of the pavement performance modeling. Chapter 10 includes the concluding remarks of the overall research.
10
Chapter 2
Discussion on Road Infrastructure Management Practices
Amin, M.S.R., and Amador, L. (2014). Discussion on Road Infrastructure Management Practices. International Journal of Built Environment and Asset Management, 1(3), pp. 236-251.
Abstract
The objective of this study is to discuss the practices of Road Infrastructure Asset Management System (RIAMS) adopted in different countries. This discussion mainly focuses on the pavement management system. Internationally, the RIAMS approach is moving from the condition-based towards the service-based approach focusing on the customer-driven priorities. This service-based approach needs to be balanced with the budget constraints, level of service and risk tolerance. The transportation agencies have not yet addressed the integrated land use and transportation modelling, the comparison of the relative advantages between capital and operating investments, the risk-based estimation, and the identification of a range of costs associated with the failure within the RIAMS. The transportation agencies should develop a performance-based RIAMS ensuring the serviceability, accountability, stewardship, long-term financial plans, and transparent investments. The RIAMS is still emerging and needs to incorporate the local mission, budget and other constraints within the scope of the local context.
Keywords
Infrastructure Planning, Roads & Highways, Transport management, Transport planning.
2.1. Introduction
The Road Infrastructure Asset Management System (RIAMS) is a systematic process of maintaining, upgrading, and operating different components of road infrastructures in a most cost-effective manner. It provides a concrete foundation to periodically monitor the performance and to optimise the maintenance and rehabilitation (M&R) actions through cost-effective management, programming and resource allocation decisions (Karlsson, et al., 2007). The RIAMS can be explained in different terms such as ‘ensure desirable driving standards’, ‘maintain performance standards involving pavement smoothness and riding comfort’, ‘foster a
11
competitive business environment supported by a safe, efficient, and accessible transportation
network’, ‘ensure appropriate levels of quality and accessibility’, and ‘minimise the long-term
costs of preserving the highway system’, and so on (Falls, et al., 2001).
The Federal Highway Administration (FHWA) defines RIAMS in the Asset Management Primer (Federal Highway Administration, 1999). The Asset Management Primer points out that the parameters or characteristics of any infrastructure system must match with the goal, ability and scope of the relevant infrastructure agency; and should be flexible enough for future change (FHWA, 1999). The Transportation Association of Canada (TAC) (1999) also indicates the flexibility of RIAMS to capture the needs, resources and policies of an involved agency (Falls & Haas, 2010). The TAC framework explains that a comprehensive RIAMS should have the ability to identify future deterioration, to identify the possible alternative programs along with their costs and economic rate of returns on investments, and to calculate future asset values of these alternatives (Falls, et al., 2001).
The RIAMS is still an emerging concept and facing diversified challenges because of the growing demand for investment in the construction and M&R operations under the budget constraints. Moreover, it is estimated that the infrastructure investment on M&R operations is more beneficial for the economic growth of a country comparing to the investment on new infrastructure (Rioja, 2003).
Many countries have experienced a wide spectrum of challenges and possible alternative options for the RIAMS during the last couples of decades. The RIAMS has experienced advanced technical and methodological improvements with a wide spectrum of functionalities such as inspection and data collection, condition assessment, performance evaluation, prediction of future performance, planning and prioritising M&R operations, and evaluating alternative technical and economic policies (Halfawy, et al., 2002). These advanced techniques and methods have developed and applied to support management activities for different components of road infrastructures such as pavement and bridge etc. The most well-known RIAM model is the Highway Design and Maintenance Standards Model (HDM) III developed by the World Bank for evaluating the road projects in developing countries (Watanatada, et al., 1985; Watanatada, et al., 1987). The HDM-III model provides an annual expenditure for a particular strategy including construction, M&R operations. It also generates vehicle operation costs, agency costs and user costs (Ockwell, 1990).
12
The objective of this study is to discuss the practices of RIAMS adopted in different countries. This discussion mainly focuses on the Pavement Management System (PMS).
2.2. United States approaches
The Department of Transportation (DOT) of different States in the United States has adopted its own PMS practice as a part of the RIAMS. This section focuses on the RIAMS practices in Arizona, Ohio, Michigan, Minnesota, Georgia, Florida, California, Iowa, Maine, Pennsylvania, and North Dakota States.
2.2.1. Arizona Department of Transportation (ADOT)
The ADOT has developed a Five-Year Transportation Facilities Construction Program (TFCP) for highways and airports. The PMS, which was first developed in early 1980s, is one of the key elements of TFCP. The ADOT applied network optimisation PMS by using Markov decision process (MDP) (Li, et al., 2006).The ADOT calculates pavement performance prediction curves based on the historical performance (condition) data. The PMS operates the decision tree to determine the M&R operations, calculates the post-treatment future performance, and determines the strategy of cost-effectiveness for each of the section of the road network (Li, et al., 2006).
Medina et al. (1999) integrated the decision-support system (DSS) tools of the Geographic Information System (GIS) with PMS to improve the PMS. This DSS model adopts the Road Surface Management System (RSMS) package, which is based on the general framework of PMS proposed by Monismith et al. (1987) for local governments and developed at Arizona State University (ASU) (Flintsch, 1991; Medina, et al., 1999).
2.2.2. Ohio Department of Transportation (ODOT)
Every two years, the ODOT management updates the goals of infrastructure system; and develops a new 10-year infrastructure system preservation plan. Two-year strategic plan outlines the short-term activities to achieve the 10-year goals. The condition of the infrastructures
determines the districts’ budgets (National Cooperative Highway Research Program, 2007). The
ODOT uses a “mix of fixes” to provide the infrastructure a condition state as close to a steady
13
quality and the budget affordability of ODOT (NCHRP, 2007). The ODOT has also adopted the sensitivity analysis of the infrastructure investments due to the increasing construction costs and budget constraints. The ODOT includes the importance of economic development along with the transportation efficiency and effectiveness into the PMS. For example, 70 percent weight is assigned to transportation efficiency and effectiveness factors, and 30 percent weight is assigned to economic development factors to decide the infrastructure investments (NCHRP, 2007).
2.2.3. Michigan Department of Transportation (MDOT)
Initially, the MDOT prioritised the projects and recommended M&R operations by developing a priority assessment model and performing the life-cycle cost analysis (LCCA). The projects were ranked based on the sufficiency, PMS, traffic, and economic data (Zimmerman, 1995). This methodology was later revised to adapt the Roadway Quality Forecasting System (RQFS). The RQFS uses the planning and technical processes to develop the PMS (Zimmerman, 1995). The planning process consists of a needs assessment, the long-range plan, and budget setting. The technical process consists of design, construction, maintenance, and research. The projects are selected based on fulfilling the constraints, and attaining the efficiency and benefits (Zimmerman, 1995).
The MDOT calculates the Remaining Service Life (RSL) of a pavement section processing the historical distress data, project type history, and the distress growth curves. In case of insufficient distress data, the MDOT calculates RSL based on the engineering judgements and the historic performance data of similar pavement (NCHRP, 2007). The MDOT applies the transition probability matrix (TPM) to define the pavement performance. The applied method is unable to answer the behaviour of the transition probabilities under modified strategies or M&R operations (NCHRP, 2007). Another disadvantage of the PMS is that the decision of M&R operations are based on long-term pavement strategies rather than life-cycle costs, although the LCCA is used to choose between comparable M&R alternatives (NCHRP, 2007). The MDOT is facing the difficulties of accurately and timely updating the infrastructure databases; especially with the new projects and heavy M&R operations. The MDOT has been carrying out different studies to overcome these difficulties (NCHRP, 2007).
The main advantage of the MDOT is that all of the asset management systems (AMSs)
14
Efficiency Act (ISTEA) management systems. The AMSs use the same set of standards, data collection methods, mapping and referencing systems, and technical platforms, etc. This enables the improvement of the facilities at the appropriate time, and saves the time and money (NCHRP, 2007).
2.2.4. Minnesota Department of Transportation (MnDOT)
The MnDOT has developed the Highway System Operations Plan (HSOP) for defining the needs, implementing the performance-based district plans, and articulating the needs of historical funding level. The MnDOT adjusts the district plans with respect to the available funding in the State Transportation Improvement Program (STIP) (NCHRP, 2007). The MnDOT has developed a RIAMS formula to distribute the funds consistent with the state policies. The formula assigns the weights of 60 percent, 10 percent and 30 percent to the preservation, safety and mobility, respectively. The formula also assigns weight to individual factors such as: 20 percent for the average bridge needs, 5 percent for the heavy commercial vehicle miles travelled, 35 percent for the average pavement needs, 10 percent for the fatal-injury crashes, 15 percent for the congested vehicle miles travelled, 5 percent for the transit use, and 10 percent for the future vehicle miles travelled (NCHRP, 2007).
The HSOP performance measures include the public opinion on the level of performance, such as: Ride Quality Index (RQI). The RQI is a measure of pavement smoothness perceived by the road users. The MnDOT develops a pavement quality index (PQI) for the entire road system each year relating the RQI and the surface rating (SR). The SR rates each road segment based on the pavement cracking (NCHRP, 2007). The MnDOT also estimates the benefit-to-cost ratio (BCR) for the HSOP investments and ranks the projects based on the public opinion.
2.2.5. Georgia Department of Transportation (GDOT)
The GDOT has developed the Computerised Pavement Condition Evaluation System (COPACES). The COPACES has several modules such as; data collection, network-level data management and analysis, network-level GIS, highway maintenance management system (HMMS), knowledge-based system (KBS), pavement profile, pavement performance, pavement performance simulation and optimisation (PPS&O), and rehabilitation project prioritisation (RPP) (Tsai & Lai, 2002).
15
The data collection module incorporates many features such as automatic data input and built-in data validation schemes. The GDOT also develops a quality control program to perform the screening and filtering the historical data before using for other applications, such as: network analysis data management and reporting, network-level GIS spatial analysis and visualisation, and development of deterioration models (Tsai & Lai, 2002). The Network-level data management and analysis module provides the query forms to query on the selected information from the centralised database, and to perform various statistical and temporal analyses (Tsai & Lai, 2002).
The Network-level GIS module analyses and visualises the pavement condition. The spatial analysis allows evaluating the pavement condition for different jurisdiction levels, such as: state, county, congressional district, and engineering district (Tsai & Lai, 2002).
The HMMS module provides an effective tool for planning and scheduling maintenance activities utilising the internal resources of the GDOT. The module tracks various operational activities; and compares them with the historical data. The comparison helps the module to evaluate and optimise the operation efficiency on a daily basis (Tsai & Lai, 2002).
The pavement profile information module allows the storage and retrieval of all relevant pavement information, such as: pavement structure properties, material properties constituting each pavement layer, and pavement construction and rehabilitation history on a system-wide basis. The KBS module diagnoses the causes of pavement distresses and suggests additional investigations if the queried information is insufficient for the system to render the diagnosis (Tsai & Lai, 2002).
The pavement performance module is developed to generate more accurate pavement deterioration models for predicting the network-level pavement system performance. The models are developed on the basis of the historical pavement performance and distress data currently available in the database (Tsai & Lai, 2002).
The PPS&O module balances the distribution of the funding and number of projects among different districts. The RPP module develops a systematic decision-making process to assist the decision makers in prioritising M&R projects; and to estimate the costs for the M&R projects (Tsai & Lai, 2002).
16
2.2.6. Florida Department of Transportation (FDOT)
The FDOT develops a 20-year Florida Transportation Plan (FTP) for enhancing the safety and system preservation, promoting the economic competitiveness, and providing mobility. The FDOT also develops a 10-year Program and Resource Plan (PRP). The PRP contains program funding levels, and have the financial and production targets balancing against the anticipated revenues. In addition, a five-year listing of projects (known as the work program) is developed annually based on the existing plans, district and public involvement, and collaborative decision (NCHRP, 2007).
The FDOT does not have a separate RIAMS rather it considers asset management as the entire process of planning, programming, and system monitoring. The FDOT depends on four major management systems for providing information to investment decisions: the PMS, the Bridge Management System (BMS), the Maintenance Management System (MMS) and the Maintenance Rating Program (MRP). The asset management approach depends on the adopted operational policies. The adopted operational policies are linked to customer opinions and expectations on road conditions and maintenance levels. The FDOT has also defined the Roadway Characteristics Inventory (RCI) as the indicator of obtaining and disbursing the transportation funds (NCHRP, 2007).
2.2.7. California Department of Transportation (Caltrans)
The district offices of Caltrans use the ‘Candidate Locations Priority List (CLPL)’ to
develop and design the projects. The districts establish the project priority number by giving weighted average to the individual segments of the entire road network and finally submit it to the Caltrans headquarters for the compilation of a state-wide priority list (Paterson, 1987). The CLPL is an array of 14 priority categories by combining ride score, distress ratings, and average daily traffic in different ways (Paterson, 1987).
2.2.8. Pennsylvania Department of Transportation (PennDOT)
The PennDOT develops a RIAMS to improve management control of the road network. The major components of the RIAMS are: the Roadway Information Data Base (RIDB), the pavement management function, the Standard Application Inquires (SAI), the ad-hoc query language and function, and the batch reporting. The SAI contains planned and approved projects,
17
accident details, accident summary, planned maintenance activities, Annual Average Daily Traffic (AADT) and pavement conditions, planned and approved projects affecting a structure or accident details by structure, AADT and pavement condition ranking, and state route sequential listing (Paterson, 1987).
2.2.9. North Dakota Department of Transportation (NDDOT)
The NDDOT uses the pavement performance models to develop a multiyear prioritised program for pavement families with consistent deterioration patterns. The decision matrices are established to determine the appropriate rehabilitation treatments for various functional classifications, condition levels, and geometric situations. The NDDOT applies the BCR to determine the timing and level of rehabilitation that provides the agency with the most cost-effective strategy over the analysis period (Paterson, 1987).
The U.S. transportation agencies address several transportation issues in the RIAMS, such as: the performance data and systematic processes are used to evaluate investment strategies. This enables the transportation agencies responding effectively to the budget constraints, and to the government efforts improving efficiency and increasing customer expectations (FHWA, 2012). The incorporation of LCCA into the RIAMS enhances the efficiency of asset management and improves the accountability of the transportation agencies. The adopted RIAMS determines the financial sustainability of the investment programs by evaluating the percentage of depreciation funded each year and accounting for any unfunded depreciation as an agency liability (FHWA, 2012). The transportation agencies have not yet address the dynamic traffic loads during the life-span of the pavement, the comparison of the relative advantages between capital and operating investments, and the risk-based estimating, and the identification of a range of costs associated with the failure.
2.3. Canadian approaches
Very few transportation agencies have developed means of evaluating performance of the overall RIAMS (Falls, et al., 2001) (OECD, 2001). The Saskatchewan Department of Highways and Transportation adopted the asset management guiding principles, such as: developing methodology based on an objective assessment of needs, collecting the condition data on an objective and repeatable basis, considering the M&R operations in the overall optimisation to
18
preserve the infrastructure, and finalising the district-level preservation treatment decisions within an overall policy framework to collectively manage the provincial budget (Saskatchewan Department of Highways and Transportation, 1994).
The condition indicators vary from jurisdiction to jurisdiction, making it difficult to benchmark, or compare network performance among transportation agencies. In addition, the results from existing performance measures are not always analysed and represented in a manner understandable or useful to senior management and technical personnel. The transportation agencies still require compiling and evaluating the range of performance indicators for road networks, and provide guidance and recommended best practices for their appropriate application and communication (OECD, 2001).
2.4. Australian approaches
The RIAMS of Australia applies different performance indicators at upper, internal management, and lower levels. At the upper level, the transportation agencies annually publishes national performance indicators including road safety, registration and licensing, road construction and maintenance, environment, programme and project assessment, travel time, lane occupancy rates and user costs (OECD, 2001).
At the internal management level, the agencies use a variety of performance indicators of the RIAMS, such as: program efficiency, user satisfaction, road-user costs, freight movement and heavy vehicle access, route reliability with respect to flooding, levels of private investment from developers and on toll-ways, environmental performance, contracting performance, administrative overheads, and stakeholder acceptance of the road implementation program (OECD, 2001). At the local level, the transportation agencies use the performance indicators including the trend in road pavement or bridge condition, and measurement parameters for a route, sub-network, road category or region (OECD, 2001). Different transportation agencies practice different types of RIAMS, which are explained in the following sections:
2.4.1 Australian Local Government Association (ALGA)
The ALGA has developed the National Local Roads Database System (NLRDS). The system utilises existing data collected annually by the State Grants Commissions; and calculates the sealing of gravel roads, state of assets, expenditure on roads and bridges, road asset
19
consumption, road asset sustainability and road safety measures (Australian Local Government Association, 2010).
2.4.2 Western Australia Local Government Association (WALGA)
The WALGA uses the ROMAN software as a tool to the RIAMS of the Western Australian local road network. The ROMAN II provides road inventory (age and current condition rating), valuation package and an indicative works program feature (Haider, et al., 2011). The key features of the ROMAN II includes a detailed and accurate road asset register incorporating financial values, a data collection and record keeping repository with GIS functionality, comprehensive works programming and deterioration modelling, road asset
reporting to the Grants Commission, ‘phase in’ with minimal loss of data and disruption, and
value for money and system longevity (National Research Centre for Local Roads, 2009). The ROMAN II prepares a RIAMS report compatible with State and Commonwealth Government road asset reporting. The report is used by the Western Australian Local Government Grants Commission to distribute the road grant portion of the Australian government grants to local governments (Haider, et al., 2011).
2.4.3 Queensland Road Alliance (QLDRA)
The QLDRA, developed by the Queensland Department of Main Roads and Local Governments, is a state-wide framework that guides the decision making through a set of parameters for investment and road management strategies. The QLDRA is a voluntary alliance, which manages Local Roads of Regional Significance (LRRS). The LRRS includes the lower order state roads and the higher order local government roads. The aim of the QLDRA is to improve the asset management data and practice for Queensland roads. The key functions of QLDRA are investment strategies, project prioritisation, asset management, resource sharing, joint purchasing, and capability improvement. The Queensland approach does not use a common system rather it establishes the definitions of the standard data. It also transfers the specifications to facilitate the exchange of data between systems within a central repository – known as the Road Alliance Hub (Haider, et al., 2011).
The Institute of Public Works Engineering Australia (IPWEA) supports the implementation of financially sustainable public works programs. The Department of Planning,
20
Transport and Infrastructure of South Australia determines the performance requirements from a road user perspective; and links the performance requirements to the pavement condition characteristics (FHWA, 2012).
2.5. New Zealand approaches
The Road Assessment and Maintenance Management (RAMM) System is the main RIAMS tool in New Zealand. The use of RAMM is mandatory to obtain financial assistance from the New Zealand Transport Agency (NZTA). The RAMM is updated annually with changes made to the network. The RAMM also incorporates a treatment selection programme which utilises condition and road inventory data to identify road sections (Haider, et al., 2011).
The NZTA is moving toward a service-based approach for managing their road networks rather than a condition-based approach. The service-based approach focuses the customer-driven priorities. The NZTA argues that the condition-based approach does not allow the roads to carry an unusually heavy load because of existing road conditions; however, the service-based approach allows the heavy vehicles to use the road infrastructure. The problem of service-based approach is that the highway users are not well aware of the bridge and road conditions; therefore, the risk and LCCA are the key decision drivers for the RIAMS (FHWA, 2012).
2.6. Portuguese approach
The Portuguese RIAMS has some drawbacks, such as: lack of historical data and unreliable empirical models. There are two problems of the traditional empirical models. First, the direct simulation of transition probabilities has been costly and unsuccessful in the long-term. Second, these methods do not address how to incorporate the engineering knowledge in models, and to address the overall budget constraints without meaningless subjective trade-off among road categories (Golabi & Pereira, 2003).
Golabi and Pereira (2003) propose the Portuguese Pavement Management System (PPMS). This system effectively addresses (1) how to deal with data inadequacies; (2) how to bridge the gap between the network optimisation and practical projects; (3) how to correctly incorporate engineering knowledge in models; and (4) how to address overall budget constraints without meaningless subjective trade-offs among road categories (Golabi & Pereira, 2003).
21
The PPMS comprises several modules, such as: the data bank, Pavement Rehabilitation and Improvement Strategic Model (PRISM), a GIS, and the Pavement Quality Evaluation Model (PQEM) (Golabi & Pereira, 2003). The PPMS does not need any historical data to start, but it can use the historical data and incorporate the engineering opinion easily. The PPMS system introduces an interactive budget planning model that allows the users to introduce flexibility on performance level and budget constraints, for both short-term and long-term planning horizons. The system would then find the optimal solution within feasible scenarios (Golabi & Pereira, 2003).
2.7. Japanese approaches
In Japan, the technical and detailed discussions on defining the road infrastructure and the RIAMS are at their initial stage. At present, there are no general-objective indicators available to quantify the performance of the road network and transportation system. A Maintenance Control Index (MCI) is calculated based on cracking, rutting, and roughness of pavement surfaces. The RCI is calculated based on roughness (OECD, 2001).
2.8. Polish approaches
Poland uses a combination of bearing capacity, evenness, ruts, skid resistance and surface condition resulting in condition classes. This indicator is used for strategic planning of the road budget at the network level, and for budget allocation among regional road administrations. On the other hand, a technical condition of engineering structure performance indicator is issued in the bridge management system (OECD, 2001).
2.9. Comparative evaluation
The management of road infrastructure systems is a complex task as it concerns more stakeholder perspectives, wider-ranging objectives, and longer time-horizons (Zeb, et al., 2013). It is difficult to evaluate to what extent the existing RIAMS practices reach the maturity level.
The ISO 55000 includes the generally applicable ‘must do’ items for asset management (Woodhouse, 2013). The key themes of the ISO 55000 are: (1) alignment of organisational objectives feeding clearly into asset management strategies, objectives, plans and day-to-day activities; (2) whole life-cycle asset management planning and cross-disciplinary collaboration to
22
achieve the best value combined outcome; (3) risk management and risk-based decision-making; and (4) establishment of a discipline at multiple levels of learning, innovation and feedback (Woodhouse, 2012; 2013). However, the ISO 55000 does not attempt to define the ‘how to’ implement the ‘must do’ items of asset management system (Woodhouse, 2013). The ISO 55000
does not provide financial, accounting or technical guidance for managing specific asset types (Woodhouse, 2013).
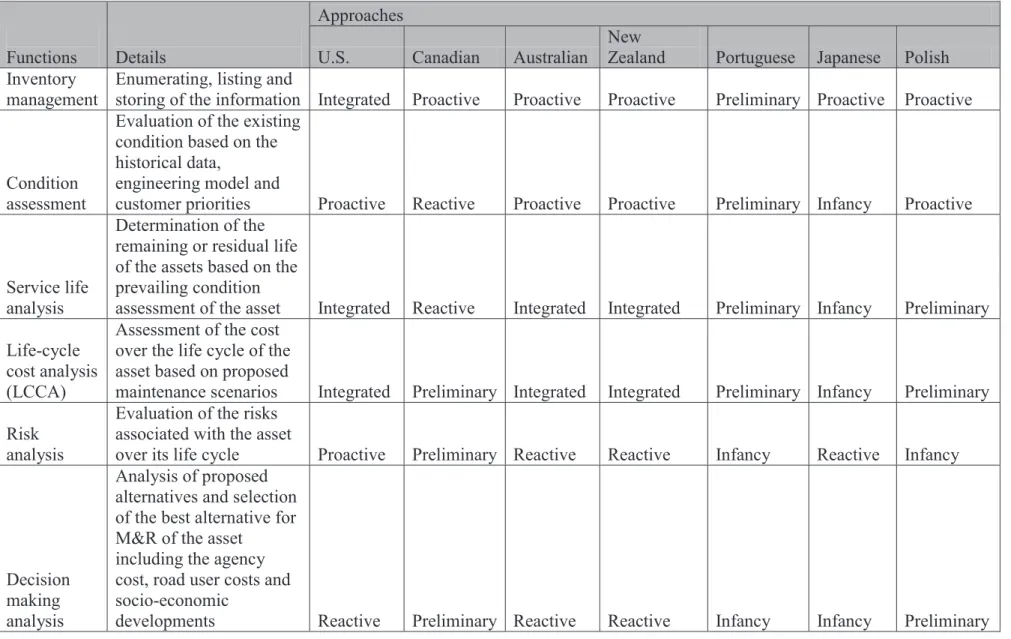
This study adopts the Infrastructure Management-Process Maturity Model (IM-PMM), developed by Zeb et al. (2013), to quantify and compare the RIAMS practices and to find out the scope of improvements. The IM-PMM framework is defined by the asset inventory management, condition management, service life analysis, LCCA, risk analysis, and decision-making analysis (Vanier et al., 2009; Zeb et al., 2013).
The above-mentioned functions of the IM-PMM are assessed against five stages of maturity that reflect increasing levels of formalisation or process maturity. In the Infancy stage, the particular function of the IM-PMM has not started; or started but at a very beginning level. The function is just defined but is not practicing. The Preliminary stage implies that the function is at the beginning level e.g. the definition is documented but practicing at an initial stage. In the Reactive stage, the definitions of the functions are specific to a particular situation and are not documented for the purpose of future re-use. They are dynamic and changing frequently with time and context. In the Proactive stage, the definitions of the functions are documented and standardized for future re-use. In the Integrated stage, the functions are actively managed against the standardised process definitions. Data are collected to determine the success and effectiveness of the functions, and on-going improvements are pursued (Zeb, et al., 2013).
23
Table 2.1: Infrastructure Management-Process Maturity Model (IM-PMM) framework for evaluating the maturity of RIAMS practices
Functions Details
Approaches
U.S. Canadian Australian
New
Zealand Portuguese Japanese Polish Inventory
management
Enumerating, listing and
storing of the information Integrated Proactive Proactive Proactive Preliminary Proactive Proactive
Condition assessment
Evaluation of the existing condition based on the historical data,
engineering model and
customer priorities Proactive Reactive Proactive Proactive Preliminary Infancy Proactive
Service life analysis
Determination of the remaining or residual life of the assets based on the prevailing condition
assessment of the asset Integrated Reactive Integrated Integrated Preliminary Infancy Preliminary Life-cycle
cost analysis (LCCA)
Assessment of the cost over the life cycle of the asset based on proposed
maintenance scenarios Integrated Preliminary Integrated Integrated Preliminary Infancy Preliminary Risk
analysis
Evaluation of the risks associated with the asset
over its life cycle Proactive Preliminary Reactive Reactive Infancy Reactive Infancy
Decision making analysis
Analysis of proposed alternatives and selection of the best alternative for M&R of the asset
including the agency cost, road user costs and socio-economic
24
The IM-PMM framework for evaluating th