University of Arkansas, Fayetteville
ScholarWorks@UARK
Theses and Dissertations5-2019
Implications of Rice Cultivar Selection to Optimize
Returns from Crop Insurance
David Ethan Branscum
University of Arkansas, Fayetteville
Follow this and additional works at:https://scholarworks.uark.edu/etd
Part of theAgribusiness Commons,Agricultural Economics Commons,Agronomy and Crop Sciences Commons, and theFood Processing Commons
This Thesis is brought to you for free and open access by ScholarWorks@UARK. It has been accepted for inclusion in Theses and Dissertations by an authorized administrator of ScholarWorks@UARK. For more information, please [email protected].
Recommended Citation
Branscum, David Ethan, "Implications of Rice Cultivar Selection to Optimize Returns from Crop Insurance" (2019).Theses and Dissertations. 3187.
Implications of Rice Cultivar Selection to Optimize Returns from Crop Insurance
A thesis submitted in partial fulfillment of the requirements for the degree of Master of Science in Agricultural Economics
by
David Ethan Branscum University of Arkansas
Bachelor of Science in Education, 2013
May 2019 University of Arkansas
This thesis is approved for recommendation to the Graduate Council.
_____________________________________ Bruce L. Dixon, Ph.D.
Thesis Director
_____________________________________ _____________________________________ Lawton Lanier Nalley, Ph.D.
Committee Member
Kenton Bradley Watkins, Ph.D. Committee Member
Abstract
Rice production differs from most other field crops by distinct differences in yields across cultivars and rice producers being paid for yield after post-harvest milling. Using eleven years (2003-2013) of Arkansas harvest data from performance trials in six different locations, hybrids have 19% higher paddy yields and head rice yield rate 1.7% lower than conventional cultivars. Given the 2014 Farm Bill’s emphasis on crop insurance as a risk management tool for producers, these variations in yield among cultivars have significant implications for rice producers. Comparing national level, crop insurance data on corn, soybeans and rice indicates rice producers strongly prefer yield protection policies (including catastrophic policies)
compared with corn and soybean producers who prefer revenue protection. In rice yield and revenue crop insurance policies, no premium distinctions are made on the basis of cultivar. Adjustments for adverse milling outcomes are made only in the most extreme cases. Using an econometric model to predict paddy yields, milled rice yields and head rice yields, the relative returns to yield protection and revenue protection crop insurance are estimated on a per acre basis for both hybrid and conventional cultivars. Additionally, a policy expanding current milling deficiency criteria to milling deficiencies is explored. Results indicate mean loss-cost hybrids exceed mean loss-cost ratios for conventional cultivars for revenue protection by 0.37 and by 0.47 for yield protection. The results also suggest that rice producers should prefer revenue protection policies over yield protection policies (based on economic returns), and they should insure their rice crops at higher buy-up levels than they currently do. A revenue
protection policy that would cover adverse milling outcomes would increase the mean indemnity by about 20%.
Acknowledgments
I would like to express my sincere gratitude to my advisor, Dr. Bruce Dixon, who has demonstrated nothing less than remarkable patience with this project. He has offered sound wisdom and counsel to me, not only with this project, but with life in general. It has been an honor to get to work and learn from someone like, Dr. Dixon. I would also like to acknowledge Dr. Lanier Nalley who was instrumental in forming the idea for this project. This project could not have been completed without his skill and expertise. I would also like to acknowledge Dr. Jesse Tack and Dr. Ranjit Mane for their hard work and advice on this project. I want to thank Dr. Bradley Watkins for his willingness to serve on my committee and for his advice and guidance on this project. Lastly, I would like to thank Mr. Wei Yang, Ms. Diana Danforth, and Mr. Grant West for their contributions. I am truly grateful for everyone’s diligent and hard work.
Dedication
I would like to dedicate this thesis to a few people who have greatly influenced my life. First, I dedicate this work to my older brother, the late Michael L. Branscum. Michael was an outstanding man who was studying agribusiness at the University of Arkansas before he passed away. He is greatly missed. Next, I dedicate this work to my parents, David & Judy Branscum. I can never thank them enough for everything they have given me in life. I am especially grateful to them for raising me a on a small family farm in Marshall, Arkansas. Next, I dedicate this work to my good friend, Mr. Gerald Fendley Ragland, for encouraging me to pursue a career in
agriculture. Lastly, I would like to dedicate this thesis to my wife, Katie Branscum. She is truly an inspiration to me, and I am grateful to her for all of her support and encouragement.
Table of Contents
I. Introduction………..………...1
II. Data and Methods………...………6
Data………...………6
Paddy Yield Model………...……….7
MRY Model………...………...….8
HRY Model………...….8
Sources of Uncertainty………...………...…9
III. Crop Insurance Models……..………..………10
Revenue Protection……...………..11
Yield Protection………..12
Milling Revenue Protection………...……….13
USDA Cost Estimator………...…………...14
IV. Results………14
Sample Characteristics and Estimation……….14
Differences Between Revenue Protection and Yield Protection………15
Milling Revenue Protection………18
Producer Revenue Risk Reduction……….19
Cultivar Selection ………..20
V. Conclusion………..21
VI. Endnotes..………...23
VII. References………...25
Tables………27
Table 1. Mean paddy yield, MRY, and HRY by cultivar 2003-2013………...27
Table 2. Mean paddy yield, MRY, HRY, and APH by location and cultivar (2003-
2013)……..………28
Table 3. Revenue protection mean indemnities, frequencies, and returns to
premiums……..……….29
Table 4. Yield protection mean indemnities, frequencies, and returns to premiums…30
Table 5. Milling revenue protection mean indemnities and frequencies………..31
Table 6. Realized producer revenue by location and cultivar under revenue protection
($/ac)…………..………32
Table 7. Realized producer revenue by location and cultivar under yield protection
($/ac)……..………34
Table 8. Realized producer revenue by location and cultivar under milling revenue
protection ($/ac)……..……….….36
Table 9. Regression estimates of paddy yield for hybrid and conventional rice
cultivars……….38
Table 10. Regression estimates of MRY for hybrid and conventional rice
cultivars………..39
Table 11. Regression estimates of HRY for hybrid and conventional rice
Figures………...…41
Figure 1. Research locations in Arkansas……….41
Figure 2. Mean indemnity per acre by RP, YP, and MRP at 70% coverage level……42
Figure 3. Indemnity payment frequency for RP, YP, and MRP at 70% coverage
level………..……….43
Figure 4. Mean producer realized revenue plus mean indemnity payments for RP, YP,
1
Implications of Rice Cultivar Selection to Optimize Returns from Crop Insurance I. Introduction
The passage of the Agricultural Act of 2014 (2014 Farm Bill) brought numerous changes for farmers across the country. Direct and counter-cyclical payments were eliminated, and the risk management of crop production now focuses more on crop insurance. For crops in states such as Arkansas, which is largely characterized by operators who irrigate their crops, making decisions on crop insurance has taken on added importance because of this increased focus on crop insurance. As Karov et al. argued in 2013, popular crop insurance programs do not target row crop producers who irrigate. High energy costs to lift water increase crop production costs. Crop insurance does not offset increased lifting costs due to drought (Karov et al.). To address the issue of producer’s not having adequate crop insurance policy options, margin protection (MP) policies became available to producers in Arkansas in 2016 but participation in all years since then has been negligible (less than 0.01%). Arkansas’ second most important revenue crop
is rice, and in 2016 Arkansas was responsible for 42% of US rice revenues.1 Rice received
favorable treatment in terms of direct and counter cyclical payments under the previous farm bill program. With the shift to crop insurance, it is important to take a closer look at the current crop insurance program for rice. The current program may fall short of adequately protecting against the risks associated with growing rice such as poor rice milling quality.
Rice producer participation intensity for crop insurance has been low relative to corn and soybeans (USDA, RMA. 2018). On a national basis, the insured proportions of planted acres of corn, soybeans and rice have been roughly the same for corn and soybeans (averages of
proportions from 2014 to 2017) of 88% and 89% with a corresponding average for rice of 94%.2
2
greater than the 50% guarantee) has been much lower. At the national level, five-year (2014-2018) proportions of policies by buy-up level, rice had 38% of its policies at the 50% level whereas corn and soybeans only had 7% and 6% of their policies at the 50% buy-up level. At the higher buy-up levels, the proportions of rice policies are much lower than for corn and soybeans. Accordingly, 82% of corn and 84% of soybean policies were at the 70% buy-up level or higher and only 50% of rice policies were beyond this threshold from 2014-2018. The lower level of rice coverage is perplexing because from 2001-2017, rice had the highest gross loss ratio (total indemnities divided by total premiums) among the seven major US crops (Zulauf et al., 2018). Furthermore, rice gross and net loss ratios (indemnity divided by premium less subsidy) for 2014-2017 exceeded one for both ratios in all four years whereas corn and soybeans had four and six ratios less than one over the same period. In 2015 and 2017, rice crop indemnities in
Arkansas accounted for 50% and 57%, respectively, of the total indemnities paid to corn, soybeans and rice in Arkansas.
Rice producers are more likely to buy yield protection (YP) and catastrophic (CAT) policies (62% of total policies sold from 2014-2017) compared with corn and soybeans which had much larger proportion revenue protection (RP) and RP policies with harvest price exclusion
(RPHEP) (87% for corn and 88% for soybeans).3 While rice yields are less variable on an
annual basis than corn and soybeans, YP provides replanting and preventive planting coverage, which are more important for rice production. Excessive rainfall during the spring planting months is not uncommon in the Mississippi River Delta, and this prevents rice producers from being able to plant their rice crop. The number of CAT policies for all row crops in Arkansas declined from 13,295 policies sold in 2014 to 9,714 policies sold in 2017 (USDA, RMA. 2014 & 2017).
3
Unlike other row crops, yield and the outcome of post-harvest processing affect rice producers’ revenues. Rice prices at the mill are directly affected by the milling quality of the paddy (rough rice) yield delivered. Milling takes two forms with rice. The milled rice yield (MRY) is the proportion of paddy rice that becomes either head rice or broken rice. The head rice yield (HRY) is the proportion of paddy rice resulting in kernels that are at least three-fourths whole (Hardke and Siebenmorgen, 2013). Current crop insurance programs provide minimal protections to offset losses due to poor milling outcomes. The current industry standard for rice milling rate is 70% for MRY and 55% HRY, and any milling rate less than the standard
isconsidered poor. A poor milling rate results in discounts to the producer’s revenue. The current crop insurance programs offer protection to the producer only when the MRY and/or HRY are below 68% and/or 48% respectively (USDA, RMA. 2018). Hence, there is a gap between how rice revenues are insured and how they are realized by rice producers. Because the weather factors that affect milling yield do not necessarily directly affect paddy yield, there are crop seasons where paddy yields are good, however, milling yields are highly variable. The present investigation explores a potential policy to provide rice producers protection from adverse milling outcomes such as brokens and low head rice yield.
Over the past decade, the US rice industry has increased the proportion of rice acreage planted to hybrids, going from less than 10% in 2004 to over 38% in 2017 (Hardke 2018). In general, hybrids have higher paddy yields than conventional cultivars, but often less favorable milling quality (Lanning and Siebenmorgen, 2011). For the data used for this study, hybrids mean paddy yield was 19% higher than conventional cultivars, but head rice yield rates were 1.8 percentage points lower for hybrid rice. There are several explanations for perceived inferior milling in hybrid rice such as improper milling techniques, excessive chalkiness, etc., but
4
generally hybrids mill lower (Lanning and Siebenmorgen, 2011). According to data from the University of Arkansas, Division of Agriculture, hybrid seed costs for 2018 are estimated at approximately $126.50 per acre compared to approximately $36 per acre for conventional rice seed (Watkins et al., 2018). Watkins et al. project that total operating costs per acre of hybrids exceed those of conventional varieties by $81. The increasing use of hybrids in rice planting poses an interesting situation for both producers and crop insurance providers. The only factors used in writing policies are four to ten years of actual production history (APH), location (by state and county), and buy-up level (50%-85%). Producers may select the insurance policy type and level of coverage. Premium costs do not distinguish between hybrid and conventional cultivars. Studies have yet to examine the benefits of rice crop insurance programs as a function of cultivar. This is important because the cost of hybrid seed exceeds the cost of conventional seed, and hybrid cultivar paddy yields exceed those of conventional cultivars.
Multiple crop insurance programs are available to rice producers such as revenue
protection, yield protection, and margin protection. All rice is irrigated in Arkansas and water is generally pumped to minimize moisture scarcity. Consequently, rice producers might be
expected to value revenue protection or margin protection since the irrigation itself protects the producers’ rice yields from varying. RP provides direct protection due to revenue (price)
variation and not solely on yield variation. RP protects farmers according to a revenue guarantee which is determined by coverage level, APH, and a projected price based on a futures contract price for rough rice as well as a harvest price adjustment if harvest price exceeds the projected price. After harvest, a producer can draw an indemnity on the difference between revenue
guarantee and their actual revenue as defined by RMA.4 Margin protection covers increased
5
Arkansas, find that margin protection is unlikely to generate indemnities at low levels of buy-up. They hypothesize producers might avoid MP because it is a countywide product and might not provide farm level protection when a particular farm’s margins drop.
The “actual revenue” as computed for crop insurance purposes generally does not consider milling quality unless there are extreme milling deficiencies, as previously discussed. For most crops, realized revenue is simply yield per acre multiplied by price per bushel which is how insurance programs compute producer revenue per acre. For rice, however, realized
revenue is a function of paddy and milling yield and HR and broken rice price. The prices to rice producers use an industry standard milling rate of 55% HRY and 70% MRY. When a producer’s rice mills greater than or less than this industry standard, an adjustment is made to the price received by the farmer. This realized price is used to compute a producer’s realized revenue. Milling quality is affected by environmental conditions such as stress during flowering, high nighttime temperatures, low solar radiation, low or high harvest moisture content and others (Hardke and Siebenmorgen, 2013; Cooper et al., 2008; Lyman et al., 2013). As noted earlier, milling quality can also vary as a function of genetic differences between cultivars. Rice
producers are being protected using revenue estimates that do not equal their realized revenues. Because of this, a gap exists between producers’ current indemnities and their actual exposures. In cases of poor milling, this gap could be upwards of 20% as we show in our analysis. Given the changed risk management structure of the 2014 Farm Bill, producers are relying on crop insurance to protect them against their losses and milling yields can be part of those losses.
This study uses rice production data and weather data from six different research
locations across Arkansas in order to predict producer revenues over 1000 stochastic simulations per location and rice cultivar. The weather data are weather variables that impact rice production
6
variables such as paddy yield, HRY, and MRY. Two current crop insurance programs (YP and RP) at 55%, 70%, and 85% buy-up levels for Arkansas rice producers are analyzed relative to location and cultivar. Specifically, we ask what effect do location, cultivar and buy-up have on producer revenue under various crop insurance programs? We also investigate if a revenue protection program that more closely insures against adverse milling outcomes would be more suitable in terms of reducing revenue fluctuations. Since 2014, rice producers have
outperformed major crop producers, such as corn and soybeans, in terms of loss ratios related to
crop insurance5. Rice producers also prefer different crop insurance products than corn and
soybean producers. We will examine if rice producers’ success from 2014-2017 with crop insurance, relative to corn and soybean producers, has been random or if they are pursuing a good strategy in terms of mitigating risk and maximizing revenue. For the sake of achieving more complete coverage, we examine the outcome of a proposed policy that would more closely compensate for milling deficiencies.
II. Data and Methods
Data
Annual Arkansas Rice Performance Trial (ARPT) data were collected from six locations
in Arkansas over ten years (2003-20136). These locations are indicated on Figure 1. The
variables collected from these trials include paddy yield in bushels per acre dried to 12% (𝑌𝑝),
milled rice yield percentage of paddy yield (MRY), head rice yield percentage of paddy yield (HRY), percent harvest moisture content (HMC), cultivar, year of production, and location. The plots were harvested at various HMC levels, but all yields recorded were dried to 12% HMC
(Frizzel7). Weather observations were collected for each location for each year using the aWhere
7
radiation (SOLAR) in W/m2, hours during daylight when temperature is greater than thirty-three
degrees Celsius (TD33), hours during nighttime when temperature is greater than twenty-two degrees Celsius (TN22) (Lyman et al. 2013), and mean daily temperature in Celsius (AvgT). Weather variables were observed in two succeeding intervals. Window one (w1) is the time frame from rice plant emerged to when 50% heading was recorded. This time period is referred to as the plant’s vegetative stage. Window two (w2) defined as the grain filling stage occurs from one day after 50% heading to harvest of the plant. AvgT is averaged over w1 and w2. Both hybrid and conventional cultivars were planted at the six locations. For the purposes of crop insurance where no distinction is made by cultivar, the cultivars were put into two broad categories: conventional cultivars and hybrid cultivars. Across all years and locations, there were 2,058 observations on conventional cultivars and 460 observations on hybrids.
Using the data collected, six ordinary least squares (OLS) regressions were estimated. Similar to Lyman et al. (2013), paddy yield models, HRY models and MRY models were estimated. Lyman et al. (2013) used pooled data to estimate yield models where the models differed by cultivar planted. In this study, two models (one for hybrid cultivars and one for conventional cultivars) were used to estimate paddy yield. Lyman et al. estimated separate MRY and HRY models for each cultivar in their study. In similar manner, we estimate one MRY model for hybrids and another for conventional cultivars allowing parameter estimates to vary by cultivar. Similarly, two HRY models are estimated, one for hybrid cultivars, and one for
conventional cultivars. The results from these estimations are in Appendix A. Paddy Yield Model
Yield was recorded as rough, paddy yield that has been dried to 12% HMC before
8
regression models (conventional and hybrid), the natural log of yield (Yp) is specified as a
function of location (Stuttgart, Corning, Keiser, Newport, Pine Tree and Rohwer) and seven different climate variables (w1TN22, w2TN22, w1SOLAR, w2SOLAR, w1VPD, w2VPD and AvgT). In the estimated model, Stuttgart is the base location, so its effect is represented in the intercept term.
These models were used to predict paddy yield for a given location and cultivar. Using
this model, Yp is simulated using @Risk via Microsoft Excel twelve times (six locations, two
cultivars per location) to predict yields for all possible location and cultivar combinations. Each simulation has 1,000 repetitions.
MRY Model
MRY is the observed mass percentage of whole and broken rice kernels remaining after milling of paddy rice. In the two MRY regression models (one for hybrids and one for
conventional), the logit of MRY (log (MRY/(1 – MRY)) was specified to be a function of the six
locations, w1TD33, w2TD33, w1TN22, w2TN22 and HMC.10 These models were used to
predict MRY for a given location for hybrid cultivars and conventional cultivars. The same procedure for simulations was used as for the yield model.
HRY Model
HRY is the observed mass percentage of whole kernels remaining after paddy yield was milled. In the two HRY regression models (one for hybrids and one for conventional) the logit of HRY/MRY was specified to be a function of the six locations, w1TD33, w2TD33, w1TN22, w2TN22, HMC, and HMC squared (HMC2). For the simulation, the same procedure for MRY simulations was used for HRY simulations.
9 Sources of Uncertainty
Our ultimate goal was to simulate the revenues received by producers under various insurance policies. The simulations recognized four sources of uncertainty and were modeled by random draws according to the hypothesized distributions. The first source of uncertainty is due to uncertainty about the regression parameters since these estimates are based on sample data. In each of the 1,000 simulations a vector of regression coefficients was drawn assuming normality and using the covariance matrix of the parameter estimates. The second source of uncertainty is due to weather variability. Random draws of the weather variables based on the estimated moments of the observed weather over the sample period 2003 – 2013 and across the six
locationswere used as values for the independent variables in the regressions and multiplied
times the random draws of the parameter coefficients (the first source of uncertainty noted above.) The third source of uncertainty is the randomness due to the additive error terms of each regression model. For a given location and cultivar, three error terms on the original regressions were drawn according to a multivariate normal distribution with means zero with the estimated three-by-three covariance matrix of the error terms. After the regression coefficient draws were multiplied times their random draws on the independent variables and the random draws on the error terms were added, all three dependent variables were transformed back to their natural units so that head rice yields and brokens yields in pounds could be computed.
The fourth source of uncertainty was harvest price which is required for computing the actual revenues producers received. Harvest price was simulated using a Black-Scholes options approach (Hull). The February 2017 price for computing rice insurance policies by RMA is $0.104/lbs. Using the RMA rice volatility factor of 0.17, the Black-Scholes process generated
10
III. Crop Insurance Models
The simulations for paddy yield (Yp), MRY, HRY, and price were used to generate
distributions of producer revenue to facilitate comparisons of current crop insurance programs available for rice producers. The two current crop insurance programs analyzed were Revenue Protection (RP) and Yield Protection (YP). We also propose and simulate an alternative crop insurance program that might better protect producers from losses related to milling quality. This program is referred to as Milling Revenue Protection (MRP).
Actual production histories (APH) were calculated for each cultivar and location by averaging paddy yield for the four most recent years of data. Projected price is the January mean of the November rough rice contract closing prices, and the projected price is published by RMA
every February12. The projected price for 2017 was $0.104 per pound of rice, and this is the
price used with a volatility factor of 0.17. Harvest price for the purposes of crop insurance is typically the September mean of the November rough rice contract closing prices. Harvest price is simulated as described above. Although the actual September mean of November rough rice closing contact prices was $0.128, we simulate the price 1,000 times since the $0.128 is simply one observation and therefore would not generate any generalizable distributions.
Quality adjustment factors (QAF) were applied to each observation based on the RMA
guidelines for quality adjustment.13 For any observation where MRY was less than 68% or HRY
was less than 48%, the following QAF48/68 was applied to paddy yield:
QAF48/68 = (𝑃𝑎𝑑𝑗/𝑃ℎ) (1)
11
where QAF48/68is a proportional adjustment; 𝑃𝑎𝑑𝑗 is the realized price a producer receives after
milling quality discounts are applied (explained below); 𝑃ℎ is the harvest price computed for
producers and 𝑌𝑎𝑑𝑗is the adjusted yield which a producer uses for crop insurance purposes.14
The revenues producers actually receive (realize) net of indemnities is determined by paddy yield, harvest price (whole kernel price and broken kernel price), and milling quality of the rice. Observed rice prices are based on the industry standard milling quality of 55% HRY and 70% MRY. Prices received by an individual producer vary based on deviations of a harvested crop from this industry standard. A producer’s realized revenue (RR) not including indemnities is calculated as:
𝑅𝑅 = 𝑌𝑝× 𝑃𝑎𝑑𝑗 (3) where:
𝑃𝑎𝑑𝑗 = [𝑃ℎ+ (𝐻𝑅𝑌/(1.00 − 0.55))(𝑃𝑤) + (1.00−0.15𝐵𝑅𝑌 )(𝑃𝑏)] (4)
𝑃ℎis the harvest price paid to the producer, 𝑃𝑤is the national loan rate for whole kernels
published annually by USDA, BRY is the percentage of broken kernels remaining after the
milling of paddy rice (MRY – HRY); 𝑃𝑏is the national loan rate for broken kernels published
annually by USDA. For this analysis 𝑃𝑤 equaled $10.01/cwt and 𝑃𝑏 equaled $6.96/cwt.15 Note
that in (1) QAF48/68 is truncated to one if it exceeds one and only is less than one for adjustment
purposes if MRY is less than 68% or HRY is less than 48% or both. But for the purposes of computing a producer’s revenues received at a mill price gets adjusted for any deviation from
55/70.16
Revenue Protection
To analyze the impacts on rice farmers of the Revenue Protection (RP) crop insurance policy, the yield, MRY and HRY equations were used with the appropriate pricing mechanism to
12
simulate actual producers’ revenue under a RP policy. Actual producer revenues, producer revenues with indemnity payments, the probability of an indemnity payment occurring, and the mean indemnity payment over all observations where an indemnity was triggered are computed
for every location and cultivar combination. For RP, revenue guarantees (𝑅𝑔𝑟𝑝) are computed
for each observation based on a given APH, coverage level proportion (C), 𝑃𝑟𝑝 which is the
larger value of projected price ($0.104/lbs in all simulations) and the simulated harvest price
(𝑃ℎ).
𝑅𝑔𝑟𝑝= 𝐴𝑃𝐻 × 𝐶 × 𝑃𝑟𝑝 (5)
Coverage level (C) can range from 50%-85% (limits set by RMA) depending on producer
preference. For RP, a producer’s revenue for insurance payment computations (𝑅𝑎𝑟𝑝) is estimated
based on simulated, adjusted paddy yield per acre (𝑌𝑎𝑑𝑗) and harvest price (𝑃ℎ).
𝑅𝑎𝑟𝑝 = 𝑌𝑎𝑑𝑗× 𝑃ℎ
Indemnity payments are triggered when actual revenue, (𝑅𝑎𝑟𝑝) is less than the revenue
guarantee (𝑅𝑔𝑟𝑝). Producers are paid the difference between the two. Simulations were
performed for this policy over two scenarios with C ranging from 55% (0.55) to 85% (0.85) at 15% higher coverage levels.
Yield Protection
The yield protection model was simulated in a similar fashion to the RP simulations to analyze producer revenues, mean indemnity payments, the probability of an indemnity payment occurring, and the mean indemnity payment over all observations where an indemnity was triggered for every location and cultivar combination. For YP, revenue per acre guarantees
(𝑅𝑔𝑦𝑝) are estimated for each observation based on a given APH, coverage level (C) and
13 𝑅𝑔𝑦𝑝 = 𝐴𝑃𝐻 × 𝐶 × 𝑃𝑝.
Coverage level can range from 50%-85% (0.50-0.85) depending on producer preference but, we simulate only for 55%, 70% and 85% coverage levels. For RP, a producer’s projected revenue
(𝑅𝑎𝑦𝑝) for insurance purposes is based on adjusted paddy yield (𝑌𝑎𝑑𝑗) and projected paddy rice
price ((𝑃𝑝):
𝑅𝑎𝑦𝑝 = 𝑌𝑎𝑑𝑗× 𝑃𝑝.
Indemnity payments are triggered when actual revenue per acre (𝑅𝑎𝑦𝑝) is less than the revenue
per acre guarantee (𝑅𝑔𝑦𝑝). Producers are paid the difference between the two. This model was
run with C ranging from 55% (0.55) to 85% (0.85) at 15% intervals for coverage levels. Milling Revenue Protection
As noted earlier, there is a gap in revenue insurance for producers whose milling is above 48% HRY and 68% MRY but one or both of these rates is below 55% HRY and 70% MRY. Such a gap suggests exploring an insurance policy that would protect producers from losses due to such milling deficiencies. In this section we propose a policy much like RP, which we call milling revenue protection (MRP), with provisions to provide producers with coverage for milling deficiencies. In designing and simulating such a policy it is our intention to find the fair market value of such a policy (the mean indemnity) and compare the stability of actual producer
revenues under such a policy. For MRP, revenue guarantees are equivalent to 𝑅𝑔𝑟𝑝 in (5). For
MRP, a producer’s realized revenue (RR) which is (3) using the price adjustment due to milling yield deviations as in (4)
Indemnity payments are triggered when actual revenue RR is less than the revenue
guarantee (𝑅𝑔𝑟𝑝). Producers are paid on the difference between the two. This model was
14 USDA Cost Estimator
To evaluate the RP and YP programs, premium levels were needed for each location and
cultivar. The USDA Cost Estimator17 program was used to estimate the producer paid
premium18 per acre for a given location and cultivar. It should be noted that even though
simulations vary between hybrid and conventional, no distinction is made by the Cost Estimator on the basis of cultivar. Therefore, differing by cultivar characteristics might favor one cultivar over the other. For each research station, location was defined as the county in which the station
resided. In addition to that, each location and cultivar’s APH for the most recent four years19 of
data was used as “Approved Yield” and “Rate Yield”. Since there were no substitution yields or
yield floors used, Approved Yield always equaled Rate Yield.20 We also assumed complete
ownership of the crop by producers, so “Insured Share Percent” always equaled 100%. The projected prices were left at the 100% published price level at $0.104/lbs. After all the information was inputted, the “Get Estimates” button was selected. “Producer Premium Amount” was selected and the premium values for RP and YP are given at various coverage levels.
IV. Results
Sample Characteristics and Estimation
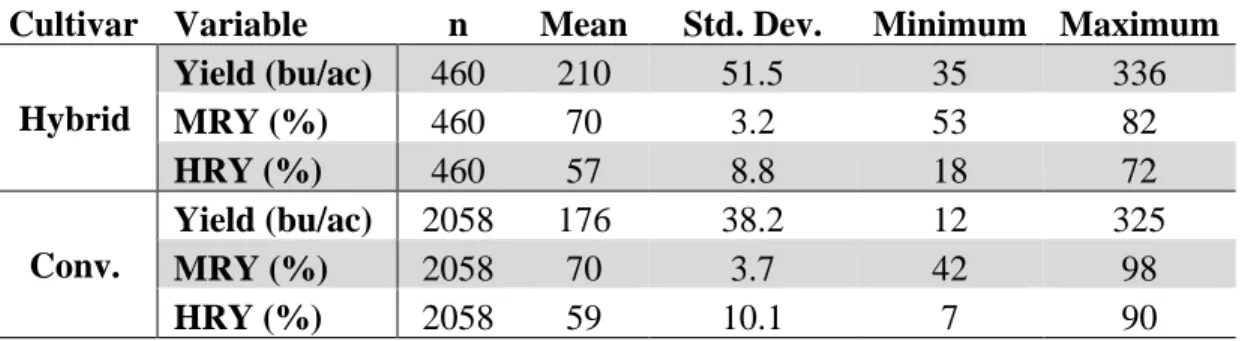
As indicated in Table 1 for all observations pooled, hybrid cultivars have 19% higher (p < 0.01) paddy yields than conventional cultivars across all locations. This is consistent with the previous literature about hybrid yield production versus conventional yield production (Jiang, 2016). Hybrids also have larger yield variability (p < 0.01) than conventional cultivars with a hybrid standard deviation of 51.5 bushels compared with 38.2 bushels for conventional cultivars. Hybrid and conventional MRY are statistically equal to the industry standard of 70%. Hybrid
15
HRY averages 2% lower (p < 0.01) compared to conventional cultivars, offsetting the hybrid rough rice yield advantage. While hybrid cultivars exhibit lower HRY, hybrid cultivars also have lower milling variation than conventional cultivars by 0.5% for MRY (3.2% for hybrid versus 3.7% for conventional, p < 0.01) and 1.3% for HRY (8.8% for hybrid versus 10.1% for conventional, p < 0.01).
The sample data from the six research locations over ten years gives a baseline for the cultivar characteristics in Arkansas (Table 2). Location exhibits an important role in production variability, and the location differences on paddy yield, MRY, and HRY and their dispersions are shown in Table 2. Paddy yields were the lowest in Rohwer which is the southernmost of the six locations. Milling quality was also the worst in Rohwer. Newport and Corning posted the highest paddy yields, and Corning had higher MRY and HRY for both hybrid and conventional cultivars than any other location. In five of the six locations, hybrids had a larger yield standard deviation than conventional cultivars.
As is clear from Tables 3 and 4 that display premiums for RP and YP, Newport clearly has the highest premiums. This could be explained by high yields and large standard deviations, but Keiser has high standard deviations although lower mean yields but premiums roughly 67% those of Newport. This seeming anomaly may be explained by a claims history not evident in our data. This anomaly may also be an artifact that the six locales are at one specific point in each county. The premiums likely reflect actual claims histories from the entire county over many years which may exhibit variability not evident in our site-specific data.
Differences Between Revenue Protection and Yield Protection
Location affects yield and milling quality due to differences such as soil type and climate. This suggests different cultivars may be more suitable to some locations and insurance
16
policy types. Results from simulating production and revenue based on location, cultivar, and climate under RP and YP are displayed in Tables 3 and 4 for coverage at 55%, 70% and 85%. “Loss-Cost Ratio” is the mean indemnity payment over 1,000 iterations divided by producer paid premium. The larger the ratio, the more valuable the crop insurance plan and vice versa. In three locations, Stuttgart, Rohwer and Pine Tree, showed RP and YP policies have higher ratios for hybrid cultivars than conventional cultivars. The opposite happened in Newport and
Corning, and in Keiser neither cultivar exhibited substantive differences in loss cost ratios. The average of the 18 (six locations across the three buy-up levels) Loss-Cost ratios for hybrids (2.15 (RP) and 2.10 (YP)) and the 18 for conventionals (1.79 (RP) and 1.63 (YP)) show that the mean for hybrids is greater in tables 3 and 4 are than the respective means for conventionals.
Moreover, the mean Lost-Cost ratios for RP exceed those of YP for the respective cultivars. For RP and YP, hybrid cultivars grown in Stuttgart proved to have highest Loss-Cost ratios at the 55%, 70% and 85% coverage levels across the six locations. This is undoubtedly due to the high Stuttgart APH for hybrids (222 bu/ac) relative to the mean yield (202 bu/ac) when compared with conventionals’ APH (180 bu/ac) compared to mean yield (173 bu/ac). In Newport a reverse situation appears where APH is much lower (34 bu/ac lower) for hybrids than their mean yields and not nearly as large of a spread for conventionals. Newport’s loss cost ratios are much lower than Stuttgart’s for both hybrid and conventional cultivars. In the Corning case the APH for hybrids (228 bu/ac) is lower than the mean hybrid yield (244 bu/ac) but
conventionals’ APH (204 bu/ac) is higher than its mean (193 bu/ac). The location least affected by differences between APHs and their respective mean yields is Pine Tree where APH for hybrids equals its mean, 206 bu/ac, and conventionals’ APH differ by 1 bu/ac. At that location, hybrids have higher loss-cost ratios for both RP and YP. Since the mean yield advantage for
17
hybrids is offset by its APH, the difference might be due to the greater variability of hybrid yields.
These results indicate that having an APH higher than the long-term yield trend is advantageous for producers. So, producers with a low APH relative to their long term mean yields are less likely to benefit from YP or RP. In our simulations, the premia are not calibrated sufficiently to offset this disadvantage.
An intriguing pattern emerges in the magnitudes of loss cost ratios going from 55% to 70%. For both policies, all locations and both cultivars, the loss cost ratios increase in going from 55% to 70%. For RP, in eleven of the twelve scenarios, loss cost ratios decline in going from 70% to 85%. A different result occurs for YP. In seven of the twelve scenarios, the loss cost ratio increases between the 70% to 85% buy-up although the loss ratios from 70% to 85% are within 2%-3% of each other, much closer than in the RP case. Revenue protection policies proved to have higher indemnity to premium ratios than YP policies for every location and both cultivars at the 55% and 70% levels except for hybrids in Stuttgart. At the 85% level, nine of the twelve comparisons favored YP. On average, at 55% and 70%, RP loss cost ratios exceeded YP ratios by 0.38 and 0.14. At 85%, the mean YP ratio exceeded the mean RP ratio by 0.22. However, if coverage is at the 85% level, YP is likely preferable. This suggests RP has a better return on premia at the 55% and 70% levels.
In differentiating by cultivar and buy-up level, the mean RP loss cost ratio for
conventionals exceeds those for YP by 0.6 and 0.10 at 55% and 70%. In contrast, at 85% the mean hybrid YP loss cost ratio exceeds the mean RP ratio by 0.13. So, there is some interaction between cultivar, policy type and buy-up level.
18
Revenue protection policies also had higher mean indemnity payments and indemnity frequencies for every cultivar, location and buy-up level. Revenue protection policies also have higher premium costs than YP policies to accommodate for increased protection against price fluctuations. The premiums between hybrid cultivars and conventional cultivars were roughly equal for a given policy type (RP or YP) at a given location. On average, RP premiums were 12% higher for hybrid cultivars compared to conventional cultivars, and YP premiums were 10% higher for hybrid cultivars compared to conventional cultivars. Since crop insurance policies do not factor in cultivar variation in premium costs, hybrid cultivars mean differences in loss cost ratios between hybrid and conventional cultivars averaged over buy-up levels are 0.37 for RP and 0.47 for YP. However, if Stuttgart is removed from these calculations, the mean differences reduce to 0.07 and 0.04. So, it appears hybrids have an edge in return per dollar of premium in both RP and YP policies, likely due to the increase in yield variation for hybrid cultivars over conventional cultivars.
Milling Revenue Protection
Our proposed MRP policy can only be evaluated on indemnity frequency and mean indemnity paid since the premium costs cannot be calculated with the USDA Cost Estimator. The mean indemnities and indemnity frequencies by cultivar and location are displayed in Table 5. As to be expected, the mean indemnities and frequencies of indemnities for MRP exceed those for RP. Across all coverage levels, the MRP mean indemnity for hybrids was 20% higher than for the mean RP indemnity. Likewise, the mean MRP indemnity across all conventional cultivars was 18.7% higher than the mean RP conventional cultivar indemnity. The gap between MRP and YP is greater with mean MRP hybrid indemnities 148% higher than mean YP
19
YP by 109%. Figures 2 and 3 show that MRP provides producers with increased mean indemnity payments (Figure 2) and increased indemnity frequencies (Figure 3) although the margins between MRP and RP indemnities are narrow, they do expand with the buy-up level. The increased indemnity payments and frequencies come from expanding the quality adjustment threshold. As a consequence, premiums for MRP would likely be higher than for RP, roughly 20% given the increase in the mean indemnities cited above.
Producer Revenue Risk Reduction
In Tables 6-8, mean producer realized revenue is shown with and without mean indemnity payments from RP, YP, and MRP. Comparing realized revenue between hybrid cultivars and conventional cultivars, hybrids have higher revenues than conventional cultivars across all locations as would be expected given hybrid’s higher mean yields. Conventional cultivars, however, have lower variation in realized revenue than hybrid cultivars, as shown by the standard deviations in Tables 6-8. The same holds true for realized revenue plus indemnity payments. Hybrid cultivars have higher variability than conventional cultivars in realized revenue. As shown in the tables, coefficients of variation (standard deviation divided by the mean) which are measures of relative risk, are lower in realized revenue for conventional cultivars. For total revenue, the RP has seventeen of eighteen differences (three buy-up levels for each location) in coefficients of variation favor hybrids as riskier. The same is true in YP and MRP. For YP, seventeen of eighteen differences favor conventional cultivars as less risky which is also true for MRP in seventeen of eighteen cases.
When comparing crop insurance policies, Tables 6-8 show that RP and MRP decrease producer revenue variation more compared to YP. Producers selecting RP or MRP can expect to see higher realized revenues (with indemnities) than those who enroll in YP (Figure 4).
20
Premiums are not deducted out of the mean revenues (because we have no premium for MRP), but in viewing Figure 4, even with premiums deducted, producer profits will likely still be greater under RP and MRP given the generally small differences in RP and YP premiums displayed in Tables 3 and 4. There is minimal realized revenue variation difference between RP and MRP although total revenues under MRP have lower standard deviations for all locations and cultivars. Given that the margins are small between indemnity payments between RP and MRP, the differences in total revenues (with indemnities) are also negligible.
Cultivar Selection
Producers make annual decisions on cultivar selection and crop insurance policy
selection. As demonstrated in Tables 1 and 2, hybrids have higher mean yields and variation in annual yields than conventional cultivars. This is reflected in the revenues in Tables 6-8. This variation carries over when indemnities are added to realized revenues. Hybrid cultivars have higher variation among realized revenues (with indemnities) than conventional cultivars for all locations, policy types and buy-up levels. As noted earlier, hybrid seed costs more than conventional seed and has higher overall operating costs so this must be considered adjusting expected net revenues.
As evident from the results in Tables 3 and 4, cultivar selection and the best ratio of indemnity to premium is very much influenced by the difference between APH and mean yields over a longer period of time. The most neutral site for comparing hybrid versus conventional is Pine Tree. For both RP and YP, hybrids have higher loss cost ratios than conventional cultivars. Moreover, the reduction in revenue standard deviations due to insurance is less for conventional cultivars in four of the six locations with Newport and Corning the exceptions.
21
V. Conclusion
The 2014 Farm Bill made crop insurance the cornerstone for risk management in the rice industry. Our analysis shows that hybrid cultivars generate higher variability in producer
realized revenues and higher total realized revenues compared to conventional cultivars. Producers must decide between selecting a less risky cultivar or a cultivar with the potential of higher revenues with greater risk. Our analysis also showed that hybrids had higher mean (averaged over the six locations) Loss-Cost ratios over conventional cultivars for any buy-up level for both RP and YP policy types. Our analysis indicates hybrids offered a better return on premiums than conventional cultivars when APH equaled long run expected yields for both yield protection and revenue protection. While this finding is particular to a given county and requires further research, it suggests that because of different yield and milling characteristics, perhaps premia should be determined separately for hybrids versus conventional cultivars. While cultivar currently is partially incorporated into premia via the APH effect, the greater variability of hybrid yields, and poorer milling properties are not. Our results also indicate the sensitivity of loss cost ratios to the relationship of APH to longer term yield trends. An APH higher than the longer-term trend indicates better returns to policies and the reverse for APH lower than longer term trend.
Arkansas rice producers showed a clear preference for yield protection policies over revenue protection policies in 2018. This is somewhat perplexing because our results show that RP has a better return per dollar of premium at lower buy-up levels (55% and 70%) and YP at 85% buy-up. Since Arkansas rice producers have displayed a clear preference for lower buy-up levels, RP would seem the policy type to be preferred. Our results also show increasing loss cost
22
ratios going from 55% to 70% buy-up, so it would seem rice producers should be purchasing higher buy-up levels.
Revenue protection as currently sold does not provide protection against adverse milling yields except in extreme cases. Our proposed milling revenue protection policy of covering all adverse milling yields at some level indicate that such coverage would further decrease total revenue variability. To pay for this additional protection, higher premiums would likely be charged than current revenue protection premiums which we estimate at a 20% increase.
Our analysis focused on two existing policies—revenue protection and yield protection— and a third that insures producers against more modest milling quality deviations than is the current policy. As Karov et al. concluded in their study on crop insurance in the Southern United States, current crop insurance does not protect producers’ profit margins in the South. The rice margin protection policy currently offered by RMA has not been popular. High energy costs due to irrigation are the main source of variation in Arkansas production costs. An insurance policy based solely on irrigation needs throughout the growing season is deserving of further
23
VI. Endnotes
1http://www.ers.usda.gov/data-products/state-fact-sheets.aspx Accessed June 27,2018
2Authors’ computations from RMA and NASS data.
3Author’s computations using RMA data for YP, CAT, RP and RPHPE policies sold.
4For insurance purposes, actual revenue is actual paddy yield times the September mean of the
November rough rice closing price. Yield protection follows the same model except price stays constant between revenue guarantee and actual revenue.
http://www.rma.usda.gov/fields/ms_rso/2014/ricearkmstn.pdf
5https://prodwebnlb.rma.usda.gov/apps/SummaryofBusiness/
6 Usable observations were not available for 2011. Data were obtained from:
University of Arkansas Cooperative Extension Service (UACES). Various Years. Arkansas rice performance trials (ARPT). Available at:
http://www.aragriculture.org/crops/rice/PerfTrials/default.htm
7 Personal communication, Donna Frizzel, June 25, 2014.
8 http://www.awhere.com/en-us/weather-details
9 VPD is a measure of humidity.
10 The logit transformation was used to avoid getting predicted MRY greater than one or less
than zero.
11 The exact formula is: EXP(ln(0.139)-(0.5*(.10)2)*(0.75)+( ε)*(0.10)*(0.75)0.5) where ε is a
randomly generated standard normal random variable.
12 https://prodwebnlb.rma.usda.gov/apps/PriceDiscovery/GetPrices/YourPrice
13
https://www.rma.usda.gov/-/media/RMAweb/Handbooks/Coverage-Plans---18000/Crop-Insurance-Handbook---18010/2019-Crop-Insurance-Handbook.ashx
14 Marvin Dearien, Rain and Hail, LLC. Personal communication, August 27, 2014
15
https://www.fsa.usda.gov/Assets/USDA-FSA-Public/usdafiles/Price-Support/pdf/2017/2017ricelr.pdf
16 If P
adj in (4) is divided by Ph we get QAF55/70.
17 https://ewebapp.rma.usda.gov/apps/costestimator/
24
18 Crop insurance premiums are subsidized by the federal government.
19 APH for each location and cultivar was estimated as the 4-year average paddy yield for 2009,
2010, 2012, 2013.
25
VII. References
Cooper, N. T. W., T. J. Siebenmorgen, and P. A. Counce. (2008). Effects of nighttime
temperature during kernel development on rice physicochemical properties. Cereal
Chemistry, 85, 276-282.
Hardke, J. T. (2018). Trends in Arkansas rice production. In R. J. Norman and K. A. K.
Moldenhauer (Eds.), B.R. Wells Arkansas Rice Research Studies 2017, (pp. 11-21).
Fayetteville: University of Arkansas System Division of Agriculture.
Hardke, J., T. Siebenmogen. “Rice Grades”. Rice Production Handbook. MP192. J. T Hardke,
ed. Cooperative Extension Service, University of Arkansas Division of Agriculture. 2013. http://www.uaex.edu/publications/pdf/mp192/chapter-13.pdf
Hull, J. C. (2014). Options, Futures, and other Derivatives. Ninth Ed. Pearson, Boston.
Jiang, P., Xie, X., Huang, M., Zhou, X., Zhang, R., Chen, J., Wu, D., Xia, B., Xiong, H., Xu, F., Zou, Y. (2016). Potential yield increase of hybrid rice at five Locations in southern china. Rice, 9(1), 11.
Karov, V., Wailes, E.J., and Watkins, K.B.“Crop Insurance Challenges and Prospects for
Southern Irrigated Farms: the Case of Arkansas.” Selected paper presented at the Southern Agricultural Economics Association (SAEA) Meetings, Orlando, Florida, February 2-5, 2013.
http://ageconsearch.umn.edu/bitstream/142969/2/SAEA%202013%20Crop%20Insurance %20Paper.pdf
Lanning, S. B., T. J. Siebenmorgen. (2011). Comparison of milling characteristics of hybrid and
pureline rice cultivars. Applied Engineering in Agriculture, 27(5), 787-795.
Lyman, N. B., K. S. V., Jagadish, L. L. Nalley, B. L. Dixon, T. J. Siebenmorgen. (2013). Neglecting rice milling yield and quality underestimates economic losses from high
temperature stress. PLOS One, 8(8), doi: 10.1371/journal.pone.0072157
Mane, R. and B. Watkins. “Stochastic Analysis of Margin Protection (MP) Crop Insurance in Arkansas Rice Production.” Selected paper presented at the Southern Agricultural Economics Association (SAEA) Meetings, San Antonio, Texas, February 6-9, 2016. https://ageconsearch.umn.edu/record/266698?ln=en
Nalley, L. L., B. L. Dixon, K. Brye, C Rogers, H Myrteza and R. J. Norman. (2014). Estimating cultivar effects on water usage and greenhouse gas emissions in rice production.
Agronomy Journal, 106(6), 1981-1992.
Risk Management Association, United States Department of Agriculture. “Rice Loss Adjustment Standards Handbook”. 2018.
https://www.rma.usda.gov/-26
/media/RMAweb/Handbooks/Loss-Adjustment-Standards---25000/Rice/2018-25410-1-Rice-Loss-Adjustment-Standards.ashx
Risk Management Association, United States Department of Agriculture. “Federal Crop Insurance Corporation. Commodity Year Statistics for 2014”. 2014.
https://www3.rma.usda.gov/apps/sob/current_week/crop2014.pdf
Risk Management Association, United States Department of Agriculture. “Federal Crop Insurance Corporation. Commodity Year Statistics for 2017”. 2017.
https://www3.rma.usda.gov/apps/sob/current_week/crop2017.pdf
Risk Management Association, United States Department of Agriculture. “Federal Crop Insurance Corporation. Commodity Year Statistics for 2018”. 2018.
https://www3.rma.usda.gov/apps/sob/current_week/crop2018.pdf
Watkins, B., R. Baker, T. Barber, N. Bateman, C. Elkins, T. Faske, M. Hamilton, J. Hardke, G. Lorenz, R. Mazzanti, C. Norton, B. Robertson and G. Studebaker. “2018 Crop Enterprise Budgets for Arkansas Field Crops Planted in 2018”. AG-1292. Division of Agriculture Research & Extension.
https://www.uaex.edu/farm-ranch/economics-marketing/farm-planning/budgets2016/ Budgets_Manuscript.pdf
Zulauf, C., J. Coppess, G. Schnitkey, and N. Paulson. “Premium Subsidy and Insured U.S.
Acres: Differential Impact by Crop.” farmdoc daily (8):86, Department of Agricultural
27
VIII. Appendix
Tables
Table 1. Mean paddy yield, MRY, and HRY by cultivar 2003-2013
Cultivar Variable n Mean Std. Dev. Minimum Maximum Hybrid Yield (bu/ac) 460 210 51.5 35 336 MRY (%) 460 70 3.2 53 82 HRY (%) 460 57 8.8 18 72 Conv. Yield (bu/ac) 2058 176 38.2 12 325 MRY (%) 2058 70 3.7 42 98 HRY (%) 2058 59 10.1 7 90 Note: Data does not include 2011 because of insufficient observations
28
Table 2: Mean paddy yield, MRY, HRY and APH by location and cultivar (2003-2013)
Location Variety n APH (bu/ac) Yield (bu/ac) MRY (%) HRY (%)
Stuttgart Hybrid 83 222 202 70 58 Std. Dev. 41.8 1.9 5.3 Conventional 413 180 173 70 63 Std. Dev. 27.8 2.4 5.7 Keiser Hybrid 93 196 189 69 56 Std. Dev. 59.7 4.0 8.3 Conventional 425 185 172 69 57 Std. Dev. 42.6 4.9 10.1 Rohwer Hybrid 34 160 171 67 48 Std. Dev. 33.0 6.7 19.2 Conventional 158 150 151 69 52 Std. Dev. 33.3 6.1 19.0 Newport Hybrid 99 186 220 70 59 Std. Dev. 50.7 2.2 5.7 Conventional 426 161 177 70 59 Std. Dev. 44.4 2.5 7.3 Corning Hybrid 97 228 244 71 60 Std. Dev. 40.8 1.6 7.6 Conventional 395 204 193 71 60 Std. Dev. 34.1 2.7 11.3 Pine Tree Hybrid 54 206 206 70 57 Std. Dev. 38.2 2.5 5.7 Conventional 241 171 172 71 60 Std. Dev. 30.1 3.0 6.3
29
Table 3. Revenue protection mean indemnities, frequencies and returns to premiums
Note: Mean indemnities are estimated over 1,000 iterations
Producer Premium ($) Mean Indemnity ($) Indemnity Frequency (%) Loss-Cost Ratio Coverage Level Coverage Level Coverage Level Coverage Level Location Cultivar 55% 70% 85% 55% 70% 85% 55% 70% 85% 55% 70% 85% Stuttgart Hybrid 5.00 14.00 40.00 19.96 68.37 156.72 17.7 42.8 64.7 3.99 4.88 3.92 Conv. 4.00 11.00 34.00 7.91 30.95 83.12 8.6 27.9 51.2 1.98 2.81 2.44 Keiser Hybrid 8.00 18.00 51.00 12.21 42.75 102.81 12.1 31.7 51.3 1.53 2.38 2.02 Conv. 7.00 18.00 49.00 11.19 38.71 98.23 12.2 31.7 54.9 1.60 2.15 2.00 Rohwer Hybrid 5.00 12.00 36.00 10.49 31.00 70.96 12.4 25.6 42.8 2.10 2.58 1.97 Conv. 5.00 11.00 34.00 6.36 23.12 58.36 8.5 23.0 42.8 1.27 2.10 1.72 Newport Hybrid 15.00 29.00 73.00 4.92 20.40 55.02 5.8 18.1 33.6 0.33 0.70 0.75 Conv. 14.00 26.00 66.00 6.29 21.93 54.85 8.1 19.6 37.0 0.45 0.84 0.83 Corning Hybrid 9.00 21.00 60.00 16.93 55.71 128.08 15.0 32.7 54.4 1.88 2.65 2.13 Conv. 8.00 20.00 55.00 19.86 63.98 143.69 18.5 42.0 63.2 2.48 3.20 2.61 Pine Tree Hybrid 8.00 19.00 54.00 9.64 37.21 94.65 10.6 27.0 48.0 1.20 1.96 1.75 Conv. 7.00 16.00 47.00 5.83 23.27 64.46 7.0 22.9 43.1 0.83 1.45 1.37
30
Table 4. Yield protection mean indemnities, frequencies and returns to premiums
Producer Premium ($) Mean Indemnity ($)
Indemnity Frequency
(%) Loss-Cost Ratio Coverage Level Coverage Level Coverage Level Coverage Level Location Cultivar 55% 70% 85% 55% 70% 85% 55% 70% 85% 55% 70% 85% Stuttgart Hybrid 3.00 9.00 24.00 12.46 49.83 123.74 13.7 36.3 58.7 4.15 5.54 5.16 Conv. 3.00 8.00 21.00 4.49 20.28 62.17 6.3 21.4 44.6 1.50 2.53 2.96 Keiser Hybrid 6.00 14.00 37.00 6.85 29.82 79.07 9.5 25.3 45.7 1.14 2.13 2.14 Conv. 5.00 13.00 35.00 5.73 26.28 75.40 8.3 24.9 48.7 1.15 2.02 2.15 Rohwer Hybrid 4.00 9.00 24.00 5.48 20.79 53.50 8.5 20.5 37.8 1.37 2.31 2.23 Conv. 4.00 8.00 24.00 2.78 14.56 43.26 5.4 18.6 37.2 0.69 1.82 1.80 Newport Hybrid 13.00 23.00 59.00 1.93 11.22 37.26 2.7 11.8 28.5 0.15 0.49 0.63 Conv. 12.00 21.00 54.00 2.78 13.41 39.54 5.0 14.5 32.5 0.23 0.64 0.73 Corning Hybrid 7.00 16.00 43.00 9.39 39.07 99.85 11.0 27.1 47.7 1.34 2.44 2.32 Conv. 6.00 15.00 40.00 11.92 47.17 114.61 14.0 36.6 57.4 1.99 3.14 2.87 Pine Tree Hybrid 6.00 14.00 39.00 4.79 24.30 68.95 6.2 20.5 41.8 0.80 1.74 1.77 Conv. 5.00 12.00 34.00 3.01 14.88 46.12 4.6 17.3 35.2 0.60 1.24 1.36
31
Table 5. Milling revenue protection mean indemnities, frequencies and returns to premiums
Mean Indemnity ($) Indemnity Frequency (%) Coverage Level Coverage Level
Location Cultivar 55% 70% 85% 55% 70% 85% Stuttgart Hybrid 26.38 82.04 177.49 22.3 47.3 68.2 Conv. 10.22 36.52 93.68 10.7 31.2 54.8 Keiser Hybrid 16.92 54.81 123.34 15.9 37.9 56.5 Conv. 14.93 47.87 114.18 15.6 36.6 59.6 Rohwer Hybrid 12.64 36.70 81.46 15.0 29.5 47.4 Conv. 7.60 27.72 69.30 10.4 27.6 49.6 Newport Hybrid 6.13 24.98 65.69 7.3 21.8 39.1 Conv. 8.29 27.91 66.80 11.1 24.5 42.7 Corning Hybrid 22.46 70.69 153.37 19.7 39.5 59.2 Conv. 24.01 75.39 163.57 22.4 48.0 68.7 Pine Tree Hybrid 13.68 46.84 110.13 14.1 31.1 52.3 Conv. 8.50 30.72 77.28 10.5 27.3 47.3
32
Table 6. Realized producer revenue by location and cultivar under revenue protection ($/ac)
Mean Realized Revenue
Mean Indemnity Mean Total Revenue Coverage Level Coverage Level Location Cultivar 55% 70% 85% 55% 70% 85% Stuttgart Hybrid 927.28 19.96 68.37 156.72 947 996 1084 Std. Dev. 322 56 109 167 300 264 220 CV 0.35 2.79 1.60 1.07 0.32 0.27 0.20 Conv. 842.53 7.91 30.95 83.12 850 873 926 Std. Dev. 264 33 68 114 253 232 197 CV 0.31 4.17 2.21 1.37 0.30 0.27 0.21 Keiser Hybrid 910.88 12.21 42.75 102.81 923 954 1014 Std. Dev. 306 42 84 136 291 264 225 CV 0.34 3.40 1.97 1.32 0.32 0.28 0.22 Conv. 852.01 11.19 38.71 98.23 863 891 950 Std. Dev. 265 37 78 125 251 228 193 CV 0.31 3.34 2.01 1.27 0.29 0.26 0.20 Rohwer Hybrid 849.79 10.49 31.00 70.96 860 881 921 Std. Dev. 302 36 70 110 288 269 240 CV 0.36 3.41 2.24 1.55 0.34 0.31 0.26 Conv. 780.73 6.36 23.12 58.36 787 804 839 Std. Dev. 249 26 55 93 241 225 199 CV 0.32 4.07 2.39 1.59 0.31 0.28 0.24 Newport Hybrid 1057.25 4.92 20.40 55.02 1062 1078 1112 Std. Dev. 361 26 57 101 354 339 312 CV 0.34 5.20 2.79 1.84 0.33 0.31 0.28 Conv. 855.34 6.29 21.93 54.85 862 877 910 Std. Dev. 276 27 57 96 268 252 227 CV 0.32 4.29 2.60 1.74 0.31 0.29 0.25
33
Table 6. Cont.
Mean
Realized Revenue
Mean Indemnity Mean Total Revenue
Coverage Level Coverage Level Location Cultivar 55% 70% 85% 55% 70% 85% Corning Hybrid 1071.27 16.93 55.71 128.08 1088 1127 1199 Std. Dev. 371 52 104 164 352 320 277 CV 0.35 3.07 1.87 1.28 0.32 0.28 0.23 Conv. 876.46 19.86 63.98 141.69 896 940 1020 Std. Dev. 282 54 103 155 260 226 185 CV 0.32 2.72 1.61 1.09 0.29 0.24 0.18 Pine Tree Hybrid 980.86 9.64 37.21 94.65 990 1018 1076 Std. Dev. 330 37 80 134 318 293 256 CV 0.34 3.84 2.15 1.42 0.32 0.29 0.24 Conv. 851.73 5.83 23.27 64.46 858 875 916 Std. Dev. 269 28 59 101 261 243 213 CV 0.32 4.80 2.54 1.57 0.30 0.28 0.23
34
Table 7. Realized producer revenue by location and cultivar under yield protection ($/ac)
Mean Realized Revenue
Mean Indemnity Mean Total Revenue Coverage Level Coverage Level Location Cultivar 55% 70% 85% 55% 70% 85% Stuttgart Hybrid 927.28 12.46 49.83 123.74 940 977 1051 Std. Dev. 322 39 89 146 307 278 239 CV 0.35 3.15 1.79 1.18 0.33 0.28 0.23 Conv. 842.53 4.49 20.28 62.17 847 863 905 Std. Dev. 264 22 53 96 258 242 213 CV 0.31 4.87 2.62 1.54 0.30 0.28 0.24 Keiser Hybrid 910.88 6.85 29.82 79.07 918 941 990 Std. Dev. 306 28 67 116 297 275 242 CV 0.34 4.07 2.25 1.47 0.32 0.29 0.24 Conv. 852.01 5.73 26.28 75.40 858 878 927 Std. Dev. 265 25 60 106 257 238 207 CV 0.31 4.29 2.30 1.41 0.30 0.27 0.22 Rohwer Hybrid 849.79 5.48 20.79 53.50 855 871 903 Std. Dev. 302 23 53 92 294 278 252 CV 0.36 4.24 2.57 1.71 0.34 0.32 0.28 Conv. 780.73 2.78 14.56 43.26 784 795 824 Std. Dev. 249 15 40 75 245 232 209 CV 0.32 5.34 2.74 1.74 0.31 0.29 0.25 Newport Hybrid 1057.25 1.93 11.22 37.26 1059 1068 1095 Std. Dev. 361 14 39 79 358 347 325 CV 0.34 7.25 3.48 2.12 0.34 0.32 0.30 Conv. 855.34 2.78 13.41 39.54 858 869 895 Std. Dev. 276 15 41 77 272 260 238 CV 0.32 5.40 3.06 1.95 0.32 0.30 0.27
35
Table 7. Cont.
Mean
Realized Revenue
Mean Indemnity Mean Total Revenue
Coverage Level Coverage Level Location Cultivar 55% 70% 85% 55% 70% 85% Corning Hybrid 1071.27 9.39 39.07 99.85 1081 1110 1171 Std. Dev. 371 34 82 140 359 332 294 CV 0.35 3.62 2.10 1.40 0.33 0.30 0.25 Conv. 876.46 11.92 47.17 114.61 888 924 991 Std. Dev. 282 39 84 136 267 238 202 CV 0.32 3.27 1.78 1.19 0.30 0.26 0.20 Pine Tree Hybrid 980.86 4.79 24.30 68.95 986 1005 1050 Std. Dev. 330 24 61 111 323 304 273 CV 0.34 5.01 2.51 1.61 0.33 0.30 0.26 Conv. 851.73 3.01 14.88 46.12 855 867 898 Std. Dev. 269 17 44 83 264 252 227 CV 0.32 5.65 2.96 1.80 0.31 0.29 0.25
36
Table 8. Realized producer revenue by location and cultivar under milling revenue protection ($/ac)
Mean Realized Revenue
Mean Indemnity Mean Total Revenue Coverage Level Coverage Level Location Cultivar 55% 70% 85% 55% 70% 85% Stuttgart Hybrid 927.28 26.38 82.04 177.49 954 1009 1105 Std. Dev. 322 64 120 176 294 256 212 CV 0.35 2.41 1.46 0.99 0.31 0.25 0.19 Conv. 842.53 10.22 36.52 93.68 853 879 936 Std. Dev. 264 37 75 121 251 227 192 CV 0.31 3.61 2.04 1.29 0.29 0.26 0.20 Keiser Hybrid 910.88 16.92 54.81 123.34 928 966 1034 Std. Dev. 306 49 95 147 286 254 213 CV 0.34 2.90 1.73 1.19 0.31 0.26 0.21 Conv. 852.01 14.93 47.87 114.18 867 900 966 Std. Dev. 265 44 87 134 247 221 184 CV 0.31 2.96 1.82 1.17 0.28 0.25 0.19 Rohwer Hybrid 849.79 12.64 36.70 81.46 862 886 931 Std. Dev. 302 39 75 116 286 263 232 CV 0.36 3.09 2.04 1.43 0.33 0.30 0.25 Conv. 780.73 7.60 27.72 69.30 788 808 850 Std. Dev. 249 28 59 98 239 220 191 CV 0.32 3.73 2.15 1.41 0.30 0.27 0.22 Newport Hybrid 1057.25 6.13 24.98 65.69 1063 1082 1123 Std. Dev. 361 28 62 108 353 334 303 CV 0.34 4.57 2.48 1.64 0.33 0.31 0.27 Conv. 855.34 8.29 27.91 66.80 864 883 922 Std. Dev. 276 30 63 104 266 247 218 CV 0.32 3.62 2.26 1.56 0.31 0.28 0.24