Tools for measuring accessibility in an equity framework
Congress for the New Urbanism 23rd Annual MeetingDallas, Texas April 29 – May 2, 2015
ABSTRACT
Cities, planning agencies, and departments of transportation are growing more interested in evaluating the equity impacts of transportation. However, many lack a clear framework or
consistent measures for conducting comprehensive equity analyses. This paper presents an equity framework that can serve as a starting point for consistent equity analyses and focuses primarily on one dimension of that framework, accessibility, which is considered the primary function of transportation and therefore the principal dimension.
This paper also highlights several promising new tools for measuring accessibility and offers a critical review of each, based on existing literature and documentation. These tools incorporate multiple travel modes, various destination types, and information about transportation network performance to produce a variety of different metrics at different geographic scales. Despite not all of the tools being fully developed or widely available, the methods and data sources described in this paper demonstrate that it is possible to develop a tool that meets the many various needs of a comprehensive accessibility measure in an equity framework.
AUTHORS Chris McCahill
State Smart Transportation Initiative, University of Wisconsin 1180 Observatory Drive, Suite 7122
Madison, WI 53706 Email: [email protected] Phone: 608-262-7797 Mary Ebeling
State Smart Transportation Initiative, University of Wisconsin 1180 Observatory Drive, Suite 7122
Madison, WI 53706 Email: [email protected] Phone: 608-263-4744
McCahill & Ebeling
1
Tools for measuring accessibility in an equity framework
INTRODUCTIONCities, regional planning agencies, and state departments of transportation are growing more interested in evaluating the equity impacts of transportation planning, design and regulation. Recent federal transportation funding bills have played a key role in driving this interest,
particularly at the state and regional levels. Additionally, the most recent bill, the Moving Ahead for Progress in the 21st Century Act (MAP-21), establishes a performance management program that requires States to measure and track progress in key goal areas including safety, system performance and environmental sustainability.
With growing equity concerns in addition to the need for data-driven, performance-based decision-making, agencies responsible for the planning and operation of our transportation systems require advanced tools for measuring how well those systems meet equity-related goals. Unfortunately, many commonly used metrics are not particularly well suited for this task. For example, common mobility-related metrics such as congestion, delay and highway level of service (LOS) reflect values that might actually be at odds with community interests and equitable outcomes such as pedestrian accessibility (1). This paper shifts that focus from mobility to accessibility and presents an equity framework in which accessibility metrics play a key role.
CONCEPTS OF EQUITY AND ACCESSIBILITY
In the field of transportation, equity-related research has focused on many different facets
(2). Early work in the field concentrated on the economic impacts of transportation policies and investments (3). Economic considerations are still a common element of equity research. For example, research looks at the equity of road pricing (4–6), ramp metering (7), transportation utility fees based on trip generation (8), and other transportation funding mechanisms (9). Some work aims to understand equity primarily by evaluating the negative externalities associated with transportation (10, 11). These perspectives, however, consider only one particular outcome associated with transportation—usually a cost—rather than the extent to which a transportation system serves it intended purpose—providing access to a range of opportunities—equitably.
A majority of equity-related literature now focuses on some measure of accessibility (3, 12– 18). There are strong arguments to be made in favor of this approach. Martens (17) argues that accessibility best represents the social meaning of transportation in modern Western societies. To its advantage, this line of thinking allows us to evaluate transportation system performance independently from measures of mobility or measures the system’s component parts (e.g.,
vehicles, infrastructure, services and regulations). It captures linkages between transportation and land use that common mobility measures such as LOS do not and it shifts the focus of equity analyses from outputs (e.g., spending) to actual outcomes.
Unfortunately, accessibility has long been defined in a variety of ways (19, 20), making it difficult to evaluate the vast array of potential transportation policies and investments
consistently. In this paper, we present four emerging tools for measuring accessibility and, based on existing literature and documentation, evaluate how well they meet the needs of a
McCahill & Ebeling
2 A TRANSPORTATION EQUITY FRAMEWORK
Before focusing on accessibility measures, we outline a framework for conducting equity analyses more broadly. Accessibility is a key dimension within this framework for the reasons discussed above, but other factors such as public health and safety are equally important to consider when evaluating equity (21). We are reviewing metrics for each of these dimensions as part of a larger body of work, which is beyond the scope of this paper.
Equity dimensions
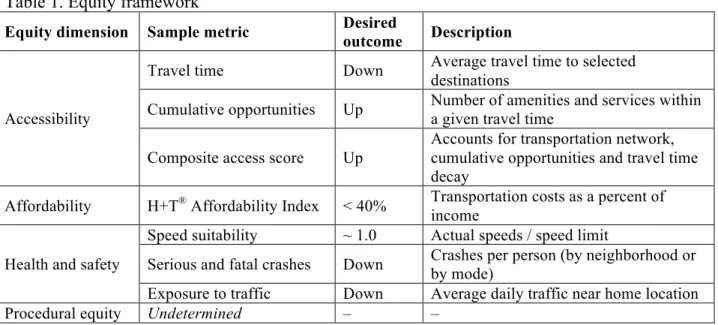
Four dimensions of equity are described below and outlined in Table 1.
Accessibility
Generally, accessibility measures reflect the ease of reaching meaningful destinations (e.g., work, school, shopping and services) from a particular location within a particular time or cost threshold. Therefore, accessibility increases as the number of nearby destinations increases or as the time and distance to reach to individual destinations decreases. Based on the research cited above (e.g., Martens, 2012), accessibility is considered the main utility of transportation and, therefore, the primary dimension in our equity framework. Emerging accessibility measures are described in detail below.
Affordability
Affordability measures reflect actual out-of-pocket travel costs in monetary terms rather than as time spent or distance traveled. While it is common to convert accessibility and mobility measures into monetary units, doing so makes it difficult to parse out specific issues such as long commute distances or access to an insufficient number of jobs. Moreover, specific affordability issues may be addressed through different mechanisms than accessibility issues—for example, through improved access to transit, better bicycle and pedestrian infrastructure, increased carpooling and car-sharing options, or direct subsidies.
Health and safety
It is not sufficient to measure accessibility or affordability in an equity framework if a transportation system poses considerable health and safety risks to its users or to non-users. Common health impacts from transportation include exposure to pollutants and the health effects of a sedentary lifestyle, attributable partly to a lack of active transportation (23). Safety impacts include the risk of death or injury from crashes or other transportation-related incidents. Some factors such as exposure to traffic apply mainly to nearby communities, while other factors like the risk of crashes or physical inactivity apply mainly to road users. Although not mutually exclusive, these two groups are worth differentiating.
Procedural equity
Procedural equity refers the processes through which transportation infrastructure and services are delivered and regulated. This dimension is decidedly more challenging to quantify. Important considerations include whether different groups of people are fairly represented through outreach efforts and opportunities to provide feedback to transportation agencies; whether the transportation system reflects the needs and interests of those different groups (both users and non-users); and whether regulations guiding the use of the transportation system treat different users fairly.
McCahill & Ebeling
3 Table 1. Equity framework
Equity dimension Sample metric Desired outcome Description
Accessibility
Travel time Down Average travel time to selected destinations
Cumulative opportunities Up Number of amenities and services within a given travel time
Composite access score Up
Accounts for transportation network, cumulative opportunities and travel time decay
Affordability H+T® Affordability Index < 40% Transportation costs as a percent of income
Health and safety
Speed suitability ~ 1.0 Actual speeds / speed limit
Serious and fatal crashes Down Crashes per person (by neighborhood or by mode) Exposure to traffic Down Average daily traffic near home location
Procedural equity Undetermined – –
Measuring equity
Equity analyses focus on evaluating how proportionately, or disproportionately, costs and benefits are distributed across different segments of the population. For example, we may be interested in whether one group of people has poor access to jobs and amenities compared to another group, or whether transportation is less safe or more costly for one group of people compared to another.
For our proposed framework, we identify various disadvantaged groups including commonly recognized environmental justice (EJ) groups, such as ethnic minorities and low-income groups, as well as other transportation-specific groups that may be disadvantaged, such as the physically disabled or those who do not drive personal vehicles. These groups are listed in Table 2. In our equity framework, described below, it is always necessary to compare outcomes for EJ and non-EJ groups. If conditions are worse for an non-EJ group, then interventions may be necessary.
Table 2. Common and transportation-specific environmental justice groups Conventional EJ groups Transportation-specific EJ groups
• Women
• Racial or ethnic minorities • Low-income groups
• Immigrant and Limited English Proficiency (LEP) groups
• Physically disabled • Children and seniors
• Non-drivers and non-car owners • Rural populations
AVAILABLE TOOLS FOR MEASURING ACCESSIBILITY
Accessibility measures often focus primarily on one specific mode or a limited set of destination types, such as jobs. For example, Walk Score, described below, considers a wide range of amenities and services, but focuses primarily on destinations accessible by walking. Other approaches focus explicitly on transit network coverage and connectivity, but do not take destinations into account (13, 14, 24, 25).
While these tools may be useful in conducting some types of equity analysis, their limitations are problematic. A truly useful tool must be multimodal and must incorporate information about
McCahill & Ebeling
4
network conditions, many types of destinations, demographics and, ideally, actual travel behavior. Recent advancements in geographic information systems (GIS), computing
capabilities, and data availability make this easier. The tools described below represent the most recent advancements in measuring accessibility and they share the potential for widespread use. Walk Score
Walk Score is a publicly available tool and perhaps the most ubiquitous accessibility measure available. Scores reflect the number of amenities and services that can be accessed by walking for virtually any address in the U.S. The company also provides scores for cycling and transit. Walk Score was originally developed by Front Seat, then acquired by Redfin, a residential real estate brokerage, late in 2014 (26).
Sugar Access
Sugar Access is a tool developed for the ArcGIS platform by Citilabs, which allows users to map and measure accessibility to jobs and other destinations by automobile, transit, biking, and walking. The tool—an extension of work originally for England’s Department of Transportation and now available for purchase—comes preloaded with transportation network data, points of interest (POI), roadway travel times and transit route and schedule information. It generates a variety of outputs, including travel times to various types of destinations, the number of destinations within a given travel time, and other composite accessibility measures. Users can edit the default values, such as destination weights, and they can alter the transportation networks to test outcomes under different scenarios (27).
Accessibility Observatory
Researchers at the University of Minnesota’s Accessibility Observatory have been tackling the issue of accessibility metrics since at least as early as 2006, when their first Access to Destinations report was released (20). They have produced Access Across America reports describing access to jobs by automobile and transit for major metropolitan areas (28, 29) and worked with the Minnesota Department of Transportation to and their techniques and consider both modes (30). The researchers also indicate that they hope to include accessibility measures for pedestrians and bicycle users.
Renaissance Planning Group
Research led primarily by Richard Kuzmyak at the Renaissance Planning Group focuses on developing a multimodal accessibility metric that includes scores for automobile, transit and pedestrian accessibility. This line of work includes a GIS Walk Accessibility Model, which was released as a downloadable tool in conjunction with the National Cooperative Highway Research Program (NCHRP) report, Estimating Bicycling and Walking for Planning and Project
Development: A Guidebook (31). More recently, Kuzmyak worked with the Maryland Department of Transportation to develop measures of automobile, transit and pedestrian accessibility for a corridor pilot study (32, 33).
A CRITICAL REVIEW Practical applications
In order to use the above accessibility measures for equity analyses, they must be adaptable for a variety of different uses. The most essential uses include:
McCahill & Ebeling
5
• Illuminating patterns of accessibility across different communities and geographic areas; • Comparing accessibility for different transportation modes or demographic groups; • Assessing accessibility at different geographic scales (e.g., local versus regional); • Identifying accessibility gaps due to poor transit coverage or transportation network
connectivity;
• Evaluating projects, policies, and other interventions by modeling changes in
accessibility under different scenarios (e.g., by adding or removing network connections, transit lines, or interventions like ramp metering);
• Tracking progress in improving accessibility; and • Communicating to the public (e.g., must be intuitive).
In each case it is important to ask whether the existing system or proposed changes to the system cause disparities between EJ and non-EJ groups. If EJ groups are underserved or overburdened, equity issues likely exist. Correcting those issues might require additional investments in the transportation network, improved transit service, changes in land use and housing policy, business development and relocation incentives, or other mitigation efforts. Comparison of available tools
A case study comparing all of the available tools would offer the greatest insight into the benefits and shortcomings of each tool, but that is beyond the scope of this exploratory study. In this section, we provide an overview of the characteristics that a promising accessibility tool should exhibit and describe how each of the tools addresses those needs, based on our review of existing literature and documentation. A summary is provided in Table 3.
Multimodality
All of the tools are multimodal some extent, but each has its limitations. Walk Score, for example, does not measure automobile accessibility, while the Accessibility Observatory does not yet measure bicycle or pedestrian accessibility. The Renaissance Planning Groupmeasures accessibility for automobiles, transit and pedestrians, but at different geographic scales and levels of detail. Sugar Access provides accessibility measures for all modes, but the quality of analysis depends on the availability of reliable network data.
Accessibility scores for different modes are typically reported separately. Some researchers, however, describe methods for combining modal scores (30, 33).
Scales of analysis
Walk Score measures only local conditions (within 1.5 miles of a given address), but scores can be aggregated up to any geographic level. Sugar Access measures accessibility from any given location (e.g., parcels) to all jobs or POIs within one hour, and can aggregate up to the census block or larger. Both the Accessibility Observatory and the Renaissance Planning Group measure automobile accessibility at the scale of traffic analysis zones (TAZs), but recognize the need for more fine-grained analysis. The Accessibility Observatory produces measures of transit accessibility at the census block level. The Renaissance Planning Group develops accessibility metrics for automobiles and transit at the TAZ level, but for pedestrians at the block level. They then overlay TAZ-level transit data with block-level estimates of pedestrian accessibility in order to achieve discounted estimates of transit accessibility at the block level.
McCahill & Ebeling
6
Transportation networks and network conditions
In order to serve the most important functions related to transportation planning and project selection, accessibility measures must incorporate information about transportation networks and travel times by time day of day, including route schedules for transit.
The original Walk Score measures straight-line distances to amenities and services and accounts for factors such as population density, block lengths and intersection density within a given area. The Street Smart Walk Score, used in annual citywide rankings, measures actual travel distances based on the pedestrian network (34). Walk Score’s transit and bike scores are based on rough estimates of service quality near any location (35).
Each of the remaining tools uses the most comprehensive road network data available for the region of interest. The Accessibility Observatory measures automobile accessibility by
characterizing network conditions at a macroscopic level (28) and, in more comprehensive analyses, by modeling travel between zones using local data (30). Sugar Access relies on general automobile travel time data provided by HERE (formerly NAVTEQ) and its provider works with users to develop basic bicycle and pedestrian networks, or lets users incorporate their own. The Renaissance Planning Group relies on information from local travel surveys, travel demand models, and traffic counts, where applicable, but they are also developing techniques to use enhanced HERE data for automobile travel times (33).
The Accessibility Observatory, Sugar Access and, more recently, the Renaissance Planning Group rely on General Transit Feed Specification (GTFS) route and schedule data, which is made available by most transit agencies (27, 30, 33).
Accessibility metrics
Any effort to quantify accessibility must grapple with the question of how far a destination can be and still be considered accessible. One approach is to count the number of destinations, or “cumulative opportunities,” reachable within a given travel threshold—for example, jobs within 30 minutes. A more advanced approach, however, recognizes that destinations gradually become less attractive as travel times increase. This can be accounted for by weighting each destination based on a decay factor that represents its distance from the origin.
Walk Score, Sugar Access, and the Renaissance Planning Group each use a decay factor derived from travel surveys. Walk Score, for example, awards points to various amenities and services based on their distance from a given address. Destinations within 0.25 miles (a five-minute walk) score the maximum point value. Point values decay up to a distance on 1.5 miles. Anything farther earns zero points (35).
Sugar Access uses a similar approach, but measures accessibility using a decay function based on data from the National Household Travel Survey. Unlike Walk Score, Sugar Access allows its users to adjust targets and weights for different scoring categories (e.g., banks, grocery stores, and schools). Sugar Access also offers a variety of more basic measures such as the number of cumulative opportunities within a given travel time from a particular location (36).
The Renaissance Planning Group measures accessibility for each mode by dividing
cumulative opportunities by their travel times and corresponding decay factors, depending on the type of trip (31, 32).
The Accessibility Observatory, which focuses on access to jobs, describes methods for incorporating decay factors (28, 30), but they typically report the number of cumulative opportunities from a given location, due to the measure’s simpler interpretation (29, 30).
McCahill & Ebeling
7
Table 3. Relative tool capabilities based on review of research and documentation Walk Score Sugar Access Accessibility
Observatory
Renaissance Planning
Group
Availability Free For purchase Proprietary Proprietary
Multimodality
Automobile N/A Advanced Advanced Advanced
Transit Basic Advanced Advanced1 Advanced
Bike Basic Moderate2 N/A Moderate2
Walk Advanced Advanced N/A Advanced
Scale
Local Advanced Advanced Moderate Moderate
Regional Basic Advanced Advanced Advanced
Strength of metrics
Network conditions Basic Moderate3 Advanced Advanced
Decay function Advanced Moderate N/A4 Advanced
Access to jobs Basic5 Advanced Advanced Advanced
Access to all other
points of interest Advanced Advanced N/A Advanced
Uses
Visualization Moderate6 Advanced Advanced Advanced
Gap identification Basic Moderate Moderate Moderate
Project evaluation N/A Advanced Moderate Advanced7
1) The researchers model transit accessibility for every minute during an analysis period. 2) The analysis depends on the quality of data regarding the bicycle network, which may not be
clearly defined or well understood.
3) General travel speed data from HERE does not account for changes in demand.
4) The researchers recognize the value of measuring "weighted opportunities accessibility," which accounts for decay through use of gravity function, but typically rely on a measure of "cumulative opportunities accessibility," which uses a single time threshold.
5) The score includes access to job opportunities, though not explicitly.
6) Heat maps are occasionally made available for major cities; data is available to researchers. 7) The researchers have developed methods for estimating mode share based on accessibility
metrics.
DISCUSSION
To reiterate, the evaluation above is based on a review of available literature and
documentation, rather than on applied case studies, and many of the tools considered are still in various stages development and refinement. Nonetheless, this paper provides valuable insight into the current state of accessibility measures and the relative strengths and weaknesses of the existing tools.
Accessibility measures are necessary for equity analyses in order to ensure that transportation systems are serving their intended purpose for all segments of the population, including EJ groups. However, accessibility measures that are limited in scope or functionality may not be capable of meeting those needs. For example, tools that define accessibility in terms of only one mode or destination type often do not paint a full enough picture, while metrics that are defined
McCahill & Ebeling
8
too coarsely (e.g., the number of destinations within 30 minutes) may not capture the benefits of local accessibility, which are quantifiably greater. Developing a tool that reflects all of these needs is a challenge, but the methods and data sources described in this paper prove that it is possible.
The demands of equity analyses pose another important challenge: the ability to identify various demographic and EJ groups in an accessibility analysis. For each of the tools described above, the census block is generally the finest scale to which that type of data is aggregated. Privacy concerns, along with the difficulty of collecting information such as income, race or physical ability at the individual or household level, make a finer-grained equity analysis essentially implausible and maybe even undesirable.
Beyond opportunities
It is important to note that the accessibility metrics included here measure access to
opportunities, but not actual activities. For example, a person might have good access to a large number of jobs (opportunities), but poor access to their actual place of employment (an activity). Travel surveys and similar data like journey-to-work flows from the Census provide some insight into actual activities, particularly in the case of jobs. Moreover, emerging location data from sources such mobile phones, navigational devices and wearable fitness devices are even more promising because they can potentially identify trips to a wider range of destinations throughout the day and by multiple modes. While not yet fully developed, these will likely play a key role in the further development of equity analyses.
CONCLUSIONS
This paper presents a general framework for conducting equity analyses in the transportation field—focusing specifically on accessibility, which is considered the primary function of
transportation. Based on a review of literature and related documentation, we identify one tool that meets many of the criteria for conducting equity analyses and two others that are still in development but also show promise. Walk Score, while available to the public, is limited in its practical uses. A case study using each of the most promising tools is needed to further evaluate their practical applications, usability and the quality of outputs.
REFERENCES
1. Dumbaugh, E., J. Tumlin, and W. E. Marshall. Decisions, Values, and Data:
Understanding Bias in Transportation Performance Measures. ITE Journal, No. August, 2014.
2. Litman, T. Evaluating Transportation Equity. World Transport Policy & Practice, Vol. 8, No. 2, 2002, pp. 50–65.
3. Santos, B., A. Antunes, and E. J. Miller. Integrating Equity Objectives in a Road Network Design Model. Transportation Research Record: Journal of the Transportation Research Board, Vol. 2089, Dec. 2008, pp. 35–42.
4. Levinson, D. Equity Effects of Road Pricing: A Review. Transport Reviews, Vol. 30, No. 1, Jan. 2010, pp. 33–57.
5. Patterson, T. M., and D. M. Levinson. Lexus Lanes or Corolla Lanes? Spatial Use and Equity Patterns on the I-394 MnPASS Lanes. Vol. 3, No. March, 2008.
6. Altshuler, A. Equity, Pricing, and Surface Transportation Politics. Urban Affairs Review, Vol. 46, No. 2, Aug. 2010, pp. 155–179.
McCahill & Ebeling
9
7. Zhang, L., and D. Levinson. Balancing Efficiency and Equity of Ramp Meters. No. June, 2005, pp. 477–482.
8. Junge, J. R., and D. Levinson. Prospects for transportation utility fees. Journal of Transport and Land Use, Vol. 5, No. 1, 2012, pp. 33–47.
9. Rybeck, R. Funding Long-Term Infrastructure Needs For Growth , Sustainability & Equity. Vol. 2013, 2013.
10. Santos, G., H. Behrendt, L. Maconi, T. Shirvani, and A. Teytelboym. Part I: Externalities and economic policies in road transport. Research in Transportation Economics, Vol. 28, No. 1, Jan. 2010, pp. 2–45.
11. Timilsina, G. R., and H. B. Dulal. Urban Road Transportation Externalities: Costs and Choice of Policy Instruments. World Bank Research Observer, Vol. 26, 2010, pp. 162– 191.
12. Bills, T. S., E. a. Sall, and J. L. Walker. Activity-Based Travel Models and Transportation Equity Analysis. Transportation Research Record: Journal of the Transportation
Research Board, Vol. 2320, Dec. 2012, pp. 18–27.
13. Welch, T. F., and S. Mishra. A measure of equity for public transit connectivity. Journal of Transport Geography, Vol. 33, Dec. 2013, pp. 29–41.
14. Welch, T. F. Equity in transport: The distribution of transit access and connectivity among affordable housing units. Transport Policy, Vol. 30, Nov. 2013, pp. 283–293.
15. Mollanejad, M., and L. Zhang. Incorporating spatial equity into interurban road network design. Journal of Transport Geography, Vol. 39, Jul. 2014, pp. 156–164.
16. Delbosc, A., and G. Currie. Using Lorenz curves to assess public transport equity. Journal of Transport Geography, Vol. 19, No. 6, Nov. 2011, pp. 1252–1259.
17. Martens, K. Justice in Transport as Justice in Accessibility: Applying Walzer’s “Spheres of Justice” to the Transport Sector. Transportation, Vol. 39, No. 6, Nov. 2012, pp. 1035– 1053.
18. Duthie, J., and S. T. Waller. Incorporating Environmental Justice Measures into Equilibrium-Based Network Design. Transportation Research Record: Journal of the Transportation Research Board, Vol. 2089, Dec. 2008, pp. 58–65.
19. Pirie, G. H. Measuring accessibility: a review and proposal. Environment and Planning A, Vol. 11, No. 3, 1979, pp. 299–312.
20. El-Geneidy, A. M., and D. M. Levinson. Access to Destinations: Development of Accessibility Measures. 2006.
21. Frumkin, H. Urban Sprawl and Public Health. Public Health Reports, Vol. 117, No. 3, 2002, pp. 201–217.
22. Thomopoulos, N., S. Grant-Muller, and M. R. Tight. Incorporating equity considerations in transport infrastructure evaluation: Current practice and a proposed methodology.
Evaluation and Program Planning, Vol. 32, No. 4, 2009, pp. 351–359.
23. Frank, L. D., and P. Engelke. Multiple Impacts of the Built Environment on Public Health: Walkable Places and the Exposure to Air Pollution. International Regional Science
Review, Vol. 28, No. 2, Apr. 2005, pp. 193–216.
24. Currie, G. Quantifying spatial gaps in public transport supply based on social needs.
Journal of Transport Geography, Vol. 18, No. 1, 2010, pp. 31–41.
25. Mamun, S. A., N. E. Lownes, J. P. Osleeb, and K. Bertolaccini. A method to define public transit opportunity space. Journal of Transport Geography, Vol. 28, 2013, pp. 144–154. 26. About Walk Score. https://www.walkscore.com/about.shtml. Accessed Sep. 4, 2015.
McCahill & Ebeling
10
27. Sugar Access for Arcgis. http://citilabs.com/software/products/sugar-access-arcgis. Accessed Sep. 4, 2015.
28. Levinson, D. M. Access Across America. 2013.
29. Owen, A., and D. Levinson. Access Across America: Transit 2014. 2014.
30. Owens, A., and D. Levinson. Access to Destinations: Annual Accessibility Measure for the Twin Cities Metropolitan Area. 2012.
31. Kuzmyak, J. R., J. Walters, M. Bradley, and K. M. Kockelman. Estimating Bicycling and Walking for Planning and Project Development: A Guidebook. Publication 770. National Cooperative Highway Research Program, 2014.
32. State Smart Transportation Initiative. Accessibility: Towards a new multimodal system performance metric SSTI. http://www.ssti.us/Events/accessibility-towards-a-new-multimodal-system-performance-metric/. Accessed Jan. 1, 2015.
33. Renaissance Planning Group. Pilot Test of Multimodal Accessibility Approach in a Major Corridor. 2015.
34. Musiker, R. Walk Score Ranks The Most Walkable Cities of 2015.
https://www.redfin.com/blog/2015/04/walk-score-ranks-the-most-walkable-cities-of-2015.html. Accessed Sep. 4, 2015.
35. Walk Score Methodology. https://www.walkscore.com/methodology.shtml. Accessed Feb. 1, 2015.
36. Calculating Access Score. Provided by Citilabs March 27, 2015.
37. Ver Ploeg, M., L. Mancino, J. E. Todd, D. M. Clay, and B. Scharadin. Where Do Americans Usually Shop for Food and How Do They Travel To Get There? Initial Findings From the National Household Food Acquisition and Purchase Survey. Washington, DC, 2015.