National Louis University
Digital Commons@NLU
Dissertations4-2018
Improving Progress Structures To Impact Student
Achievement At An Elementary School
Kimberly Harper-Young National Louis University Kimberly Harper-Young National Louis University
Follow this and additional works at:https://digitalcommons.nl.edu/diss
Part of theEducational Leadership Commons
This Dissertation - Public Access is brought to you for free and open access by Digital Commons@NLU. It has been accepted for inclusion in Dissertations by an authorized administrator of Digital Commons@NLU. For more information, please [email protected].
Recommended Citation
Harper-Young, Kimberly and Harper-Young, Kimberly, "Improving Progress Structures To Impact Student Achievement At An Elementary School" (2018).Dissertations. 302.
IMPROVING PROGRESS MONITORING STRUCTURES TO IMPACT STUDENT ACHIEVEMENT IN AN ELEMENTARY SCHOOL
Kimberly Harper-Young
Educational Leadership Doctoral Program
Submitted in partial fulfillment of the requirements of
Doctor of Education
in the Foster G. McGaw Graduate School
National College of Education National Louis University
i
DIGITAL COMMONS DOCUMENT ORIGINATION STATEMENT
This document was created as one part of the three-part dissertation requirement of the National Louis University (NLU) Educational Leadership (EDL) Doctoral Program. The National Louis Educational Leadership EdD is a professional practice degree program (Shulman et al., 2006). For the dissertation requirement, doctoral candidates are required to plan, research, and
implement three major projects, one each year, within their school or district with a focus on professional practice. The three projects are:
• Program Evaluation • Change Leadership Plan • Policy Advocacy Document
For the Program Evaluation candidates are required to identify and evaluate a program or practice within their school or district. The “program” can be a current initiative; a grant project; a common practice; or a movement. Focused on utilization, the evaluation can be formative, summative, or developmental (Patton, 2008). The candidate must demonstrate how the
evaluation directly relates to student learning. This program evaluation examined the impact of teacher efficacy on progress monitoring structures to impact student achievement. Teacher efficacy is an important factor in implementing progress monitoring structures with fidelity to impact student achievement.
In the Change Leadership Plan candidates develop a plan that considers organizational possibilities for renewal. The plan for organizational change may be at the building or district level. It must be related to an area in need of improvement, and have a clear target in mind. The candidate must be able to identify noticeable and feasible differences that should exist as a result of the change plan (Wagner et al., 2006). When teachers implement the instructional cycle with fidelity, planning instruction, incorporating research based practices, assessing instruction, and analyzing data, the use of progress monitoring can shift from a mundane task needing to be completed for the administration, district, and/or state, to an integral component of teaching (Santi & Vaughn, 2007).
In the Policy AdvocacyDocument candidates develop and advocate for a policy at the local, state or national level using reflective practice and research as a means for supporting and promoting reforms in education. Policy advocacy dissertations use critical theory to address moral and ethical issues of policy formation and administrative decision making (i.e., what ought to be). The purpose is to develop reflective, humane and social critics, moral leaders, and
competent professionals, guided by a critical practical rational model (Browder, 1995). High quality school leadership is pertinent to improving school performance and raising student achievement. Implementing this policy could create a more equitable evaluation system to support, hire, and retain effective leadership in every school in Chicago.
Works Cited
Browder, L.H. (1995). An alternative to the doctoral dissertation: The policy advocacy concept and the policy document. Journal of School Leadership, 5, 40-69.
Patton, M. Q. (2008). Utilization-focused evaluation (4th ed.). Thousand Oaks, CA: Sage. Shulman, L.S., Golde, C.M., Bueschel, A.C., & Garabedian, K.J. (2006).
Shulman, L.S., Golde, C.M., Bueschel, A.C., & Garabedian, K.J. (2006). Reclaiming education’s doctorates: A critique and a proposal. Educational Researcher, 35(3), 25-32.
Wagner, T., et al. (2006). Change leadership: A practical guide to transforming our schools. SanFrancisco: Jossey-Bass.
i ABSTRACT
This Change Plan paper is the second part of a three-part dissertation on improving the progress monitoring structures to impact student achievement. Progress monitoring is a powerful instructional tool within the instructional cycle to increase student performance. When teachers implement the instructional cycle with fidelity, planning instruction, incorporating research based practices, assessing instruction, and analyzing data, the use of progress monitoring can shift from a mundane task needing to be completed for the administration, district, and/or state, to an integral component of teaching (Santi & Vaughn, 2007).
Wagner et al’s (2006) As-Is and To-Be charts were used for ABC Elementary School, a pseudonym for a charter school located on the South Side of an urban
community in the Midwest, to identify and present the current status and future desired state of the school’s competencies, conditions, culture, and context. As well, this research examined research-based strategies to implement progress-monitoring structures to impact student achievement.
ii PREFACE
During the experience of crafting this change plan, numerous revelations by school staff were articulated. Some teachers felt that having to implement progress monitoring structures was a form of them being punished because students were not learning. Some teachers did not implement data driven instruction (DDI) cycles with fidelity. Still others indicated they felt that progress monitoring was not needed to determine if students were learning or not. These feelings impacted how progress-monitoring practices were implemented.
While student achievement was below expected levels, teachers did not seem to take ownership. Upon reflection regarding teacher ownership for student achievement, this researcher contemplated how leaders must balance accountability while nurturing teacher development. Teacher accountability should not just be aligned to high-stakes testing, but should also encompass teacher’s job expectations being completed to a certain level. On occasion, teachers request they be treated as professionals—only to argue about being treated as such. This equivocal position leads to school leaders sometimes being confused as to how to balance holding teachers accountable while also trying to a) build staff efficacy, b) use data, c) increase instructional capacity, and d) increase classroom management skills.
The ability to determine when teachers are deciding not to perform (as opposed to not being able to perform), represents a vital skill that school leaders will need in order to impact student achievement. School leaders cannot allow school staff to consistently build their capacity while students are not improving. When is enough, enough?
iii
Table of Contents
ABSTRACT ... i
PREFACE ... ii
TABLE OF CONTENTS ... iii
LIST OF TABLES ... iv
LIST OF FIGURES ... v
SECTION ONE: INTRODUCTION ... 1
Statement of the Problem ... 2
Rationale ... 3
Goals ... 5
Demographics ... 6
SECTION TWO: ASSESSING THE 4 CS (AS-IS)... 8
Competencies ... 8
Conditions ... 10
Culture ... 11
Context ... 12
SECTION THREE: RESEARCH METHODOLOGY ... 13
Participants ... 14
Data Gathering Techniques ... 15
Data Analysis Techniques ... 16
Conclusion ... 17
SECTION FOUR: RELEVANT LITERATURE ... 18
Introduction ... 18
Progress Monitoring System ... 20
Components of Progress Monitoring ... 22
Core Components of Implementation ... 25
Implementation Fidelity ... 26
TechnologyEnhanced Progress Monitoring ... 29
SECTION FIVE: DATA ANALYSIS & INTERPRETATION ... 31
Findings ... 31
Academic History ... 31
iv
Questionnaire ... 37
Progress Monitoring at ABC Elementary ... 39
Competencies ... 45
Conditions ... 48
Culture ... 53
Context ... 58
SECTION SIX: A VISION OF SUCCESS (TO-BE ... 59
Competencies ... 59
Conditions ... 62
Culture ... 65
Context ... 67
Conclusion ... 69
SECTION SEVEN: STRATEGIES AND ACTIONS FOR CHANGE ... 72
Competencies ... 73 Conditions ... 75 Culture ... 76 Context ... 78 Conclusion ... 80 REFERENCES ... 81 APPENDICES ... 88 Appendix A ... 89 Appendix B ... 90 Appendix C ... 91
v
LIST OF TABLES
Table 1- School Status Descriptions ... 35
Table 2- SQRP Indicators ... 36
Table 3- School Status Ratings ... 37
Table 4- Implementing the XYZ Tool at ABC Elementary ... 42
Table 5- Progress Monitoring at ABC Elementary ... 45
Table 6- Competency Using Progress Monitoring ... 47
Table 7- Using the XYZ Tool to Impact Student Achievement ... 48
Table 8- Conditions at ABC Elementary School ... 51
Table 9- Culture at ABC Elementary ... 55
Table 10- Implementation of XYZ Tool ... 56
vi
LIST OF FIGURES
Figure 1. ABC Elementary’s NWEA MAP Reading MAP Data Growth for students in Grades 8………33 Figure 2. ABC Elementary’s NWEA Math MAP Growth for students in
Grades 3–8……….33 Figure 3. ABC Elementary School’s NWEA MAP Reading—Attainment for students
in Grades 3–8………..…..34 Figure 4. ABC Elementary School’s NWEA MAP Reading—Attainment for students
1
SECTION ONE: INTRODUCTION
Instruction has been identified as one of the most important factors impacting student achievement(Rivkin & Schiman, 2015). Progress monitoring is a process used to determine if the instruction meets the needs of all students. If implemented correctly, progress monitoring can accelerate student learning and allow teachers to make more informed decisions regarding teaching and learning(Fuchs & Fuchs, 2002; Safer & Fleischman, 2005; Ysseldyke & Bolt, 2007).
As teachers, administrators, and members of the instructional leadership team use student performance data to inform instructional decisions, implementing progress-monitoring structures assuring fidelity of implementation or the Data Driven Instruction (DDI) represent a challenge. At ABC Elementary School (a pseudonym for a charter school located on the South Side of an urban community in the Midwest and hereafter referred to as ABC Elementary), change is needed; however, such a change must include the support of the teaching staff, the administrative team, and the instructional leadership team. This study focuses on using the change levers (data, accountability, and
relationships) to implement progress-monitoring structures and create a clear DDI cycle to positively impact student achievement through a collaborative change process at ABC Elementary.
2
Statement of the Problem
Progress monitoring is an effective practice that allows teachers to track student progress, create stronger instructional programs, and make decisions regarding teaching and learning (Fuchs & Fuchs, 2002). When progress monitoring is implemented
correctly, the following can occur:
• Helps teachers make informed decisions about teaching and learning. • Students receive appropriate instruction.
• Provides documentation for accountability.
• Be used as a source to communicate students’ progresses to families. • Serves as a tool for teachers to set expectations for students. (Dexter &
Hughes, 2009)
When progress monitoring is implemented with fidelity, students gain
significantly more than students who were not progress-monitored (Ysseldyke & Bolt, 2007). Poorly implemented progress monitoring is one of the greatest obstacles to teacher effectiveness.
In 2001, when the federal government imposed a new educational reform known as the No Child Left Behind (NCLB) Act, a drastic change was observed in school environments. The cultural shiftcan be seen in the schools and its accountability
structures. Poor-performing schools were continuing to undereducate students. As well, evidence of curriculum reductionism could be seen throughout schools focused on reading and math. Curriculum varied school to school, district to district, city to city, and state to state. Schools were confronted with different challenges in ensuring that the progress-monitoring structure within the DDI cycle were implemented with fidelity.
3
Some of these challenges included poor implementation of progress-monitoring structures, implementation of the DDI cycle, lack of proper training, and change resistance behavior. Paul Bambrick-Santoyo (2010) described the DDI cycle as consisting of assessment, analysis, action planning, and progress monitoring.
Increasingthe quality of implementation of progress-monitoring structuresand ensuring the efficacy of the DDI cycle in every classroom can positively impact student achievement and is vital for improving student achievement (Fenton & Murphy, 2011). The lack of implementing progress monitoring effectively would result in poor student performance (Shapiro, 2011). This study evaluated how implementing effective progress-monitoring structures can impact students’ achievements. The change plan focused on a school’s current contexts, competencies, cultures, and conditions, as well as on
implementing a clear plan for the DDI cycle (Wagner et al., 2006).
Rationale
Assessment plays a significant role in the success of an educational institution. In the past, school accountability did not require schools to focus on success for all students. Schools did not emphasize the use of data systems, in detail, to determine the school’s success. Poor student performance and high dropout rates were seen as a student, family, or community problem and not the school’s failure to serve. State assessment measures have been in place for numerous years; yet, districts and schools continue to
underperform. However, at the turn of the 21 century, accountability became a reality. The NCLB represents a U.S. Act of Congress that attempted to address this underperformance of students. The NCLB supported standards-based education reform based on the premise that setting high standards would promote greater student
4
achievement. The act required states to develop assessments in basic skills to receive federal school funding. States had to give these assessments to all students at select grade levels. This act made the need to measure a student’s progress toward standards mastery more necessary (Linn, Baker, & Betebenner, 2002).
Data Driven Instruction practices swiftly became a major influence of education. Schools and districts decided they needed a structured way to measure how students were progressing toward expectations. They began to implement progress-monitoring
structures and used the measures to hold teachers, schools, and districts accountable. Initially, many schools did not have a specific tool to measure student performance. Eventually, schools implemented a structured process for progress monitoring by utilizing a designated tool. Educators were then held accountable for making progress toward the agreed upon learning outcomes for their students.
In 2010, former Illinois Governor, Pat Quinn, signed the Performance Evaluation Reform Act (PERA). This changed how teachers’ and principals’ performance were measured at the state level. The new evaluation systems required the use of student growth and professional practice to measure individual performance (Delgado, LaVia, Ford, & Froehlich, 2006). This change in the evaluation process further encouraged the use of progress monitoring to inform teaching and learning. School leadership uses the obtained assessment data to analyze educational programs, evaluate teachers’
performance, and allocate resources. Teachers use the data to identify student’s strengths and weaknesses, plan lessons, provide targeted instruction, and measure students’
5
It is this researcher’s opinion that implementing a robust DDI cycle has been a major hindrance to improved student achievement. Based on the Program Evaluation, staff at ABC Elementary suggest that progress monitoring represents an additional task and conclude they do not have time to progress monitor (Harper-Young, 2017). School
staff often mention the lack of technology as an impediment to progress monitoring. Appreciating the current progress-monitoring system is another rationale school staff gave as a reason for the lack of fidelity as it pertains to progress monitoring. Based on
these statements, implementing a progress monitoring system appropriately is a necessity in any school.
This study was born out of a need for a positive improvement in the
implementation process of progress monitoring in the researcher’s school, district, and the larger community. Over the last 20 years, efforts have intensified in implementing technology-enhanced, progress-monitoring student academic performance and planning for teaching and learning (Bolt, Ysseldyke, & Patterson, 2010). This research explored the dual focus (e.g., organizational and individual change), which helps in understanding the school environment and creating effective school leadership. School leadership is the second most important factor impacting student achievement (Leithwood, Louis,
Anderson, & Wahlstrom, 2004).
Goals
This study’s objectives involve implementing a change plan that considers organizational possibilities for renewal and uncovers leadership strategies for personal transformation in implementing progress-monitoring structures and the DDI cycle with fidelity to positively impact student achievement. In addition, this study sought to
6
evaluate the microlevel areas within ABC Elementary that needed changing. This was done by considering Wagner et al.’s (2006) changeleadership framework to positively impact student achievement for every child.
Demographics
The selected school for this study is ABC Elementary, which is located on the South Side of an urban community in the Midwest. ABC Elementary has 60 teachers who teach different disciplines. The average retention rate for teachers is 11 years. The total student population is around 1300; approximately 800 of these 1300 students are in grades 3-8. The student population is comprised of 99% African American and 1% Hispanic—with 0.3% of the students being English Language Learners, 88.5% of the students being economically disadvantaged, and 14.7% of the students being diverse learners. The students average attendance rate is 92.2%.
School leadership follows NCLB reform—as all the necessities are provided to the students with and without disabilities. The school employs nine educational aids and three teachers assist each educational division.
Currently, on the district’s high-stakes assessment, 68% the students at ABC Elementary showed growth in reading, 58% in math; while 96% of the diverse learners showed growth in reading, 77% in math. The district utilizes the Northwest Evaluation Association Measure of Academic Progress (NWEA MAP) as the high-stakes
assessment. This is an adaptive online assessment aligned with the Common Core State Standards (CCSS). The difficulty of each question is based on the accuracy of the
previous question. As students answer correctly, the questions become challenging; if the student answers incorrectly, the questions become easier (Militello & Heffernan, 2009).
7
Student growth represents change on the district’s high-stakes assessment
between Spring 2015 and Spring 2016—as compared to other schools nationally with the same pretest score. The student growth percentile is the average spring-to-spring scale score growth of students on the NWEA MAP assessment—as compared to the average national growth for schools with the same average pretest score. Each school is assigned a percentile representing where it would fall on the national distribution.
Attainments is the percentage of reading and math tests taken in grades 3-8 where students met the national 50th percentile student growth score for students with the same pretest score. As far as attainment, 49% of the students met grade level attainment in reading and 32% of the students met grade level attainment in math.
8
SECTION TWO: ASSESSING THE 4 Cs (AS-IS)
Using Wagner et al. (2006), two charts were created: As-Is and To-Be (see Appendix A) for ABC Elementary. Wagner’s 4 Cs change model for organizational renewal has brought to light a challenge of many schools in implementing programs to support teaching and learning to improve student achievement. Wagner’s 4 Cs change model refers to the following:
1. Competencies 2. Conditions 3. Culture 4. Context
By exploring each of Wagner et al.’s (2006) 4 Cs, individual areas of ABC Elementary’s implementation practices that must be altered to implement progress-monitoring structures with fidelity to positively impact student achievement were identified. Applying the 4 Cs framework described in Wagner’s Change Leadership allowed this researcher to examine the poor implementation practices of many programs brought into the school.
Competencies
Wagner et al. (2006) described competencies as, “the repertoire of skills and knowledge that influences student learning” (p. 99). Teacher’s capacity for using the selected progress-monitoring tool is weak. Teachers were not allowed to provide any input in how students would be progress monitored or determine what tool would be used to monitor student progress. According to information from the questionnaire, teacher’s
9
capacity for using technology is minimal. Most teachers were not aware of the features supporting the tool, and none of the teachers who were aware of them used them.
The quality of the professional development provided (regarded using the selected progress-monitoring tool) is not beneficial, according to most of the teachers (Harper-Young, 2017). This professional development included lesson planning for intervention, understanding data, and reports—leveling individual paths for students and boosting student confidence and motivation. Teachers stated they received between one and two hours of professional development on the progress-monitoring tool. A consultant for the progress-monitoring tool interacted with school staff onsite throughout the school year but only provided a 2-hour session to the staff as a whole. Teachers expressed they were not engaged in most of the professional development and felt their time could have been better used on other tasks. School staff had numerous initiatives, protocols, and practices in which to develop competencies in throughout the school year and often felt
overwhelmed by the many expectations.
The school’s value of the DDI cycle needs improvement. Meetings around teaching and learning need to focus more on data and using it to inform teaching and learning. While the schedule provided opportunities for staff to meet weekly, there was not a clear system for disaggregating data. Effective DDI is based on strong assessment, analysis, action, and culture (Bambrick-Santoyo, 2010).
10 Conditions
Wagner et al. (2006) described conditions as “the external architecture
surrounding student learning, the tangible arrangements of time, space, and resources” (p. 101). The expectation at ABC Elementary is that at least 80% of the students will
demonstrate attainment—being at or above grade level in reading and math. Attainment measures performance at a single point in time, as compared to schools nationally. Ninety-nine percent of the students are expected to show growth in reading and math. Growth measures performance from one year to the next and evaluates a school’s performance based on how much growth occurred as compared to other schools
nationally with the same pretest score. A minimum of 75% of the students are expected to meet their growth target. The growth target is the amount of growth individual students are expected to grow in a school year. According to information provided on the ABC Elementary website, 42% of the students are at or above grade level in reading and 27 % of the students are at or above grade level in math at ABC Elementary. On the end-of-the-year high-stake assessment, 66% of the students showed growth in reading and 42% of the students showed growth in math. Students with Individualized Education Plans (IEPs; 80%) showed growth in reading with 61% of the students showing growth in math (56.9% of their students made their growth target). The average daily attendance for students was 92.6%.
ABC Elementary uses XYZ Progress Monitoring Tool (hereafter referred to as XYZ Tool), which is an instructional technology tool to progress-monitor student learning. XYZ Tool can be used to assess how well students are aligned with CCSS or regional state standards. The program can determine students’ strengths and the areas
11
where improvement is needed. More than 30 different types of assessment reports can be generated. Teachers can issue students’ parents a password so parents can keep track of their children’s progress online.
Culture
Wagner et al. (2006) defined culture as the shared values, beliefs, assumptions, behavior, and quality of relationships within and beyond the school. ABC Elementary is considered “Partially Organized for Improvement,” which means the school’s culture and climate has a few strengths, but also has several weaknesses in certain areas (Chicago Public School, 2016 School Progress Report, p. 1). Chicago Public Schools (CPSs) My Voice, My School 5Essentials survey (hereafter referred to as MVMS) was administered to students and teachers in collaboration with The University of Chicago Consortium on Chicago School Research (CCSR). The results from these surveys are included on schools’ School Quality Rating Policy (SQRP) to help inform schools, teachers, parents, and community members
.
The learning community at ABC Elementary views progress monitoring as another mundane task that needs complete. Teachers reported that this diminished teaching and learning, that the professional development received was not valuable, and the plan for progress monitoring structures was not clear. Further, teachers and parents’ current perceptions were that students were overtested and that most teachers did not take ownership for students’ poor performance.
Forty-two percent of the teachers at ABC Elementary felt that once implementing a program and ensuring it worked, many of the programs at the school simply came and went. Teachers felt their professionalism was challenged due to high accountability;
12
however, every teacher felt their administrator had confidence in their expertise.
Administrators and the district demanded the implementation of progress monitoring for reading and math.
Context
Context, as defined by Wagner et al. (2006), referred to the skill demands that all students must meet to succeed, relating concerns of the family and community the school serves. Context also referred to “the larger organizational systems within which we work, and their demands and expectations, formal and informal” (Wagner et al., 2006, p. 104).
ABC Elementary is located in a large urban city and serves approximately 800 African American students between grades K–8. ABC Elementary consists of 99% African American students and 1% Hispanic. Just over 89% (89.2) of the students are economically disadvantaged and receive free or reduced lunch. Just over 14% (14.3) of the students are considered diverse learners and have IEPs. ABC Elementary is
comprised of 30 teachers who teach grades 3-8; these teachers, on average, had 6 years of experience.
13
SECTION THREE: METHODOLOGY
This change plan research focused on improving student achievement through implementing the DDI cycle with fidelity. Additionally, a deeper look was taken at using a progress-monitoring tool to inform teaching and learning and using professional
development to build teacher capacity in using the DDI cycle. Qualitative and quantitative data was used to garner information to identify how ABC Elementary teachers currently implemented the DDI cycle to impact student achievement.
Information was extracted from the 2014, 2015, and 2016 School Progress Report Cards, which provided information about the school quality rating, the district’s high-stakes assessment data, demographics, attendance, and data from ABC Elementary’s website garnered from MVMS.
School Progress Reports are issued for all schools in the district every year, for charter and traditional. School Progress Reports are public record and provide
information regarding how well a school performed on the district’s high-stakes
assessment, the SQRP, school recognitions, school demographics, school attendance, and the percentage of students who are on and off track. The report also provided a
neighborhood map comparing surrounding schools.
The SQRP is the district’s policy for evaluating school performance (both charter and traditional). ABC Elementary happens to be a charter school functioning under one of the numerous charters in the City of Chicago. The information in this document establishes the indicators of school performance, student growth, and the benchmarks against which a school’s success will be evaluated on an annual basis. In addition, the SQRP is used to communicate to parents and community members about the academic
14
success of individual schools and the district as a whole. It recognizes high achieving, high growth schools, and identifies best practices, which provides a framework for goal-setting for the schools by identifying schools in need of targeted or intensive support and guiding the district’s decision-making processes for individual schools.
The MVMS is a tool for identifying a school’s strengths and weaknesses. The survey combined validated questions and rigorous analysis to measure a school’s performance in five essential areas:
1. Effective Leaders 2. Collaborative Teachers 3. Involved Families 4. Supportive Environment 5. Ambitious Instruction
The information from the MVMS is shared with administrators and used as predictors of student outcomes and school improvement.
The purpose of this paper was to improve the implementation practices of the DDI cycle to inform teaching and learning in efforts to ultimately raise student achievement. To meet this purpose, a collaborative approach was used to determine a sustainable strategy to improve the quality of education for ABC Elementary students.
Participants
The study consisted of the following participants:
• Grade 3 teachers (2)
• Grade 4 teachers (4)
15
• Grade 6 teachers (2)
• Grade 7 teachers (2)
• Grade 8 teachers (3)
Data Gathering Techniques
Data gathered from an electronic questionnaire was used to garner data from the teachers. The 75-question survey (see Appendix D) asked questions about teachers’ knowledge and practices around the implementation of progress-monitoring structures at ABC Elementary. Questions also provided information about student demographics and valuable demographic information about individual teachers and their capacity to implement progress monitoring. Participants were asked to participate in the study and provide information through an electronic questionnaire. Upon completion of the consent for participation, participants were emailed the questionnaire and given 2 weeks to complete. Information was compiled in an electronic Microsoft Excel spreadsheet and sent anonymously from a Google form. The only identifiers for this information were the number of years taught and grade level. While this researcher is not employed at ABC Elementary, she is employed at a school with similar student demographics.
Additional information was obtained from the school’s website, public
information from the School Report Card, and the MVMS. This information ascertained data around culture and climate, staff expectations, school goals, mission, and vision. After the study participants completed the questionnaire and the researcher reviewed the school’s public information, the researcher compiled qualitative data and analyzed trends regarding accountability and relationships. Wagner et al. (2006) suggested that qualitative data can serve as a powerful source for communicating key insights.
16
Additional data provided on MVMS (see Appendix F), which all schools in the district complete once a year, was analyzed. The MVMS is provided by an organization called UChicago Impact. UChicago Impact tools are currently being used in 60 major cities across 29 states nationwide. Schools in diverse settings—including rural Montana, Iowa; suburban St. Paul, Minnesota; Kansas City, Kansas; private, parochial, and public schools in Detroit, Michigan; as well as every school in the state of Illinois—use the UChicago Impact system of tools for training and professional development to build capacity for data-driven school improvement. The five essentials (consisting of effective leaders, collaborative teachers, involved families, supportive environment, and ambitious instruction) are necessary components for positive change. Utilizing the information provided in the survey helped the researcher to understand ABC Elementary’s strengths and weaknesses. This information was then used as leverage in developing the change plan.
Data Analysis Techniques
Data analysis for this change plan focused on qualitative data from a 75-question questionnaire (see Appendix D). Responses from the questionnaire were used to make an inference about the study participants thoughts and feelings regarding implementing progress monitoring on student achievement. Data from the MVMS survey was used to gain a better understanding of teachers’ feelings about instruction, professional
development, and school as a workplace. Information from the school’s website was used to validate the number of students, teachers, and other demographic information. The School Report Card was used to gather information about students’ academic progress on the high-stakes assessment in reading and math.
17 Conclusion
To ensure the researcher reached the end results ethically and appropriately, it was important to conduct this change leadership plan using the procedures outlined in this section. This study required significant input from teachers, administrators, and examining of the MVMS, the School Report Card, and the SQRP. It was equally important to interview administration to help toward interpreting information gathered from other sources. The purpose of the data collection process was to gather information about how teachers felt about the implementation structures and whether or not progress monitoring was being implemented with fidelity. Ultimately, this data informed and improved teacher instruction—resulting in a plan to implement progress-monitoring structures with fidelity to increase student achievement.
18
SECTION FOUR: RELEVANT LITERATURE Introduction
Research conducted by Fuchs and Fuchs (2002) concluded that when teachers systematically use progress-monitoring structures, the teachers are better able to identify the additional needs of students, the teachers design stronger instructional programs, and students make significant gains (p. 1). Progress monitoring, previously referred to as curriculum-based measurement, was initially created to assess the growth in basic skills of special education students, identify general education students at risk of academic failure, and as a predictor of success in early literacy programs (Deno, 2003; Good, Simmons, & Kameenui, 2001).
Accountability continues to be at an all-time high as the federal government, states, districts, schools, and teachers implement progress-monitoring structures to determine if the education students are receiving meets expectations (Reeves, 2003). The landmark NCLB federal mandate codified a developing policy view that standards, testing, and accountability were the path to improved performance (Hanushek & Raymond, 2005). In 2015, the Every Student Succeeds Act (ESSA) was instituted and replaced the NCLB act under President Obama’s administration. The ESSA federal educational mandate provided states with a framework for student achievement and accountability metrics; however, states have the autonomy to implement their own goals: long-term goals and smaller interim goals, which ultimately aligns to the purpose of providing all students with an excellent and equitable education (Korte, 2016). However, these goals must address proficiency on tests, English-language proficiency, and
19
A vital component in any educational system is assessment (Stecker, Lembke, & Foegen, 2008). States use assessment data to determine the effectiveness of their
educational programs, school districts use assessment data to monitor the success of their instructional programs, and teachers use assessment data to inform teaching and learning (Stecker, Lembke, & Foegen, 2008). There are many indicators used to specify student academic success, and progress monitoring is way to evaluate the indicators. Schools have implemented progress monitoring as a strategy for monitoring student learning for well over 40 years, but progress monitoring has intensified within the past 10 years (Bolt,
Ysseldyke, & Patterson, 2010).
Progress monitoring is one strategy used to determine the effectiveness of teaching on student learning. Progress monitoring is defined as “a practice that helps teachers use student performance data to continually evaluate the effectiveness of their teaching and make more informed instructional decisions” (Safer & Fleischman, 2005, p. 81). With the increased demands on schools to demonstrate student mastery of the curriculum on high-stakes assessments, progress monitoring provides a direct link
between the instructional process and high-stakes assessments. According to the National Center on Student Progress Monitoring, the purpose of progress monitoring is to
determine whether students are profiting appropriately from the instruction they are receiving and to build more effective programs for children who are not benefitting from the instruction (Fuchs & Fuchs, 2004).
Research supports progress monitoring as being one of the major factors differentiating effective schools and teachers from ineffective ones (Cotton, 1988; Edmonds, 1979). With this being the case, many classroom teachers are inadequately
20
trained on implementing progress monitoring to inform teaching and learning (Santi & Vaughn, 2007). This change plan researches best practices for implementing progress-monitoring structures to impact student achievement by analyzing Wagner et al’s (2006) arenas of change. Research further suggested that having a well-defined system for implementation can increase the likelihood of having an effective program that will be successful (Fixen et al., 2005).
This literature review includes evidence supporting progress monitoring as a vehicle to improve student achievement, the benefits of using progress monitoring to inform teachings and learning, components of an effective progress-monitoring system, stages of the implementation process, and the benefits of using a technology-enhanced progress-monitoring system.
Progress Monitoring Systems
Progress monitoring is a powerful instructional tool within the instructional cycle to increase student performance. When teachers implement the instructional cycle with fidelity, planning instruction, incorporating research based practices, assessing
instruction, and analyzing data, the use of progress monitoring can shift from a mundane task the administration, district, and/or state needs to complete to an integral component of teaching (Santi & Vaughn, 2007).
Progress monitoring allows educators to monitor the performance and progress of every student in their classroom. Using a technology based tool provides immediate feedback to teachers, which allows them to make quick adjustments to teaching and learning. Progress monitoring allows the teacher to assess whether the instruction provided students is effective. The benefits of using technology based
progress-21
monitoring tools include monitoring student’s individual learning needs, providing informative feedback to teacher, allowing teachers to adapt instruction as needed, and improving students’ overall academic experience (Ysseldyke & Bolt, 2007).
The National Center on Progress Monitoring, a clearinghouse funded by the U.S. Department of Education between 2003–2008, vetted progress-monitoring materials for their technical adequacy and impacts on student achievement. It reported that when progress monitoring is implemented correctly, students’ learning is accelerated because they receive more appropriate and targeted instruction, teachers make more informed decisions about teaching and learning, communication about student learning is
pinpointed more efficiently, fewer students are recommended for Special Education, and teachers hold higher expectations for student outcomes (National Center on Progress Monitoring, n.d.).
Shapiro (2011) suggested that when progress monitoring is done on a consistent basis, it provides students with an opportunity to see how moving toward their goals provides teachers with a clearer picture of the impact of the instruction received and serves as a vehicle to communicate with parents about their child’s progress. Research conducted by Ysseldyke & Tardrew (2007) found that teachers using progress monitoring provided more individualized instruction and were able to better meet the needs of their students.
Research conducted by Fuchs & Fuchs (2002) concluded that when teachers implement progress monitoring, they are able to identify gaps in student learning, differentiate instruction to meet the needs of students, create stronger instructional programs, and increase student learning opportunities impacting student achievement.
22
Fuchs & Fuchs (2005) noted that teachers effected significant levels of growth in student learning with progress monitoring only when they modified instruction based on progress-monitoring data.
Safer and Fleischman (2005) concluded that progress monitoring is a reliable and valid predictor of student performance. In addition, they demonstrated that when teachers use student progress monitoring with fidelity, students learn more, a teacher’s decision making improves, and students become more aware of their own performance. Additional research by Fuchs & Fuchs (1998) concluded that implementing progress monitoring with larger classrooms requires additional effort, but it provides a powerful resource tool that can help teachers adjust teaching and learning to ensure that all students reach high academic standards.
Components of Progress Monitoring
Effective progress-monitoring tools should include multiple components including:
1. Establishing and measuring academic goals.
2. Providing a vehicle for understanding how students are progressing toward established goals.
3. Creating opportunities for implementers to identify students potentially at risk for academic failure.
4. Offering data that can provide accountability evidence to parents, teachers, and educators about the impact of intervention programs. (Shapiro, 2011)
23
The academic goals for ABC Elementary are the Common Core State Standards. The goal of the standards is to increase students’ preparation for success in college and the workplace in a competitive, global economy. XYZ Tool is the tool used to understand how students are progressing toward mastering the standards. Students who need
additional support can be identified and adjustments made in teaching and learning. Stages of Implementation
Research suggested that six stages of implementation exist: 1. Exploration
2. Installation
3. Initial Implementation 4. Full Implementation 5. Innovation
6. Sustainability (Fixen et al., 2009)
The stages are cyclical and each stage impacts the others in complex ways. Fixen et al. (2009) further suggested that implementation is a recursive process that may take anywhere from two to four years (Saldana, Chamberlin, Wang, & Brown, 2012).
In the exploration stage, a potential match is identified that aligns to the needs of the stakeholders, evidence-based practices, and the needed resources to make a decision. After a decision is made, structural support is initiated to put the program in place for program installation. Additional resources are determined for funding, training and professional development. Initial implementation requires change as new learning is integrated. This can be one of the most difficult parts of the process (especially for the state)—when the implementation of a new practice fails (Fixen, 2009). Full
24
implementation occurs when the staff is fully trained. The program is being implemented with fidelity, and all vested parties facilitate the new practice. After the full
implementation, adaptations can occur in the innovation stage. At this stage, the school makes the implementation their own by making adjustments, possibly keeping what is working and and/or removing the parts that are not supporting school improvement. The goal for the sustainability stage is for the long term survival of the tool. During this stage, the effectiveness of the tool is evaluated, such as its ability to keep up with the changes that might occur; in addition, ensuring that when new staff members are hired, they are trained and that implementation continues with fidelity.
When considering the implementation of a progress-monitoring system, the Center on Response to Intervention recommends administrators, educators, and support staff alike discuss these factors:
1. Core Components of Implementation 2. Implementation Fidelity
3. Technology Enhanced Progress Monitoring 4. Benefits of Progress Monitoring
Developing an environment where these factors are discussed and reflected upon will support the implementation process.
25
Core Components of Implementation
Fixsen, Naoom, Blase, and Friedman (2005) identified four core implementation components for successfully implementing programs: practitioner selection, professional development, ongoing consultation and coaching, and administrative support. Fixsen et al. (2005) also suggested that how these components are implemented determine the effectiveness of the overall program. Practitioner selection supports recruiting the right people with the knowledge, skills, and capacity to implement the practice with fidelity. Proper professional development should expedite the knowledge base of those
responsible for implementation. Professional development should also give those
responsible for implementation opportunities to practice using the required tools, thereby providing the practitioners opportunities to become more effective at implementation. Ongoing consultation and coaching should provide practitioners access to skilled
professionals that can clarify their misconceptions and engage them in what if scenarios. This on the job support is where practitioners really develop capacity to perform the work at a high level. Coaching is the process by which behavioral change can be most likely to take place. This change might be the difference between tacit compliance and full
vestedness. It is imperative that administrators support the implementation process and the practitioners tasked with implementing the tool or practice. Administrators must provide the leadership necessary to set expectations, accountability, and progress
monitoring to evaluate the effectiveness of the implementation. Administrators must also encourage and support adjustments to the process when these are necessary.
26
Implementation Fidelity
Implementation fidelity refers to how well a program is implemented with adherence and integrity to the program design (Carroll, Patterson, Wood, Both, Rick, & Balain, 2007). Research suggested that the implementation process affects how well a program succeeds (Durlak & Dupre, 2008; Dusenbury, Brannigan, Falco, & Hansen, 2003; Mihalic, 2004). The concept of implementation fidelity is currently described and defined in terms of five elements that need to be measured (Carroll et al, 2007):
adherence, exposure, quality of delivery, participant responsiveness, and program
differentiation. Each of these implementation elements influence the degree to which the program will be effective. The element of adherence or the degree to which those responsible for implementing the program adheres to the program as it is designed when implementing the program. The element of exposure suggests that the person responsible for implementing the program ensure that the intended user is exposed to the program per the directions. The quality of delivery element of implementation presupposes that the delivery is exactly as outlined in the program. This should ensure that the quality of delivery does not negatively affect the outcomes. The element of participant
responsiveness postulates that if the other elements are implemented as outlined by the program, the participant should respond to the program as the control group. The program differentiation element purports that if any differentiation to the program is implemented it should only be done as outlined in the program—otherwise, the results may not be consistent with those based on the control group. Considering these elements will allow school districts to promote greater implementation fidelity. It is only by making an appropriate evaluation of the fidelity with which an intervention has been
27
implemented that a viable assessment can be made of its contribution to outcomes, e.g., its effect on performance (Carroll et al, 2007). Mowbray, Holter, Teague, and Bybee (2003) suggested that failed implementation is the most common reason for failed outcomes. Further research suggested that when programs are not implemented with
fidelity, programs do not have as much impact (Forgatch, Patterson, & & DeGarmo,
2006; McGrew & Griss, 2005: Resnick., Neale, & Rosenheck, 2003).
As this relates to the implementation of progress monitoring, school districts must consider if gains or losses in student performance is due to inherent flaws in a progress-monitoring system or a lack of fidelity of implementation by implementers. Therefore, school administrators must implement clear fidelity criteria guidelines to support implementation fidelity and monitor the structures to ensure appropriate execution. Having fidelity criteria should also promote external validity by providing adequate documentation and guidelines for replication projects adopting a given model (Mowbray et al., 2003). Structure and process are two aspects of fidelity criteria.
Structure encompasses the framework of service delivery and process comprises the way in which services are delivered. Fidelity criteria often include specification of the length, intensity, and duration of the service (or dosage); content, procedures, and
activities over the length of the services; roles, qualifications, and activities of staff; and inclusion/exclusion characteristics for the target service population (Kelly, Heckman, Stevenson, and Williams, 2000).
Fixsen et al. (2005) stated two major theoretical frameworks exist for moving science to service more effectively and efficiently: the stages of implementation and the core components of implementation. As described earlier in this section, Fixsen et al.
28
(2005) posited thereappeared to be six functional stages of implementation: exploration,
installation, initial implementation, full implementation, innovation, and sustainability. With every stage, the implementation process should be completed to support
implementation fidelity. Each stage provides the user with different information pertaining to the particular stage. The exploration stage allows users to compare and contrast the different products and be a part of choosing the tool. The installation stage allows the users to be a part of and gain an understanding of the infrastructure. During the initial implementation stage, users have the opportunity to test the tool, practice using it, and work out any concerns. The full implementation stage provides the users the
opportunity to use the tool for its intended purpose. Users are encouraged to extend the usefulness of the tool during the innovation stage. The sustainability stage represents a crucial component of the process in order for the tool to have a lasting impact on student achievement. Core implementation components drive practitioners to use progress monitoring effectively. These components are staff selection, preservice and in-service training, ongoing coaching and consultation, staff evaluation, decision support data systems, facilitative administrative support, and systems interventions (Fixsen et al., 2005). The stated processes support the fidelity of implementation. Mindfulness of these processes will strengthen the likelihood of the effectiveness of progress-monitoring implementation and therefore increase the validity of the results. School administrators must account for similar processes to ensure the success of a progress-monitoring system.
29
TechnologyEnhanced Progress Monitoring
Over the last 10 years, technology has become an integral advancement to the world of assessment. Studies conducted by Charman & Elmes (1998) and Slay & Rennie (1999) purport that students perform better when computer-based assessments are used. Using technology-based, progress-monitoring tools allow rapid formative feedback to students and teachers, allowing teachers quicker turnaround time to adjust instruction for students.
Many school districts use research-based, progress-monitoring tools such as Accelerated Reading (AR), Dynamic Indicators of Basic Early Literacy Skills(DIBELS),
NWEA MAP, mClass, Accelerated Math (AM), Renaissance, XYZ Tool, or Reading Rockets (Bolt, Ysseldyke, & Patterson, 2010: Ysseldyke & Bolt, 2007). As school districts strive to use progress monitoring as a strategy to improve student achievement, Fixsen et al. (2005) suggested that the six functional stages of implementation and the core components of implementation can support implementation fidelity. In-order for school districts to increase the likelihood that the data students and teachers receive after students participate in progress monitoring portrays an authentic picture of the student, school districts may want to use Fixsen et al’s (2005) six functional stages of
implementation and the core components of implementation to support their efforts. These stages and components can support school districts as they strive to deliver better progress-monitoring data to all stakeholders.
Ysseldyke, Spicuzza, Kosciolek, and Boys (2003) suggested students who used a technology-enhanced, progress-monitoring system outperformed students who did not. They further purported that students benefited more from teachers who implemented with
30
greater fidelity. Ysseldyke and Bolt (2002) suggested that when progress monitoring is implemented continuously using a technology-based program as intended, students’ data increased significantly—more than students who were not progress monitored on the program not implemented with fidelity.
31
SECTION FIVE: DATA ANALYSIS & INTERPRETATION Findings
The purpose of this change plan was to develop a plan to improve the
implementation structures at ABC Elementary using its current progress monitoring tool, XYZ Tool, to improve student achievement. A significant body of research garnered over the past 30 years supports the idea that progress monitoring is a reliable and valid
predictor of student performance, a useful tool for making informed decisions about teaching and learning, and an effective resource for targeting individual student learning needs (Roehrig, Duggar, Moats, Glover, & Mincey; Safer & Fleischman, 2005; Santi & Vaughn, 2007; Stecker, Lembke, & Foegen, 2008; Ysseldyke & Tardrew, 2007).
Qualitative and quantitative data was used to analyze trends in ABC Elementary’s academic history and to gain perspective on the school’s staff practices for implementing progress-monitoring structures to improve student achievement. Information pertaining to ABC Elementary’s current academic performance was analyzed from data on the
school’s website, the district’s website, and the Illinois Board of Education’s website. Information was also gathered from a questionnaire given to grades 3–8 teachers who taught reading and or math at ABC Elementary. Findings and researched best practices guided the development of an implementation plan for implementing the ABC Progress Monitoring Tool with greater fidelity.
32
Academic History
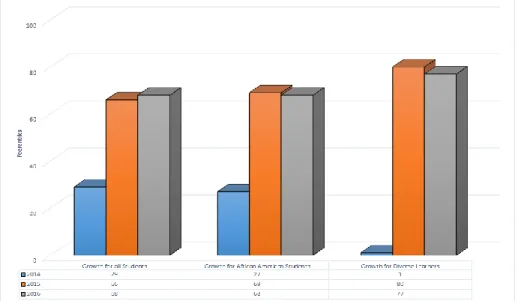
ABC Elementary has shown gradual improvement over that last couple of years (see Figures 1–4). In 2014, 29% of the students showed growth in reading, 1% of the diverse learners showed growth in reading, and 26% of the students met grade level attainment in reading. Also, 20% of the students showed growth in math, 1% of the diverse learners showed growth in math, and 17% of the students met grade level attainment in math. In addition, 60% of the students met their growth target overall in reading and math.
In 2015, 66% of the students showed growth in reading, 80% of the diverse learners showed growth in reading, and 42% of the students met grade level attainment in reading. As well, 42% of the students showed growth in math, 61% of the diverse
learners showed growth in math, and 27% of the students met grade level attainment. Lastly, 56.9% of the students met their growth target overall in reading and math.
In 2016, 68% the students showed growth in reading, 96% of the diverse learners showed growth in reading, 49% of the students met grade level attainment in reading, 58% of the students showed growth in math, 77% of the diverse learners showed growth in math, and 32% of the students met grade level attainment in math. In addition, 56.3% of the students met their growth target overall in reading and math.
33
Figure 1. ABC Elementary’s NWEA MAP Reading MAP Data—Growth for students in Grades 3–8.
34
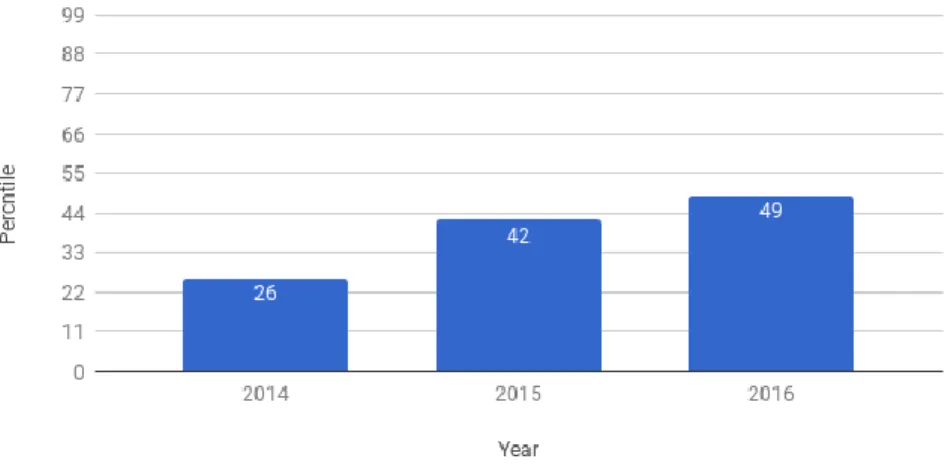
Figure 3. ABC Elementary School’s NWEA MAP Reading—Attainment for students in Grades 3–8.
Figure 4. ABC Elementary School’s NWEA MAP Reading—Attainment for students in Grades 3–8.
ABC Elementary is now considered a Provisional Support School (see Table 1) with a Level 2 Rating (see Table 2). Schools that fall in the Provisional Support category are provided additional support to improve teaching and learning. The district can also
35
require ABC Elementary to revise its school improvement plan, closely monitor their budget, and require specific professional development.
Table 1
School Status Descriptions
School Status
Good Standing
Good Standing is a school that has met or exceeded the district’s minimum performance standards. These schools must follow district
policies and mandates, but the LSC retains all normal autonomy.
Provisional Support
Provisional Support means that the school needs increased support. The network and CEO may require the school to revise its Continuous
Improvement Work Plan (CIWP) and/or budget and may require specific professional development.
Intensive Support
Intensive Support means the school needs a high level of support. In addition to the interventions listed for Provisional Support, the Board
of Education may—in extreme cases—take actions such as a turnaround or principal removal. These actions will not happen in all
Intensive Support schools and require a public hearing. A Level 2 status rating means that the school, overall, is performing below average and that additional support from the district is necessary. All schools in this district (including neighborhood, magnet, charter, selective enrollment, and options) receive a school quality rating each year. This system takes into account the different populations each school in the district serves. The indicators for the district in which ABC Elementary is located uses the following indicators for elementary schools:
1. NWEA MAP attainment
2. NWEA MAP growth
3. Student attendance
36
5. Student growth on ACCESS for English Language Learners
6. Data quality (see Table 2) Table 2
SQRP Indicators
Elementary Schools High Schools Option Schools
• Student attainment on the NWEA MAP test
• Student growth on the
NWEA MAP test
• Student attendance
• My Voice, My School
survey
• Student growth on
ACCESS for English Language Learners
• Data quality
• Student attainment on
the ACT assessment
• Student growth on the
ACT assessment
• Student attendance
• Graduation rate
• Freshman on-track
rate; dropout rate
• Students earning early college or career credentials
• College enrollment and
persistence
• My Voice, My School
survey
• Data quality
• Student growth on
the STAR test
• Graduation rate • Enrollment stabilization • Student attendance • Credit attainment
School Quality Rating Policy (SQRP)
The SQRP school score card is the district's policy for measuring annual school
performance. The school score card is used to communicate to school staff, school
leadership, local school councils (LSCs), parents, and the community about the academic success of individual schools and the district as a whole, recognizing schools with high achievement and/or high growth identified by best practices, providing a framework for schools to use to goal set, and guides the district's decision making process around school actions and turnarounds.
37
The score card is a five-tiered performance system based on a broad range of indicators (as Table 3 depicts) of success that include student test score performance, student academic growth, the closing of achievement gaps, school culture and climate, attendance, graduation, and preparation for postgraduation success. The current status of ABC Elementary is Level 2+.
Table 3
School Status Ratings
School Status Ratings Level
1+
Level 1+ is the highest performance; nationally competitive school with opportunity to share best practices with others
Level 1
Level 1 is high performance; a good school choice with many positive qualities and minimal support needed
Level 2+
Level 2+ is average performance; additional support from network team needed to implement interventions
Level 2
Level 2 is below average performance; provisional support rating means increased support from network
Level 3
Level 3 is the lowest performance; school is in need of intensive intervention. Directed by the district, charter schools in this category are on Academic
Warning List
Questionnaire
This researcher visited ABC Elementary in September 2016 and spoke to teachers at each of the grade level meetings. Each staff member was invited to participate in the study via answering an electronic questionnaire. Twenty teachers completed the consent form agreeing to participate via an emailed questionnaire; however, only 15 participated in the actual questionnaire. The teachers fell into the following categories:
38 • Grade 4 teachers (4) • Grade 5 teachers (2) • Grade 6 teachers (2) • Grade 7 teachers (2) • Grade 8 teachers (3)
All of the teachers completing the survey were African American; only 3 of the teachers had 5 years or more teaching experience. Of the remaining teachers, 10 had 3–4 years of teaching experience and 2 had less than 2 years of teaching experience.
According to information garnered from the questionnaire, 80% of the participants have classrooms that service between 26 to 30 general education with inclusion students. Participants reported that 100% of their students are African
American. One out of fifteen of the participants were only responsible for teaching math and the other fourteen were responsible for reading and/or a combination of other subjects in addition to reading.
The questionnaire consisted of 75 questions (see Appendix D). The researcher emailed the questionnaire to grades 3–8 teachers at ABC Elementary, who then
completed the questionnaire anonymously. One of the teachers began the questionnaire, but did not complete it; others opted to not participate for various reasons not associated with this research project. The questionnaires were then used to glean information in regards to teachers’ practices and perspectives on implementing the XYZ Tool at ABC Elementary. The responses were emailed anonymously so participants could not be directly linked to their responses.
39
Participants were asked a variety of questions about current practices and how progress monitoring is being implemented at ABC Elementary. Most of the participant’s progress-monitored students using laptops (86.7%), while the remaining used desktops (13.3%). The participants shared that 93.3% of the teachers at ABC Elementary
administered progress monitoring in their classrooms; the other 6.7% utilized a Technology Lab.
Another part of the questionnaire asked teachers questions about the professional development they had received on the XYZ Tool. A majority of the staff indicated
receiving 1–2 hours of professional development on the current progress-monitoring tool, with 13.3% reporting receiving 3–4 hours. Eighty percent of the teachers reported that the professional development received was valuable or extremely valuable, 60% reported additional training was needed, and 20% reported the professional development was not valuable at all. Approximately 90% of the teachers had been administering the current progress-monitoring tool for under 3 years; the remaining had been using the current tool between 4–5 years.
Progress Monitoring at ABC Elementary
The questionnaire asked about the structures of progress monitoring at ABC Elementary. This part of the questionnaire revealed information about the staff and their interactions with others.
Table 4 indicates that 85.7% of the teachers interacted with the consultant for the XYZ Tool only once the entire school year and 14.3% interacted with the consultant twice. Two teachers reported interacting with the consultant twice and none reported having contact more than twice. Staff training represents a critical component in
40
effectively implementing a progress-monitoring program to support student achievement in a school. Fixsen et al. (2005) identified four core implementation components for successfully implementing programs. One of the components is professional
development. Fixsen et al. (2005) also suggested that how these components are implemented determine the effectiveness of the overall program. For a program to be gauged as effective or not, the program has to be implemented with the intended fidelity. Therefore, school staff at ABC Elementary would need the appropriate professional development to implement the program as outlined by the publisher. Fixsen et al. (2005) posited that pre- and in-service training and ongoing coaching and consultation are also core components of the implementation process. Professional development should give the individuals responsible for implementation opportunities to practice using the
required tools, thereby providing the practitioners opportunities to become more effective during implementation. Teachers can really develop capacity to perform the work at a high level with this on-the-job support. This training structure may be effective for staff’s ability to properly implement the XYZ Tool at ABC Elementary.
Data revealed that 57.1% of the participants had at least four discussions with students regarding data from the XYZ Tool, while the remaining 42.9% had three or less discussions with students. Twenty-one percent (21.4%) of teachers reported discussing data with parents from the XYZ Tool once, 64.3% reported discussing data at least twice, and 14.3% reported having four discussions with parents. The questionnaire revealed that 57.1% of the participants had more than four discussions with Instructional Support Leaders (ISLs) while the other 42.9% had three or less discussions the entire year. In
41
addition, 57.1% of the participants had one discussion regarding the XYZ Tool with their principal, 28.6% had two discussions, and the remaining 14.3% had four discussions.
The data revealed that less than half of the teachers communicated with students and parents about the tool. Ensuring that the staff had a clear understanding of the tool would build confidence in using it, as well as discussing data from it with both
colleagues, parents, and students. Research suggested that properly trained teachers are more prepared and more likely to implement a new practice with greater fidelity (Durlak & DuPre, 2008). Implementing the DDI cycle could create a space for teachers to have conversations around the data and best practices regarding teaching and learning.